

Key Insights
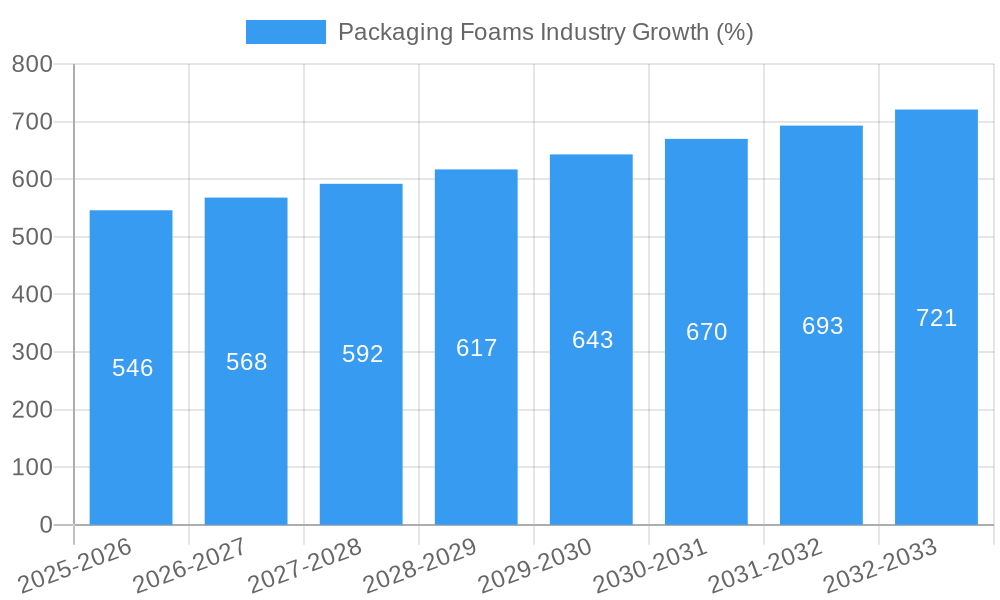
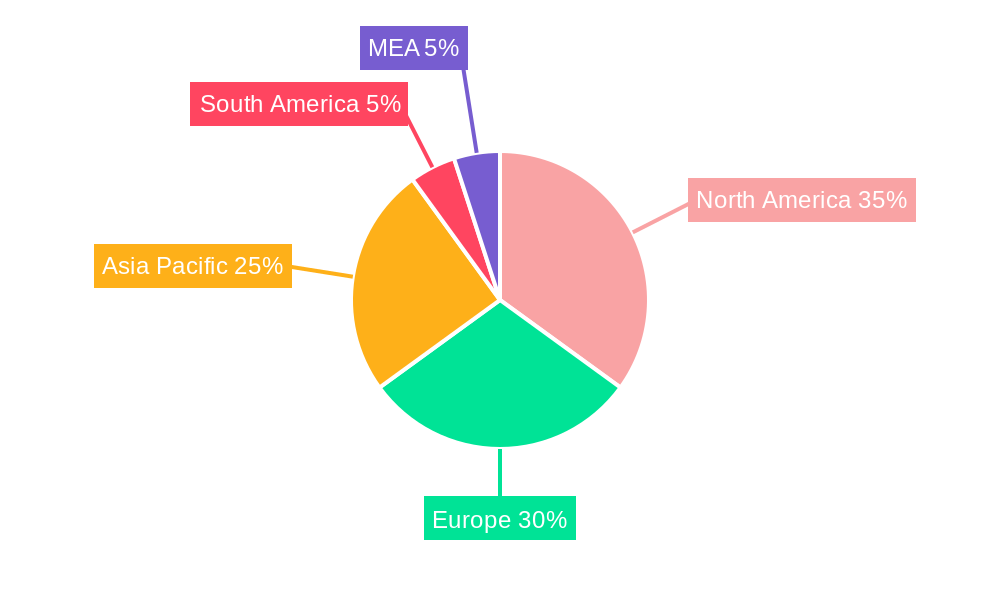
The global packaging foams market, valued at $11.67 billion in 2025, is projected to experience robust growth, driven by a compound annual growth rate (CAGR) of 4.68% from 2025 to 2033. This expansion is fueled by several key factors. The burgeoning e-commerce sector necessitates increased protective packaging, significantly boosting demand for flexible and rigid foams. Simultaneously, the growing emphasis on lightweighting in transportation and logistics is driving adoption of foam-based solutions to minimize shipping costs and environmental impact. Furthermore, advancements in material science are leading to the development of eco-friendly and recyclable foam alternatives, addressing sustainability concerns within the packaging industry. The increasing demand for customized packaging solutions across various industries, including food and beverages, electronics, and pharmaceuticals, further contributes to market growth. Regional variations exist, with North America and Europe currently holding significant market shares due to established industrial infrastructure and high consumption rates. However, rapidly developing economies in Asia-Pacific are poised to witness significant growth in the coming years, driven by rising disposable incomes and expanding manufacturing sectors.
Specific segments within the market demonstrate varying growth trajectories. The demand for flexible foams is expected to remain strong, driven by their versatility in cushioning and protecting fragile goods during transit. The rigid foam segment is anticipated to benefit from the rising construction and insulation industries, though the overall growth rate might be slightly lower compared to flexible foams. Material-wise, Polystyrene maintains a significant share due to its cost-effectiveness, but Polyurethane and Polyolefin are gaining traction due to their improved performance characteristics and sustainability profiles. The application-specific segments will experience different growth rates, with the food packaging segment experiencing steady growth influenced by factors like hygiene and product preservation, while industrial packaging will see growth propelled by the aforementioned e-commerce boom and industrial automation. Competitive landscape analysis reveals established players such as Recticel, Sealed Air, and Armacell leading the market, along with emerging companies focusing on innovation and sustainability. The forecast period (2025-2033) promises continued expansion, with considerable opportunities for both established and emerging players.

Packaging Foams Industry Market Report: 2019-2033
This comprehensive report provides a detailed analysis of the global Packaging Foams industry, offering invaluable insights for stakeholders, investors, and industry professionals. The study period covers 2019-2033, with 2025 serving as the base and estimated year. We forecast robust growth within the sector, driven by technological advancements and evolving consumer demands. This report delves into market dynamics, leading players, segment performance, and future opportunities, presenting actionable data to navigate the complexities of this dynamic market. The global market size is estimated at xx Million in 2025, projected to reach xx Million by 2033.
Packaging Foams Industry Market Dynamics & Concentration
The global packaging foams market exhibits a moderately concentrated landscape, with a few major players holding significant market share. Market concentration is influenced by factors such as economies of scale in production, technological advancements, and established brand recognition. Key innovation drivers include the development of sustainable and eco-friendly foams, improved insulation properties, and lighter-weight materials. Stringent environmental regulations regarding the use of certain materials are shaping the industry, pushing manufacturers towards more sustainable options. Product substitutes, such as alternative packaging materials like paper and biodegradable plastics, pose a competitive threat, necessitating continuous innovation. End-user trends, such as the increasing demand for e-commerce packaging and food preservation, are driving growth in specific segments.
Mergers and acquisitions (M&A) are frequent in the industry, reflecting the consolidation trend. Significant M&A activities have reshaped the competitive landscape, enabling companies to expand their product portfolios, increase their market share, and access new technologies. The number of M&A deals in the past five years has averaged approximately xx per year. Larger players often acquire smaller companies to gain access to specialized technologies or expand their geographic reach. For instance, the market share of the top 5 players is estimated at approximately xx% in 2025.
- Key Metrics:
- Market Concentration Ratio (CR5): xx% (2025)
- Average Annual M&A Deal Count (2019-2024): xx
- Average Market Share of Top 5 Players: xx%
Packaging Foams Industry Industry Trends & Analysis
The packaging foams market is experiencing significant growth, driven by a combination of factors. The Compound Annual Growth Rate (CAGR) for the forecast period (2025-2033) is estimated to be xx%. Technological disruptions, such as the development of advanced foam formulations with improved performance characteristics, are reshaping the industry. Consumer preferences are increasingly shifting towards sustainable and eco-friendly packaging options. This trend is pushing manufacturers to develop biodegradable and recyclable foams. The competitive dynamics are intense, with companies vying for market share through product differentiation, cost optimization, and strategic partnerships. Market penetration of sustainable packaging foams is steadily increasing, driven by consumer demand and regulatory pressures. The rising adoption of e-commerce is also a major factor, leading to increased demand for protective packaging materials.
Leading Markets & Segments in Packaging Foams Industry
The North American region is currently the leading market for packaging foams, followed by Europe and Asia-Pacific. This dominance stems from robust economic growth, developed infrastructure, and strong demand from various end-use sectors. Within the segments, Polyurethane foams dominate the market due to their versatility and superior performance characteristics. However, Polyolefin foams are gaining traction due to their growing adoption for sustainable packaging solutions. In terms of structure, rigid foams hold a larger market share, owing to their usage in industrial packaging and protective applications. Food packaging remains a significant application segment, owing to the crucial need for protecting perishable goods during transportation and storage.
Key Drivers for North American Dominance:
- Strong consumer demand
- Well-developed distribution networks
- Significant investment in manufacturing capacity
Segment Analysis:
- Material: Polyurethane (Market share xx%), Polystyrene (Market share xx%), Polyolefin (Market share xx%), Other (Market share xx%)
- Structure: Rigid (Market share xx%), Flexible (Market share xx%)
- Application: Industrial Packaging (Market share xx%), Food Packaging (Market share xx%)
Packaging Foams Industry Product Developments
Recent product innovations focus on improving insulation properties, enhancing cushioning capabilities, and developing sustainable alternatives. Manufacturers are developing foams with enhanced barrier properties to extend shelf life and reduce food waste. Technological trends emphasize lightweighting and reducing environmental impact. New foams are being designed with superior recyclability and biodegradability. The market fit for these innovative products is strong, driven by increased consumer awareness of environmental issues and the need for efficient and safe packaging solutions.
Key Drivers of Packaging Foams Industry Growth
Several factors are driving growth in the packaging foams industry. Technological advancements, such as the development of lighter, stronger, and more sustainable foams, are boosting demand. The expanding e-commerce sector is fueling increased demand for protective packaging. Favorable economic conditions in key markets and supportive government regulations are also significant drivers. For instance, government regulations regarding food safety are driving demand for high-quality packaging foams.
Challenges in the Packaging Foams Industry Market
The packaging foams industry faces several challenges. Fluctuating raw material prices impact profitability. Stringent environmental regulations pose compliance costs and limit the use of certain materials. Intense competition from both established and emerging players exerts pressure on margins. Supply chain disruptions can lead to production delays and impact market availability. The estimated impact of these challenges on market growth is a reduction of approximately xx% annually.
Emerging Opportunities in Packaging Foams Industry
Several emerging opportunities exist within this market. The increasing demand for sustainable and biodegradable packaging solutions creates vast potential for growth. Strategic partnerships with key players in the food and beverage industry and collaborations with packaging machinery manufacturers can unlock market expansion opportunities. Technological breakthroughs in foam formulations with improved performance characteristics open doors for product diversification. Expansion into developing economies where demand for packaging is rapidly increasing presents lucrative opportunities.
Leading Players in the Packaging Foams Industry Sector
- Recticel
- Drew Foam
- Williams Foam
- Armacell
- TotalEnergies
- Huntington Solutions
- Atlas Roofing Corporation
- Borealis AG
- Zotefoams PLC
- Sealed Air
- Foamcraft Inc
Key Milestones in Packaging Foams Industry Industry
- March 2021: Recticel acquired FoamPartner, strengthening its position in high-value technical foams and expanding its global presence. This merger significantly impacted market consolidation and innovation.
- February 2021: Zotefoams opened a new plant in Brzeg, Poland, increasing its production capacity and enhancing its service capabilities within Europe. This expansion signals strong market confidence and caters to growing regional demand.
Strategic Outlook for Packaging Foams Industry Market
The packaging foams market is poised for continued growth, driven by technological advancements and increasing demand across diverse end-use sectors. Strategic opportunities exist in developing sustainable and recyclable foam solutions. Expanding into emerging markets and forging strategic partnerships will further drive growth. Focus on innovation and meeting stringent environmental regulations will be vital for success in this competitive landscape.
Packaging Foams Industry Segmentation
-
1. Material
- 1.1. Polystyrene
- 1.2. Polyurethane
- 1.3. Polyolefin
- 1.4. Other Materials
-
2. Structure
- 2.1. Flexible
- 2.2. Rigid
-
3. Application
- 3.1. Food Packaging
-
3.2. Industrial Packaging
- 3.2.1. Transportation
- 3.2.2. Electrical and Electronics
- 3.2.3. Personal Care
- 3.2.4. Pharmaceutical
- 3.2.5. Other Industrial Packaging
Packaging Foams Industry Segmentation By Geography
-
1. Asia Pacific
- 1.1. China
- 1.2. India
- 1.3. Japan
- 1.4. South Korea
- 1.5. Rest of Asia Pacific
-
2. North America
- 2.1. United States
- 2.2. Canada
- 2.3. Mexico
-
3. Europe
- 3.1. Germany
- 3.2. United Kingdom
- 3.3. Italy
- 3.4. France
- 3.5. Rest of Europe
-
4. South America
- 4.1. Brazil
- 4.2. Argentina
- 4.3. Rest of South America
- 5. Middle East
-
6. Saudi Arabia
- 6.1. South Africa
- 6.2. Rest of Middle East and Africa
Packaging Foams Industry REPORT HIGHLIGHTS
| Aspects | Details |
|---|---|
| Study Period | 2019-2033 |
| Base Year | 2024 |
| Estimated Year | 2025 |
| Forecast Period | 2025-2033 |
| Historical Period | 2019-2024 |
| Growth Rate | CAGR of 4.68% from 2019-2033 |
| Segmentation |
|
Table of Contents
- 1. Introduction
- 1.1. Research Scope
- 1.2. Market Segmentation
- 1.3. Research Methodology
- 1.4. Definitions and Assumptions
- 2. Executive Summary
- 2.1. Introduction
- 3. Market Dynamics
- 3.1. Introduction
- 3.2. Market Drivers
- 3.2.1. Rising Demand from the Packaging Industry
- 3.3. Market Restrains
- 3.3.1. Molded Pulp as a Green Alternative
- 3.4. Market Trends
- 3.4.1. Increasing Demand from the Industrial Packaging Sector
- 4. Market Factor Analysis
- 4.1. Porters Five Forces
- 4.2. Supply/Value Chain
- 4.3. PESTEL analysis
- 4.4. Market Entropy
- 4.5. Patent/Trademark Analysis
- 5. Global Packaging Foams Industry Analysis, Insights and Forecast, 2019-2031
- 5.1. Market Analysis, Insights and Forecast - by Material
- 5.1.1. Polystyrene
- 5.1.2. Polyurethane
- 5.1.3. Polyolefin
- 5.1.4. Other Materials
- 5.2. Market Analysis, Insights and Forecast - by Structure
- 5.2.1. Flexible
- 5.2.2. Rigid
- 5.3. Market Analysis, Insights and Forecast - by Application
- 5.3.1. Food Packaging
- 5.3.2. Industrial Packaging
- 5.3.2.1. Transportation
- 5.3.2.2. Electrical and Electronics
- 5.3.2.3. Personal Care
- 5.3.2.4. Pharmaceutical
- 5.3.2.5. Other Industrial Packaging
- 5.4. Market Analysis, Insights and Forecast - by Region
- 5.4.1. Asia Pacific
- 5.4.2. North America
- 5.4.3. Europe
- 5.4.4. South America
- 5.4.5. Middle East
- 5.4.6. Saudi Arabia
- 5.1. Market Analysis, Insights and Forecast - by Material
- 6. Asia Pacific Packaging Foams Industry Analysis, Insights and Forecast, 2019-2031
- 6.1. Market Analysis, Insights and Forecast - by Material
- 6.1.1. Polystyrene
- 6.1.2. Polyurethane
- 6.1.3. Polyolefin
- 6.1.4. Other Materials
- 6.2. Market Analysis, Insights and Forecast - by Structure
- 6.2.1. Flexible
- 6.2.2. Rigid
- 6.3. Market Analysis, Insights and Forecast - by Application
- 6.3.1. Food Packaging
- 6.3.2. Industrial Packaging
- 6.3.2.1. Transportation
- 6.3.2.2. Electrical and Electronics
- 6.3.2.3. Personal Care
- 6.3.2.4. Pharmaceutical
- 6.3.2.5. Other Industrial Packaging
- 6.1. Market Analysis, Insights and Forecast - by Material
- 7. North America Packaging Foams Industry Analysis, Insights and Forecast, 2019-2031
- 7.1. Market Analysis, Insights and Forecast - by Material
- 7.1.1. Polystyrene
- 7.1.2. Polyurethane
- 7.1.3. Polyolefin
- 7.1.4. Other Materials
- 7.2. Market Analysis, Insights and Forecast - by Structure
- 7.2.1. Flexible
- 7.2.2. Rigid
- 7.3. Market Analysis, Insights and Forecast - by Application
- 7.3.1. Food Packaging
- 7.3.2. Industrial Packaging
- 7.3.2.1. Transportation
- 7.3.2.2. Electrical and Electronics
- 7.3.2.3. Personal Care
- 7.3.2.4. Pharmaceutical
- 7.3.2.5. Other Industrial Packaging
- 7.1. Market Analysis, Insights and Forecast - by Material
- 8. Europe Packaging Foams Industry Analysis, Insights and Forecast, 2019-2031
- 8.1. Market Analysis, Insights and Forecast - by Material
- 8.1.1. Polystyrene
- 8.1.2. Polyurethane
- 8.1.3. Polyolefin
- 8.1.4. Other Materials
- 8.2. Market Analysis, Insights and Forecast - by Structure
- 8.2.1. Flexible
- 8.2.2. Rigid
- 8.3. Market Analysis, Insights and Forecast - by Application
- 8.3.1. Food Packaging
- 8.3.2. Industrial Packaging
- 8.3.2.1. Transportation
- 8.3.2.2. Electrical and Electronics
- 8.3.2.3. Personal Care
- 8.3.2.4. Pharmaceutical
- 8.3.2.5. Other Industrial Packaging
- 8.1. Market Analysis, Insights and Forecast - by Material
- 9. South America Packaging Foams Industry Analysis, Insights and Forecast, 2019-2031
- 9.1. Market Analysis, Insights and Forecast - by Material
- 9.1.1. Polystyrene
- 9.1.2. Polyurethane
- 9.1.3. Polyolefin
- 9.1.4. Other Materials
- 9.2. Market Analysis, Insights and Forecast - by Structure
- 9.2.1. Flexible
- 9.2.2. Rigid
- 9.3. Market Analysis, Insights and Forecast - by Application
- 9.3.1. Food Packaging
- 9.3.2. Industrial Packaging
- 9.3.2.1. Transportation
- 9.3.2.2. Electrical and Electronics
- 9.3.2.3. Personal Care
- 9.3.2.4. Pharmaceutical
- 9.3.2.5. Other Industrial Packaging
- 9.1. Market Analysis, Insights and Forecast - by Material
- 10. Middle East Packaging Foams Industry Analysis, Insights and Forecast, 2019-2031
- 10.1. Market Analysis, Insights and Forecast - by Material
- 10.1.1. Polystyrene
- 10.1.2. Polyurethane
- 10.1.3. Polyolefin
- 10.1.4. Other Materials
- 10.2. Market Analysis, Insights and Forecast - by Structure
- 10.2.1. Flexible
- 10.2.2. Rigid
- 10.3. Market Analysis, Insights and Forecast - by Application
- 10.3.1. Food Packaging
- 10.3.2. Industrial Packaging
- 10.3.2.1. Transportation
- 10.3.2.2. Electrical and Electronics
- 10.3.2.3. Personal Care
- 10.3.2.4. Pharmaceutical
- 10.3.2.5. Other Industrial Packaging
- 10.1. Market Analysis, Insights and Forecast - by Material
- 11. Saudi Arabia Packaging Foams Industry Analysis, Insights and Forecast, 2019-2031
- 11.1. Market Analysis, Insights and Forecast - by Material
- 11.1.1. Polystyrene
- 11.1.2. Polyurethane
- 11.1.3. Polyolefin
- 11.1.4. Other Materials
- 11.2. Market Analysis, Insights and Forecast - by Structure
- 11.2.1. Flexible
- 11.2.2. Rigid
- 11.3. Market Analysis, Insights and Forecast - by Application
- 11.3.1. Food Packaging
- 11.3.2. Industrial Packaging
- 11.3.2.1. Transportation
- 11.3.2.2. Electrical and Electronics
- 11.3.2.3. Personal Care
- 11.3.2.4. Pharmaceutical
- 11.3.2.5. Other Industrial Packaging
- 11.1. Market Analysis, Insights and Forecast - by Material
- 12. North America Packaging Foams Industry Analysis, Insights and Forecast, 2019-2031
- 12.1. Market Analysis, Insights and Forecast - By Country/Sub-region
- 12.1.1 United States
- 12.1.2 Canada
- 12.1.3 Mexico
- 13. Europe Packaging Foams Industry Analysis, Insights and Forecast, 2019-2031
- 13.1. Market Analysis, Insights and Forecast - By Country/Sub-region
- 13.1.1 Germany
- 13.1.2 France
- 13.1.3 Italy
- 13.1.4 United Kingdom
- 13.1.5 Netherlands
- 13.1.6 Rest of Europe
- 14. Asia Pacific Packaging Foams Industry Analysis, Insights and Forecast, 2019-2031
- 14.1. Market Analysis, Insights and Forecast - By Country/Sub-region
- 14.1.1 China
- 14.1.2 Japan
- 14.1.3 India
- 14.1.4 South Korea
- 14.1.5 Taiwan
- 14.1.6 Australia
- 14.1.7 Rest of Asia-Pacific
- 15. South America Packaging Foams Industry Analysis, Insights and Forecast, 2019-2031
- 15.1. Market Analysis, Insights and Forecast - By Country/Sub-region
- 15.1.1 Brazil
- 15.1.2 Argentina
- 15.1.3 Rest of South America
- 16. MEA Packaging Foams Industry Analysis, Insights and Forecast, 2019-2031
- 16.1. Market Analysis, Insights and Forecast - By Country/Sub-region
- 16.1.1 Middle East
- 16.1.2 Africa
- 17. Competitive Analysis
- 17.1. Global Market Share Analysis 2024
- 17.2. Company Profiles
- 17.2.1 Recticel
- 17.2.1.1. Overview
- 17.2.1.2. Products
- 17.2.1.3. SWOT Analysis
- 17.2.1.4. Recent Developments
- 17.2.1.5. Financials (Based on Availability)
- 17.2.2 Drew Foam
- 17.2.2.1. Overview
- 17.2.2.2. Products
- 17.2.2.3. SWOT Analysis
- 17.2.2.4. Recent Developments
- 17.2.2.5. Financials (Based on Availability)
- 17.2.3 Williams Foam
- 17.2.3.1. Overview
- 17.2.3.2. Products
- 17.2.3.3. SWOT Analysis
- 17.2.3.4. Recent Developments
- 17.2.3.5. Financials (Based on Availability)
- 17.2.4 Armacell
- 17.2.4.1. Overview
- 17.2.4.2. Products
- 17.2.4.3. SWOT Analysis
- 17.2.4.4. Recent Developments
- 17.2.4.5. Financials (Based on Availability)
- 17.2.5 TotalEnergies
- 17.2.5.1. Overview
- 17.2.5.2. Products
- 17.2.5.3. SWOT Analysis
- 17.2.5.4. Recent Developments
- 17.2.5.5. Financials (Based on Availability)
- 17.2.6 Huntington Solutions
- 17.2.6.1. Overview
- 17.2.6.2. Products
- 17.2.6.3. SWOT Analysis
- 17.2.6.4. Recent Developments
- 17.2.6.5. Financials (Based on Availability)
- 17.2.7 Atlas Roofing Corporation
- 17.2.7.1. Overview
- 17.2.7.2. Products
- 17.2.7.3. SWOT Analysis
- 17.2.7.4. Recent Developments
- 17.2.7.5. Financials (Based on Availability)
- 17.2.8 Borealis AG
- 17.2.8.1. Overview
- 17.2.8.2. Products
- 17.2.8.3. SWOT Analysis
- 17.2.8.4. Recent Developments
- 17.2.8.5. Financials (Based on Availability)
- 17.2.9 Zotefoams PLC
- 17.2.9.1. Overview
- 17.2.9.2. Products
- 17.2.9.3. SWOT Analysis
- 17.2.9.4. Recent Developments
- 17.2.9.5. Financials (Based on Availability)
- 17.2.10 Sealed Air
- 17.2.10.1. Overview
- 17.2.10.2. Products
- 17.2.10.3. SWOT Analysis
- 17.2.10.4. Recent Developments
- 17.2.10.5. Financials (Based on Availability)
- 17.2.11 Foamcraft Inc
- 17.2.11.1. Overview
- 17.2.11.2. Products
- 17.2.11.3. SWOT Analysis
- 17.2.11.4. Recent Developments
- 17.2.11.5. Financials (Based on Availability)
- 17.2.1 Recticel
List of Figures
- Figure 1: Global Packaging Foams Industry Revenue Breakdown (Million, %) by Region 2024 & 2032
- Figure 2: Global Packaging Foams Industry Volume Breakdown (K Tons, %) by Region 2024 & 2032
- Figure 3: North America Packaging Foams Industry Revenue (Million), by Country 2024 & 2032
- Figure 4: North America Packaging Foams Industry Volume (K Tons), by Country 2024 & 2032
- Figure 5: North America Packaging Foams Industry Revenue Share (%), by Country 2024 & 2032
- Figure 6: North America Packaging Foams Industry Volume Share (%), by Country 2024 & 2032
- Figure 7: Europe Packaging Foams Industry Revenue (Million), by Country 2024 & 2032
- Figure 8: Europe Packaging Foams Industry Volume (K Tons), by Country 2024 & 2032
- Figure 9: Europe Packaging Foams Industry Revenue Share (%), by Country 2024 & 2032
- Figure 10: Europe Packaging Foams Industry Volume Share (%), by Country 2024 & 2032
- Figure 11: Asia Pacific Packaging Foams Industry Revenue (Million), by Country 2024 & 2032
- Figure 12: Asia Pacific Packaging Foams Industry Volume (K Tons), by Country 2024 & 2032
- Figure 13: Asia Pacific Packaging Foams Industry Revenue Share (%), by Country 2024 & 2032
- Figure 14: Asia Pacific Packaging Foams Industry Volume Share (%), by Country 2024 & 2032
- Figure 15: South America Packaging Foams Industry Revenue (Million), by Country 2024 & 2032
- Figure 16: South America Packaging Foams Industry Volume (K Tons), by Country 2024 & 2032
- Figure 17: South America Packaging Foams Industry Revenue Share (%), by Country 2024 & 2032
- Figure 18: South America Packaging Foams Industry Volume Share (%), by Country 2024 & 2032
- Figure 19: MEA Packaging Foams Industry Revenue (Million), by Country 2024 & 2032
- Figure 20: MEA Packaging Foams Industry Volume (K Tons), by Country 2024 & 2032
- Figure 21: MEA Packaging Foams Industry Revenue Share (%), by Country 2024 & 2032
- Figure 22: MEA Packaging Foams Industry Volume Share (%), by Country 2024 & 2032
- Figure 23: Asia Pacific Packaging Foams Industry Revenue (Million), by Material 2024 & 2032
- Figure 24: Asia Pacific Packaging Foams Industry Volume (K Tons), by Material 2024 & 2032
- Figure 25: Asia Pacific Packaging Foams Industry Revenue Share (%), by Material 2024 & 2032
- Figure 26: Asia Pacific Packaging Foams Industry Volume Share (%), by Material 2024 & 2032
- Figure 27: Asia Pacific Packaging Foams Industry Revenue (Million), by Structure 2024 & 2032
- Figure 28: Asia Pacific Packaging Foams Industry Volume (K Tons), by Structure 2024 & 2032
- Figure 29: Asia Pacific Packaging Foams Industry Revenue Share (%), by Structure 2024 & 2032
- Figure 30: Asia Pacific Packaging Foams Industry Volume Share (%), by Structure 2024 & 2032
- Figure 31: Asia Pacific Packaging Foams Industry Revenue (Million), by Application 2024 & 2032
- Figure 32: Asia Pacific Packaging Foams Industry Volume (K Tons), by Application 2024 & 2032
- Figure 33: Asia Pacific Packaging Foams Industry Revenue Share (%), by Application 2024 & 2032
- Figure 34: Asia Pacific Packaging Foams Industry Volume Share (%), by Application 2024 & 2032
- Figure 35: Asia Pacific Packaging Foams Industry Revenue (Million), by Country 2024 & 2032
- Figure 36: Asia Pacific Packaging Foams Industry Volume (K Tons), by Country 2024 & 2032
- Figure 37: Asia Pacific Packaging Foams Industry Revenue Share (%), by Country 2024 & 2032
- Figure 38: Asia Pacific Packaging Foams Industry Volume Share (%), by Country 2024 & 2032
- Figure 39: North America Packaging Foams Industry Revenue (Million), by Material 2024 & 2032
- Figure 40: North America Packaging Foams Industry Volume (K Tons), by Material 2024 & 2032
- Figure 41: North America Packaging Foams Industry Revenue Share (%), by Material 2024 & 2032
- Figure 42: North America Packaging Foams Industry Volume Share (%), by Material 2024 & 2032
- Figure 43: North America Packaging Foams Industry Revenue (Million), by Structure 2024 & 2032
- Figure 44: North America Packaging Foams Industry Volume (K Tons), by Structure 2024 & 2032
- Figure 45: North America Packaging Foams Industry Revenue Share (%), by Structure 2024 & 2032
- Figure 46: North America Packaging Foams Industry Volume Share (%), by Structure 2024 & 2032
- Figure 47: North America Packaging Foams Industry Revenue (Million), by Application 2024 & 2032
- Figure 48: North America Packaging Foams Industry Volume (K Tons), by Application 2024 & 2032
- Figure 49: North America Packaging Foams Industry Revenue Share (%), by Application 2024 & 2032
- Figure 50: North America Packaging Foams Industry Volume Share (%), by Application 2024 & 2032
- Figure 51: North America Packaging Foams Industry Revenue (Million), by Country 2024 & 2032
- Figure 52: North America Packaging Foams Industry Volume (K Tons), by Country 2024 & 2032
- Figure 53: North America Packaging Foams Industry Revenue Share (%), by Country 2024 & 2032
- Figure 54: North America Packaging Foams Industry Volume Share (%), by Country 2024 & 2032
- Figure 55: Europe Packaging Foams Industry Revenue (Million), by Material 2024 & 2032
- Figure 56: Europe Packaging Foams Industry Volume (K Tons), by Material 2024 & 2032
- Figure 57: Europe Packaging Foams Industry Revenue Share (%), by Material 2024 & 2032
- Figure 58: Europe Packaging Foams Industry Volume Share (%), by Material 2024 & 2032
- Figure 59: Europe Packaging Foams Industry Revenue (Million), by Structure 2024 & 2032
- Figure 60: Europe Packaging Foams Industry Volume (K Tons), by Structure 2024 & 2032
- Figure 61: Europe Packaging Foams Industry Revenue Share (%), by Structure 2024 & 2032
- Figure 62: Europe Packaging Foams Industry Volume Share (%), by Structure 2024 & 2032
- Figure 63: Europe Packaging Foams Industry Revenue (Million), by Application 2024 & 2032
- Figure 64: Europe Packaging Foams Industry Volume (K Tons), by Application 2024 & 2032
- Figure 65: Europe Packaging Foams Industry Revenue Share (%), by Application 2024 & 2032
- Figure 66: Europe Packaging Foams Industry Volume Share (%), by Application 2024 & 2032
- Figure 67: Europe Packaging Foams Industry Revenue (Million), by Country 2024 & 2032
- Figure 68: Europe Packaging Foams Industry Volume (K Tons), by Country 2024 & 2032
- Figure 69: Europe Packaging Foams Industry Revenue Share (%), by Country 2024 & 2032
- Figure 70: Europe Packaging Foams Industry Volume Share (%), by Country 2024 & 2032
- Figure 71: South America Packaging Foams Industry Revenue (Million), by Material 2024 & 2032
- Figure 72: South America Packaging Foams Industry Volume (K Tons), by Material 2024 & 2032
- Figure 73: South America Packaging Foams Industry Revenue Share (%), by Material 2024 & 2032
- Figure 74: South America Packaging Foams Industry Volume Share (%), by Material 2024 & 2032
- Figure 75: South America Packaging Foams Industry Revenue (Million), by Structure 2024 & 2032
- Figure 76: South America Packaging Foams Industry Volume (K Tons), by Structure 2024 & 2032
- Figure 77: South America Packaging Foams Industry Revenue Share (%), by Structure 2024 & 2032
- Figure 78: South America Packaging Foams Industry Volume Share (%), by Structure 2024 & 2032
- Figure 79: South America Packaging Foams Industry Revenue (Million), by Application 2024 & 2032
- Figure 80: South America Packaging Foams Industry Volume (K Tons), by Application 2024 & 2032
- Figure 81: South America Packaging Foams Industry Revenue Share (%), by Application 2024 & 2032
- Figure 82: South America Packaging Foams Industry Volume Share (%), by Application 2024 & 2032
- Figure 83: South America Packaging Foams Industry Revenue (Million), by Country 2024 & 2032
- Figure 84: South America Packaging Foams Industry Volume (K Tons), by Country 2024 & 2032
- Figure 85: South America Packaging Foams Industry Revenue Share (%), by Country 2024 & 2032
- Figure 86: South America Packaging Foams Industry Volume Share (%), by Country 2024 & 2032
- Figure 87: Middle East Packaging Foams Industry Revenue (Million), by Material 2024 & 2032
- Figure 88: Middle East Packaging Foams Industry Volume (K Tons), by Material 2024 & 2032
- Figure 89: Middle East Packaging Foams Industry Revenue Share (%), by Material 2024 & 2032
- Figure 90: Middle East Packaging Foams Industry Volume Share (%), by Material 2024 & 2032
- Figure 91: Middle East Packaging Foams Industry Revenue (Million), by Structure 2024 & 2032
- Figure 92: Middle East Packaging Foams Industry Volume (K Tons), by Structure 2024 & 2032
- Figure 93: Middle East Packaging Foams Industry Revenue Share (%), by Structure 2024 & 2032
- Figure 94: Middle East Packaging Foams Industry Volume Share (%), by Structure 2024 & 2032
- Figure 95: Middle East Packaging Foams Industry Revenue (Million), by Application 2024 & 2032
- Figure 96: Middle East Packaging Foams Industry Volume (K Tons), by Application 2024 & 2032
- Figure 97: Middle East Packaging Foams Industry Revenue Share (%), by Application 2024 & 2032
- Figure 98: Middle East Packaging Foams Industry Volume Share (%), by Application 2024 & 2032
- Figure 99: Middle East Packaging Foams Industry Revenue (Million), by Country 2024 & 2032
- Figure 100: Middle East Packaging Foams Industry Volume (K Tons), by Country 2024 & 2032
- Figure 101: Middle East Packaging Foams Industry Revenue Share (%), by Country 2024 & 2032
- Figure 102: Middle East Packaging Foams Industry Volume Share (%), by Country 2024 & 2032
- Figure 103: Saudi Arabia Packaging Foams Industry Revenue (Million), by Material 2024 & 2032
- Figure 104: Saudi Arabia Packaging Foams Industry Volume (K Tons), by Material 2024 & 2032
- Figure 105: Saudi Arabia Packaging Foams Industry Revenue Share (%), by Material 2024 & 2032
- Figure 106: Saudi Arabia Packaging Foams Industry Volume Share (%), by Material 2024 & 2032
- Figure 107: Saudi Arabia Packaging Foams Industry Revenue (Million), by Structure 2024 & 2032
- Figure 108: Saudi Arabia Packaging Foams Industry Volume (K Tons), by Structure 2024 & 2032
- Figure 109: Saudi Arabia Packaging Foams Industry Revenue Share (%), by Structure 2024 & 2032
- Figure 110: Saudi Arabia Packaging Foams Industry Volume Share (%), by Structure 2024 & 2032
- Figure 111: Saudi Arabia Packaging Foams Industry Revenue (Million), by Application 2024 & 2032
- Figure 112: Saudi Arabia Packaging Foams Industry Volume (K Tons), by Application 2024 & 2032
- Figure 113: Saudi Arabia Packaging Foams Industry Revenue Share (%), by Application 2024 & 2032
- Figure 114: Saudi Arabia Packaging Foams Industry Volume Share (%), by Application 2024 & 2032
- Figure 115: Saudi Arabia Packaging Foams Industry Revenue (Million), by Country 2024 & 2032
- Figure 116: Saudi Arabia Packaging Foams Industry Volume (K Tons), by Country 2024 & 2032
- Figure 117: Saudi Arabia Packaging Foams Industry Revenue Share (%), by Country 2024 & 2032
- Figure 118: Saudi Arabia Packaging Foams Industry Volume Share (%), by Country 2024 & 2032
List of Tables
- Table 1: Global Packaging Foams Industry Revenue Million Forecast, by Region 2019 & 2032
- Table 2: Global Packaging Foams Industry Volume K Tons Forecast, by Region 2019 & 2032
- Table 3: Global Packaging Foams Industry Revenue Million Forecast, by Material 2019 & 2032
- Table 4: Global Packaging Foams Industry Volume K Tons Forecast, by Material 2019 & 2032
- Table 5: Global Packaging Foams Industry Revenue Million Forecast, by Structure 2019 & 2032
- Table 6: Global Packaging Foams Industry Volume K Tons Forecast, by Structure 2019 & 2032
- Table 7: Global Packaging Foams Industry Revenue Million Forecast, by Application 2019 & 2032
- Table 8: Global Packaging Foams Industry Volume K Tons Forecast, by Application 2019 & 2032
- Table 9: Global Packaging Foams Industry Revenue Million Forecast, by Region 2019 & 2032
- Table 10: Global Packaging Foams Industry Volume K Tons Forecast, by Region 2019 & 2032
- Table 11: Global Packaging Foams Industry Revenue Million Forecast, by Country 2019 & 2032
- Table 12: Global Packaging Foams Industry Volume K Tons Forecast, by Country 2019 & 2032
- Table 13: United States Packaging Foams Industry Revenue (Million) Forecast, by Application 2019 & 2032
- Table 14: United States Packaging Foams Industry Volume (K Tons) Forecast, by Application 2019 & 2032
- Table 15: Canada Packaging Foams Industry Revenue (Million) Forecast, by Application 2019 & 2032
- Table 16: Canada Packaging Foams Industry Volume (K Tons) Forecast, by Application 2019 & 2032
- Table 17: Mexico Packaging Foams Industry Revenue (Million) Forecast, by Application 2019 & 2032
- Table 18: Mexico Packaging Foams Industry Volume (K Tons) Forecast, by Application 2019 & 2032
- Table 19: Global Packaging Foams Industry Revenue Million Forecast, by Country 2019 & 2032
- Table 20: Global Packaging Foams Industry Volume K Tons Forecast, by Country 2019 & 2032
- Table 21: Germany Packaging Foams Industry Revenue (Million) Forecast, by Application 2019 & 2032
- Table 22: Germany Packaging Foams Industry Volume (K Tons) Forecast, by Application 2019 & 2032
- Table 23: France Packaging Foams Industry Revenue (Million) Forecast, by Application 2019 & 2032
- Table 24: France Packaging Foams Industry Volume (K Tons) Forecast, by Application 2019 & 2032
- Table 25: Italy Packaging Foams Industry Revenue (Million) Forecast, by Application 2019 & 2032
- Table 26: Italy Packaging Foams Industry Volume (K Tons) Forecast, by Application 2019 & 2032
- Table 27: United Kingdom Packaging Foams Industry Revenue (Million) Forecast, by Application 2019 & 2032
- Table 28: United Kingdom Packaging Foams Industry Volume (K Tons) Forecast, by Application 2019 & 2032
- Table 29: Netherlands Packaging Foams Industry Revenue (Million) Forecast, by Application 2019 & 2032
- Table 30: Netherlands Packaging Foams Industry Volume (K Tons) Forecast, by Application 2019 & 2032
- Table 31: Rest of Europe Packaging Foams Industry Revenue (Million) Forecast, by Application 2019 & 2032
- Table 32: Rest of Europe Packaging Foams Industry Volume (K Tons) Forecast, by Application 2019 & 2032
- Table 33: Global Packaging Foams Industry Revenue Million Forecast, by Country 2019 & 2032
- Table 34: Global Packaging Foams Industry Volume K Tons Forecast, by Country 2019 & 2032
- Table 35: China Packaging Foams Industry Revenue (Million) Forecast, by Application 2019 & 2032
- Table 36: China Packaging Foams Industry Volume (K Tons) Forecast, by Application 2019 & 2032
- Table 37: Japan Packaging Foams Industry Revenue (Million) Forecast, by Application 2019 & 2032
- Table 38: Japan Packaging Foams Industry Volume (K Tons) Forecast, by Application 2019 & 2032
- Table 39: India Packaging Foams Industry Revenue (Million) Forecast, by Application 2019 & 2032
- Table 40: India Packaging Foams Industry Volume (K Tons) Forecast, by Application 2019 & 2032
- Table 41: South Korea Packaging Foams Industry Revenue (Million) Forecast, by Application 2019 & 2032
- Table 42: South Korea Packaging Foams Industry Volume (K Tons) Forecast, by Application 2019 & 2032
- Table 43: Taiwan Packaging Foams Industry Revenue (Million) Forecast, by Application 2019 & 2032
- Table 44: Taiwan Packaging Foams Industry Volume (K Tons) Forecast, by Application 2019 & 2032
- Table 45: Australia Packaging Foams Industry Revenue (Million) Forecast, by Application 2019 & 2032
- Table 46: Australia Packaging Foams Industry Volume (K Tons) Forecast, by Application 2019 & 2032
- Table 47: Rest of Asia-Pacific Packaging Foams Industry Revenue (Million) Forecast, by Application 2019 & 2032
- Table 48: Rest of Asia-Pacific Packaging Foams Industry Volume (K Tons) Forecast, by Application 2019 & 2032
- Table 49: Global Packaging Foams Industry Revenue Million Forecast, by Country 2019 & 2032
- Table 50: Global Packaging Foams Industry Volume K Tons Forecast, by Country 2019 & 2032
- Table 51: Brazil Packaging Foams Industry Revenue (Million) Forecast, by Application 2019 & 2032
- Table 52: Brazil Packaging Foams Industry Volume (K Tons) Forecast, by Application 2019 & 2032
- Table 53: Argentina Packaging Foams Industry Revenue (Million) Forecast, by Application 2019 & 2032
- Table 54: Argentina Packaging Foams Industry Volume (K Tons) Forecast, by Application 2019 & 2032
- Table 55: Rest of South America Packaging Foams Industry Revenue (Million) Forecast, by Application 2019 & 2032
- Table 56: Rest of South America Packaging Foams Industry Volume (K Tons) Forecast, by Application 2019 & 2032
- Table 57: Global Packaging Foams Industry Revenue Million Forecast, by Country 2019 & 2032
- Table 58: Global Packaging Foams Industry Volume K Tons Forecast, by Country 2019 & 2032
- Table 59: Middle East Packaging Foams Industry Revenue (Million) Forecast, by Application 2019 & 2032
- Table 60: Middle East Packaging Foams Industry Volume (K Tons) Forecast, by Application 2019 & 2032
- Table 61: Africa Packaging Foams Industry Revenue (Million) Forecast, by Application 2019 & 2032
- Table 62: Africa Packaging Foams Industry Volume (K Tons) Forecast, by Application 2019 & 2032
- Table 63: Global Packaging Foams Industry Revenue Million Forecast, by Material 2019 & 2032
- Table 64: Global Packaging Foams Industry Volume K Tons Forecast, by Material 2019 & 2032
- Table 65: Global Packaging Foams Industry Revenue Million Forecast, by Structure 2019 & 2032
- Table 66: Global Packaging Foams Industry Volume K Tons Forecast, by Structure 2019 & 2032
- Table 67: Global Packaging Foams Industry Revenue Million Forecast, by Application 2019 & 2032
- Table 68: Global Packaging Foams Industry Volume K Tons Forecast, by Application 2019 & 2032
- Table 69: Global Packaging Foams Industry Revenue Million Forecast, by Country 2019 & 2032
- Table 70: Global Packaging Foams Industry Volume K Tons Forecast, by Country 2019 & 2032
- Table 71: China Packaging Foams Industry Revenue (Million) Forecast, by Application 2019 & 2032
- Table 72: China Packaging Foams Industry Volume (K Tons) Forecast, by Application 2019 & 2032
- Table 73: India Packaging Foams Industry Revenue (Million) Forecast, by Application 2019 & 2032
- Table 74: India Packaging Foams Industry Volume (K Tons) Forecast, by Application 2019 & 2032
- Table 75: Japan Packaging Foams Industry Revenue (Million) Forecast, by Application 2019 & 2032
- Table 76: Japan Packaging Foams Industry Volume (K Tons) Forecast, by Application 2019 & 2032
- Table 77: South Korea Packaging Foams Industry Revenue (Million) Forecast, by Application 2019 & 2032
- Table 78: South Korea Packaging Foams Industry Volume (K Tons) Forecast, by Application 2019 & 2032
- Table 79: Rest of Asia Pacific Packaging Foams Industry Revenue (Million) Forecast, by Application 2019 & 2032
- Table 80: Rest of Asia Pacific Packaging Foams Industry Volume (K Tons) Forecast, by Application 2019 & 2032
- Table 81: Global Packaging Foams Industry Revenue Million Forecast, by Material 2019 & 2032
- Table 82: Global Packaging Foams Industry Volume K Tons Forecast, by Material 2019 & 2032
- Table 83: Global Packaging Foams Industry Revenue Million Forecast, by Structure 2019 & 2032
- Table 84: Global Packaging Foams Industry Volume K Tons Forecast, by Structure 2019 & 2032
- Table 85: Global Packaging Foams Industry Revenue Million Forecast, by Application 2019 & 2032
- Table 86: Global Packaging Foams Industry Volume K Tons Forecast, by Application 2019 & 2032
- Table 87: Global Packaging Foams Industry Revenue Million Forecast, by Country 2019 & 2032
- Table 88: Global Packaging Foams Industry Volume K Tons Forecast, by Country 2019 & 2032
- Table 89: United States Packaging Foams Industry Revenue (Million) Forecast, by Application 2019 & 2032
- Table 90: United States Packaging Foams Industry Volume (K Tons) Forecast, by Application 2019 & 2032
- Table 91: Canada Packaging Foams Industry Revenue (Million) Forecast, by Application 2019 & 2032
- Table 92: Canada Packaging Foams Industry Volume (K Tons) Forecast, by Application 2019 & 2032
- Table 93: Mexico Packaging Foams Industry Revenue (Million) Forecast, by Application 2019 & 2032
- Table 94: Mexico Packaging Foams Industry Volume (K Tons) Forecast, by Application 2019 & 2032
- Table 95: Global Packaging Foams Industry Revenue Million Forecast, by Material 2019 & 2032
- Table 96: Global Packaging Foams Industry Volume K Tons Forecast, by Material 2019 & 2032
- Table 97: Global Packaging Foams Industry Revenue Million Forecast, by Structure 2019 & 2032
- Table 98: Global Packaging Foams Industry Volume K Tons Forecast, by Structure 2019 & 2032
- Table 99: Global Packaging Foams Industry Revenue Million Forecast, by Application 2019 & 2032
- Table 100: Global Packaging Foams Industry Volume K Tons Forecast, by Application 2019 & 2032
- Table 101: Global Packaging Foams Industry Revenue Million Forecast, by Country 2019 & 2032
- Table 102: Global Packaging Foams Industry Volume K Tons Forecast, by Country 2019 & 2032
- Table 103: Germany Packaging Foams Industry Revenue (Million) Forecast, by Application 2019 & 2032
- Table 104: Germany Packaging Foams Industry Volume (K Tons) Forecast, by Application 2019 & 2032
- Table 105: United Kingdom Packaging Foams Industry Revenue (Million) Forecast, by Application 2019 & 2032
- Table 106: United Kingdom Packaging Foams Industry Volume (K Tons) Forecast, by Application 2019 & 2032
- Table 107: Italy Packaging Foams Industry Revenue (Million) Forecast, by Application 2019 & 2032
- Table 108: Italy Packaging Foams Industry Volume (K Tons) Forecast, by Application 2019 & 2032
- Table 109: France Packaging Foams Industry Revenue (Million) Forecast, by Application 2019 & 2032
- Table 110: France Packaging Foams Industry Volume (K Tons) Forecast, by Application 2019 & 2032
- Table 111: Rest of Europe Packaging Foams Industry Revenue (Million) Forecast, by Application 2019 & 2032
- Table 112: Rest of Europe Packaging Foams Industry Volume (K Tons) Forecast, by Application 2019 & 2032
- Table 113: Global Packaging Foams Industry Revenue Million Forecast, by Material 2019 & 2032
- Table 114: Global Packaging Foams Industry Volume K Tons Forecast, by Material 2019 & 2032
- Table 115: Global Packaging Foams Industry Revenue Million Forecast, by Structure 2019 & 2032
- Table 116: Global Packaging Foams Industry Volume K Tons Forecast, by Structure 2019 & 2032
- Table 117: Global Packaging Foams Industry Revenue Million Forecast, by Application 2019 & 2032
- Table 118: Global Packaging Foams Industry Volume K Tons Forecast, by Application 2019 & 2032
- Table 119: Global Packaging Foams Industry Revenue Million Forecast, by Country 2019 & 2032
- Table 120: Global Packaging Foams Industry Volume K Tons Forecast, by Country 2019 & 2032
- Table 121: Brazil Packaging Foams Industry Revenue (Million) Forecast, by Application 2019 & 2032
- Table 122: Brazil Packaging Foams Industry Volume (K Tons) Forecast, by Application 2019 & 2032
- Table 123: Argentina Packaging Foams Industry Revenue (Million) Forecast, by Application 2019 & 2032
- Table 124: Argentina Packaging Foams Industry Volume (K Tons) Forecast, by Application 2019 & 2032
- Table 125: Rest of South America Packaging Foams Industry Revenue (Million) Forecast, by Application 2019 & 2032
- Table 126: Rest of South America Packaging Foams Industry Volume (K Tons) Forecast, by Application 2019 & 2032
- Table 127: Global Packaging Foams Industry Revenue Million Forecast, by Material 2019 & 2032
- Table 128: Global Packaging Foams Industry Volume K Tons Forecast, by Material 2019 & 2032
- Table 129: Global Packaging Foams Industry Revenue Million Forecast, by Structure 2019 & 2032
- Table 130: Global Packaging Foams Industry Volume K Tons Forecast, by Structure 2019 & 2032
- Table 131: Global Packaging Foams Industry Revenue Million Forecast, by Application 2019 & 2032
- Table 132: Global Packaging Foams Industry Volume K Tons Forecast, by Application 2019 & 2032
- Table 133: Global Packaging Foams Industry Revenue Million Forecast, by Country 2019 & 2032
- Table 134: Global Packaging Foams Industry Volume K Tons Forecast, by Country 2019 & 2032
- Table 135: Global Packaging Foams Industry Revenue Million Forecast, by Material 2019 & 2032
- Table 136: Global Packaging Foams Industry Volume K Tons Forecast, by Material 2019 & 2032
- Table 137: Global Packaging Foams Industry Revenue Million Forecast, by Structure 2019 & 2032
- Table 138: Global Packaging Foams Industry Volume K Tons Forecast, by Structure 2019 & 2032
- Table 139: Global Packaging Foams Industry Revenue Million Forecast, by Application 2019 & 2032
- Table 140: Global Packaging Foams Industry Volume K Tons Forecast, by Application 2019 & 2032
- Table 141: Global Packaging Foams Industry Revenue Million Forecast, by Country 2019 & 2032
- Table 142: Global Packaging Foams Industry Volume K Tons Forecast, by Country 2019 & 2032
- Table 143: South Africa Packaging Foams Industry Revenue (Million) Forecast, by Application 2019 & 2032
- Table 144: South Africa Packaging Foams Industry Volume (K Tons) Forecast, by Application 2019 & 2032
- Table 145: Rest of Middle East and Africa Packaging Foams Industry Revenue (Million) Forecast, by Application 2019 & 2032
- Table 146: Rest of Middle East and Africa Packaging Foams Industry Volume (K Tons) Forecast, by Application 2019 & 2032
Frequently Asked Questions
1. What is the projected Compound Annual Growth Rate (CAGR) of the Packaging Foams Industry?
The projected CAGR is approximately 4.68%.
2. Which companies are prominent players in the Packaging Foams Industry?
Key companies in the market include Recticel, Drew Foam, Williams Foam, Armacell, TotalEnergies, Huntington Solutions, Atlas Roofing Corporation, Borealis AG, Zotefoams PLC, Sealed Air, Foamcraft Inc.
3. What are the main segments of the Packaging Foams Industry?
The market segments include Material, Structure, Application.
4. Can you provide details about the market size?
The market size is estimated to be USD 11.67 Million as of 2022.
5. What are some drivers contributing to market growth?
Rising Demand from the Packaging Industry.
6. What are the notable trends driving market growth?
Increasing Demand from the Industrial Packaging Sector.
7. Are there any restraints impacting market growth?
Molded Pulp as a Green Alternative.
8. Can you provide examples of recent developments in the market?
In March 2021, Recticel announced that it successfully acquired FoamPartner, the Swiss-based global provider of high-added-value technical foams. Recticel Flexible Foams and FoamPartner are merged to form the Recticel Engineered Foams business line. The new organization will leverage numerous synergies in resources and talents to promote excellence, grow its global presence, and accelerate the commercialization of sustainable innovations and leading-edge solutions to global markets.
9. What pricing options are available for accessing the report?
Pricing options include single-user, multi-user, and enterprise licenses priced at USD 4750, USD 5250, and USD 8750 respectively.
10. Is the market size provided in terms of value or volume?
The market size is provided in terms of value, measured in Million and volume, measured in K Tons.
11. Are there any specific market keywords associated with the report?
Yes, the market keyword associated with the report is "Packaging Foams Industry," which aids in identifying and referencing the specific market segment covered.
12. How do I determine which pricing option suits my needs best?
The pricing options vary based on user requirements and access needs. Individual users may opt for single-user licenses, while businesses requiring broader access may choose multi-user or enterprise licenses for cost-effective access to the report.
13. Are there any additional resources or data provided in the Packaging Foams Industry report?
While the report offers comprehensive insights, it's advisable to review the specific contents or supplementary materials provided to ascertain if additional resources or data are available.
14. How can I stay updated on further developments or reports in the Packaging Foams Industry?
To stay informed about further developments, trends, and reports in the Packaging Foams Industry, consider subscribing to industry newsletters, following relevant companies and organizations, or regularly checking reputable industry news sources and publications.
Methodology
Step 1 - Identification of Relevant Samples Size from Population Database


Step 2 - Approaches for Defining Global Market Size (Value, Volume* & Price*)

Note*: In applicable scenarios
Step 3 - Data Sources
Primary Research
- Web Analytics
- Survey Reports
- Research Institute
- Latest Research Reports
- Opinion Leaders
Secondary Research
- Annual Reports
- White Paper
- Latest Press Release
- Industry Association
- Paid Database
- Investor Presentations

Step 4 - Data Triangulation
Involves using different sources of information in order to increase the validity of a study
These sources are likely to be stakeholders in a program - participants, other researchers, program staff, other community members, and so on.
Then we put all data in single framework & apply various statistical tools to find out the dynamic on the market.
During the analysis stage, feedback from the stakeholder groups would be compared to determine areas of agreement as well as areas of divergence
