

Key Insights
The global oxide advanced ceramics market is experiencing robust growth, driven by increasing demand across diverse sectors. The market's expansion is fueled by several key factors, including the superior properties of oxide ceramics – such as high hardness, chemical resistance, and thermal stability – making them ideal for demanding applications in electronics, automotive, aerospace, and energy. Technological advancements, particularly in the development of high-performance materials with tailored properties, are further propelling market growth. For example, advancements in processing techniques are leading to the creation of more complex shapes and improved tolerances, opening up new application possibilities. Furthermore, the rising adoption of electric vehicles and renewable energy sources is creating a surge in demand for advanced ceramic components in these sectors. While the supply chain complexities and raw material price fluctuations pose some challenges, the overall market outlook remains positive due to the continuous innovation and diversification of applications.
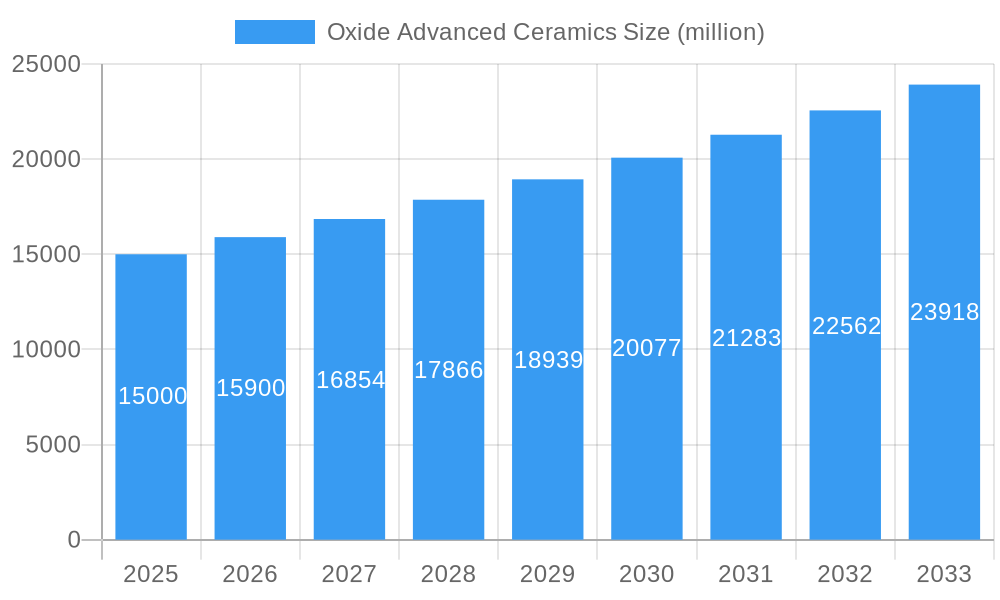
Oxide Advanced Ceramics Market Size (In Billion)
Despite the promising growth trajectory, certain restraints influence the oxide advanced ceramics market. The high production costs associated with manufacturing advanced ceramics can limit wider adoption in price-sensitive sectors. Additionally, the complexities involved in processing and the need for specialized equipment can create barriers to entry for new players. However, ongoing research and development efforts are focused on mitigating these challenges through improved manufacturing techniques and cost-effective production methods. The market is witnessing a shift towards sustainable manufacturing practices, which is further driving innovation and creating opportunities for eco-friendly materials and production processes. This combination of expanding applications, technological progress, and a growing focus on sustainability indicates a strong future for the oxide advanced ceramics market. We estimate the market size to be approximately $15 billion in 2025, growing at a CAGR of 6% from 2025 to 2033. This is based on observed growth trends in related industries and consideration of the factors described above.
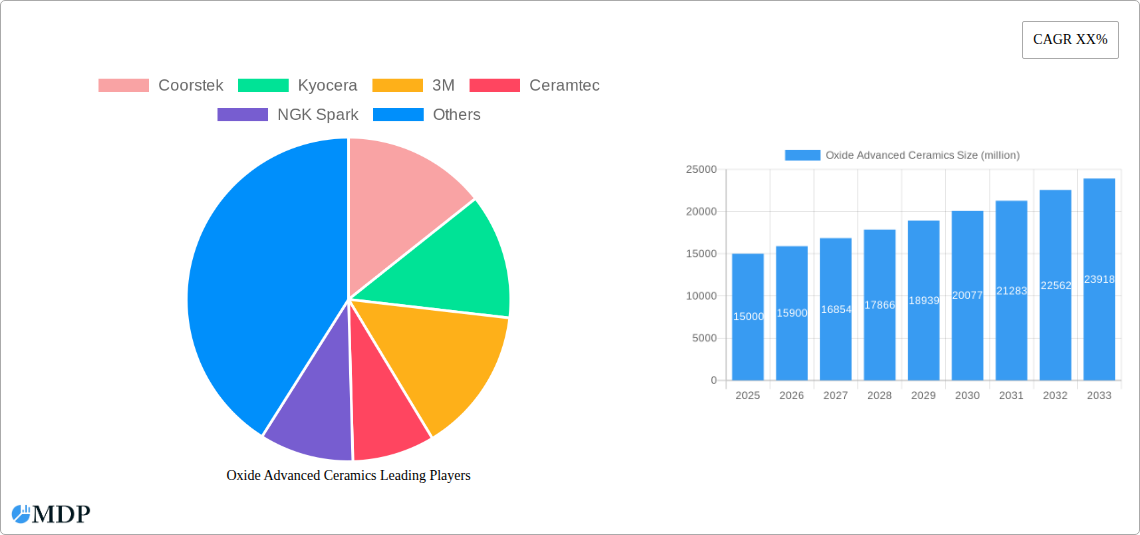
Oxide Advanced Ceramics Company Market Share
Oxide Advanced Ceramics Market Report: 2019-2033
This comprehensive report provides an in-depth analysis of the Oxide Advanced Ceramics market, projecting a XX million valuation by 2033. It covers market dynamics, industry trends, leading players, and future opportunities, offering actionable insights for stakeholders across the value chain. The report utilizes data from 2019-2024 (Historical Period), with a base year of 2025 and a forecast period extending to 2033 (Forecast Period: 2025-2033). Key players analyzed include Coorstek, Kyocera, 3M, Ceramtec, NGK Spark Plug, Morgan Advanced Materials, ERIKS, TOTO, Japan Fine Ceramics, Rauschert Steinbach, Schunk, and Sinocera.
Oxide Advanced Ceramics Market Dynamics & Concentration
The Oxide Advanced Ceramics market, valued at XX million in 2025, exhibits a moderately concentrated landscape. Key players like Coorstek, Kyocera, and 3M hold significant market share, collectively accounting for an estimated XX% in 2025. Market concentration is influenced by factors such as high R&D investment, stringent quality control, and specialized manufacturing processes. Innovation, driven by the need for advanced materials in diverse sectors like electronics and aerospace, is a major growth driver. Stringent regulatory frameworks concerning material safety and environmental impact further shape market dynamics. Product substitutes, such as polymers and composites, present competitive pressure, although oxide ceramics maintain an edge in high-temperature and high-strength applications. End-user trends, particularly in automotive and electronics, significantly influence demand. M&A activities have been moderate in recent years, with approximately XX deals recorded between 2019 and 2024, primarily focused on expanding product portfolios and geographic reach.
Oxide Advanced Ceramics Industry Trends & Analysis
The Oxide Advanced Ceramics market is projected to witness a Compound Annual Growth Rate (CAGR) of XX% during the forecast period (2025-2033). This growth is fueled by several key trends. Technological advancements, particularly in additive manufacturing and nanotechnology, are enhancing material properties and enabling the creation of complex shapes. Growing consumer demand for lightweight, high-performance materials in electronics, aerospace, and automotive industries is driving market expansion. Competitive dynamics are intense, with leading players focusing on product diversification and strategic partnerships to maintain their market positions. Market penetration is increasing across various applications, including sensors, actuators, and structural components. The shift towards sustainable manufacturing practices and the increasing adoption of advanced ceramic composites are also contributing to market growth.
Leading Markets & Segments in Oxide Advanced Ceramics
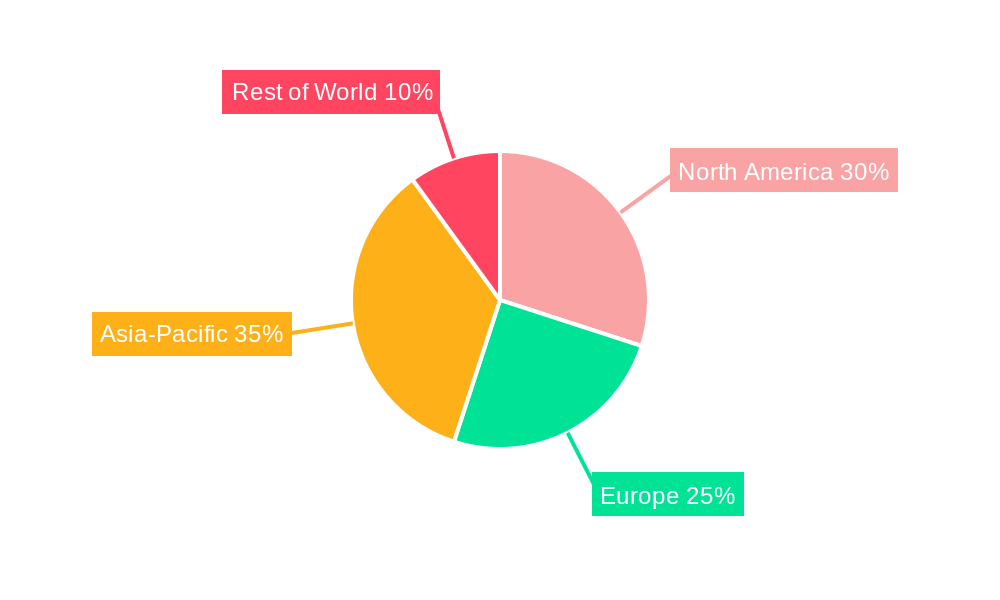
The Asia-Pacific region dominates the Oxide Advanced Ceramics market, driven by robust economic growth, significant infrastructure development, and a concentration of key manufacturers in countries like Japan and China.
- Key Drivers in Asia-Pacific:
- Rapid industrialization and urbanization.
- Government initiatives promoting technological advancement.
- Growing demand from electronics and automotive sectors.
- Abundance of raw materials.
The dominance of the Asia-Pacific region is expected to continue throughout the forecast period, although other regions, particularly North America and Europe, are also experiencing steady growth, driven by investments in renewable energy technologies and advancements in medical devices. Within the segments, high-performance electronics and automotive applications are the major contributors to market revenue.
Oxide Advanced Ceramics Product Developments
Recent product innovations focus on enhancing the strength, durability, and thermal properties of oxide advanced ceramics. Developments in nano-structured ceramics and the incorporation of advanced functionalities are improving application performance. The integration of these materials into new-generation electronics, aerospace components, and biomedical implants is broadening their market reach. These advancements provide a strong competitive advantage, particularly in niche applications requiring high precision and reliability.
Key Drivers of Oxide Advanced Ceramics Growth
Several factors drive the growth of the Oxide Advanced Ceramics market. Technological advancements, such as additive manufacturing and nano-engineering, are enabling the creation of high-performance materials with tailored properties. The increasing demand for lightweight and high-strength materials in various sectors, like aerospace and automotive, further fuels market expansion. Government regulations promoting the adoption of energy-efficient and environmentally friendly materials also contribute to growth. For example, stringent emission norms in the automotive industry are driving the demand for advanced ceramic components in exhaust systems.
Challenges in the Oxide Advanced Ceramics Market
The Oxide Advanced Ceramics market faces several challenges, including high manufacturing costs, complex processing techniques, and the availability of raw materials. Regulatory hurdles regarding material safety and environmental compliance add to the cost burden and can delay product development. Supply chain disruptions can impact production and lead to price volatility. Intense competition among established players and the emergence of new entrants further pose challenges to market participants. These factors collectively limit market growth and affect profitability.
Emerging Opportunities in Oxide Advanced Ceramics
Significant opportunities exist for the long-term growth of the Oxide Advanced Ceramics market. Technological breakthroughs in material science and manufacturing processes are continually improving material properties and expanding application possibilities. Strategic partnerships between material suppliers and end-users can accelerate product development and market penetration. Expansion into emerging markets with growing demand for advanced materials will further drive market growth. Focusing on sustainable manufacturing processes and developing eco-friendly materials will open new market segments.
Leading Players in the Oxide Advanced Ceramics Sector
- Coorstek
- Kyocera
- 3M
- Ceramtec
- NGK Spark Plug
- Morgan Advanced Materials
- ERIKS
- TOTO
- Japan Fine Ceramics
- Rauschert Steinbach
- Schunk
- Sinocera
Key Milestones in Oxide Advanced Ceramics Industry
- 2020: Launch of a new high-temperature ceramic composite by Coorstek.
- 2021: Acquisition of a smaller ceramic manufacturer by Kyocera, expanding its product portfolio.
- 2022: Introduction of a novel 3D printing technology for advanced ceramics by a research institution.
- 2023: Development of new environmental regulations impacting manufacturing processes.
- 2024: Significant investment in R&D by several key players focused on sustainable ceramic materials.
Strategic Outlook for Oxide Advanced Ceramics Market
The Oxide Advanced Ceramics market holds significant potential for future growth, driven by continuous technological advancements and increasing demand from various industries. Strategic partnerships, focused R&D initiatives, and expansion into new markets are key growth accelerators. Companies that invest in sustainable manufacturing practices and develop innovative, high-performance materials are well-positioned to capture significant market share in the coming years. The market is expected to see continued consolidation through mergers and acquisitions, further shaping the competitive landscape.
Oxide Advanced Ceramics Segmentation
-
1. Application
- 1.1. Automobile Industry
- 1.2. Aerospace
- 1.3. Petrochemical
- 1.4. Semiconductor Manufacturing Equipment
- 1.5. General Industry
- 1.6. Others
-
2. Types
- 2.1. Alumina Ceramics
- 2.2. Zirconia Ceramics
- 2.3. Others
Oxide Advanced Ceramics Segmentation By Geography
-
1. North America
- 1.1. United States
- 1.2. Canada
- 1.3. Mexico
-
2. South America
- 2.1. Brazil
- 2.2. Argentina
- 2.3. Rest of South America
-
3. Europe
- 3.1. United Kingdom
- 3.2. Germany
- 3.3. France
- 3.4. Italy
- 3.5. Spain
- 3.6. Russia
- 3.7. Benelux
- 3.8. Nordics
- 3.9. Rest of Europe
-
4. Middle East & Africa
- 4.1. Turkey
- 4.2. Israel
- 4.3. GCC
- 4.4. North Africa
- 4.5. South Africa
- 4.6. Rest of Middle East & Africa
-
5. Asia Pacific
- 5.1. China
- 5.2. India
- 5.3. Japan
- 5.4. South Korea
- 5.5. ASEAN
- 5.6. Oceania
- 5.7. Rest of Asia Pacific
Oxide Advanced Ceramics Regional Market Share
Geographic Coverage of Oxide Advanced Ceramics
Oxide Advanced Ceramics REPORT HIGHLIGHTS
| Aspects | Details |
|---|---|
| Study Period | 2020-2034 |
| Base Year | 2025 |
| Estimated Year | 2026 |
| Forecast Period | 2026-2034 |
| Historical Period | 2020-2025 |
| Growth Rate | CAGR of XX% from 2020-2034 |
| Segmentation |
|
Table of Contents
- 1. Introduction
- 1.1. Research Scope
- 1.2. Market Segmentation
- 1.3. Research Objective
- 1.4. Definitions and Assumptions
- 2. Executive Summary
- 2.1. Market Snapshot
- 3. Market Dynamics
- 3.1. Market Drivers
- 3.2. Market Restrains
- 3.3. Market Trends
- 3.4. Market Opportunities
- 4. Market Factor Analysis
- 4.1. Porters Five Forces
- 4.1.1. Bargaining Power of Suppliers
- 4.1.2. Bargaining Power of Buyers
- 4.1.3. Threat of New Entrants
- 4.1.4. Threat of Substitutes
- 4.1.5. Competitive Rivalry
- 4.2. PESTEL analysis
- 4.3. BCG Analysis
- 4.3.1. Stars (High Growth, High Market Share)
- 4.3.2. Cash Cows (Low Growth, High Market Share)
- 4.3.3. Question Mark (High Growth, Low Market Share)
- 4.3.4. Dogs (Low Growth, Low Market Share)
- 4.4. Ansoff Matrix Analysis
- 4.5. Supply Chain Analysis
- 4.6. Regulatory Landscape
- 4.7. Current Market Potential and Opportunity Assessment (TAM–SAM–SOM Framework)
- 4.8. MDP Analyst Note
- 4.1. Porters Five Forces
- 5. Market Analysis, Insights and Forecast 2021-2033
- 5.1. Market Analysis, Insights and Forecast - by Application
- 5.1.1. Automobile Industry
- 5.1.2. Aerospace
- 5.1.3. Petrochemical
- 5.1.4. Semiconductor Manufacturing Equipment
- 5.1.5. General Industry
- 5.1.6. Others
- 5.2. Market Analysis, Insights and Forecast - by Types
- 5.2.1. Alumina Ceramics
- 5.2.2. Zirconia Ceramics
- 5.2.3. Others
- 5.3. Market Analysis, Insights and Forecast - by Region
- 5.3.1. North America
- 5.3.2. South America
- 5.3.3. Europe
- 5.3.4. Middle East & Africa
- 5.3.5. Asia Pacific
- 5.1. Market Analysis, Insights and Forecast - by Application
- 6. Global Oxide Advanced Ceramics Analysis, Insights and Forecast, 2021-2033
- 6.1. Market Analysis, Insights and Forecast - by Application
- 6.1.1. Automobile Industry
- 6.1.2. Aerospace
- 6.1.3. Petrochemical
- 6.1.4. Semiconductor Manufacturing Equipment
- 6.1.5. General Industry
- 6.1.6. Others
- 6.2. Market Analysis, Insights and Forecast - by Types
- 6.2.1. Alumina Ceramics
- 6.2.2. Zirconia Ceramics
- 6.2.3. Others
- 6.1. Market Analysis, Insights and Forecast - by Application
- 7. North America Oxide Advanced Ceramics Analysis, Insights and Forecast, 2020-2032
- 7.1. Market Analysis, Insights and Forecast - by Application
- 7.1.1. Automobile Industry
- 7.1.2. Aerospace
- 7.1.3. Petrochemical
- 7.1.4. Semiconductor Manufacturing Equipment
- 7.1.5. General Industry
- 7.1.6. Others
- 7.2. Market Analysis, Insights and Forecast - by Types
- 7.2.1. Alumina Ceramics
- 7.2.2. Zirconia Ceramics
- 7.2.3. Others
- 7.1. Market Analysis, Insights and Forecast - by Application
- 8. South America Oxide Advanced Ceramics Analysis, Insights and Forecast, 2020-2032
- 8.1. Market Analysis, Insights and Forecast - by Application
- 8.1.1. Automobile Industry
- 8.1.2. Aerospace
- 8.1.3. Petrochemical
- 8.1.4. Semiconductor Manufacturing Equipment
- 8.1.5. General Industry
- 8.1.6. Others
- 8.2. Market Analysis, Insights and Forecast - by Types
- 8.2.1. Alumina Ceramics
- 8.2.2. Zirconia Ceramics
- 8.2.3. Others
- 8.1. Market Analysis, Insights and Forecast - by Application
- 9. Europe Oxide Advanced Ceramics Analysis, Insights and Forecast, 2020-2032
- 9.1. Market Analysis, Insights and Forecast - by Application
- 9.1.1. Automobile Industry
- 9.1.2. Aerospace
- 9.1.3. Petrochemical
- 9.1.4. Semiconductor Manufacturing Equipment
- 9.1.5. General Industry
- 9.1.6. Others
- 9.2. Market Analysis, Insights and Forecast - by Types
- 9.2.1. Alumina Ceramics
- 9.2.2. Zirconia Ceramics
- 9.2.3. Others
- 9.1. Market Analysis, Insights and Forecast - by Application
- 10. Middle East & Africa Oxide Advanced Ceramics Analysis, Insights and Forecast, 2020-2032
- 10.1. Market Analysis, Insights and Forecast - by Application
- 10.1.1. Automobile Industry
- 10.1.2. Aerospace
- 10.1.3. Petrochemical
- 10.1.4. Semiconductor Manufacturing Equipment
- 10.1.5. General Industry
- 10.1.6. Others
- 10.2. Market Analysis, Insights and Forecast - by Types
- 10.2.1. Alumina Ceramics
- 10.2.2. Zirconia Ceramics
- 10.2.3. Others
- 10.1. Market Analysis, Insights and Forecast - by Application
- 11. Asia Pacific Oxide Advanced Ceramics Analysis, Insights and Forecast, 2020-2032
- 11.1. Market Analysis, Insights and Forecast - by Application
- 11.1.1. Automobile Industry
- 11.1.2. Aerospace
- 11.1.3. Petrochemical
- 11.1.4. Semiconductor Manufacturing Equipment
- 11.1.5. General Industry
- 11.1.6. Others
- 11.2. Market Analysis, Insights and Forecast - by Types
- 11.2.1. Alumina Ceramics
- 11.2.2. Zirconia Ceramics
- 11.2.3. Others
- 11.1. Market Analysis, Insights and Forecast - by Application
- 12. Competitive Analysis
- 12.1. Company Profiles
- 12.1.1 Coorstek
- 12.1.1.1. Company Overview
- 12.1.1.2. Products
- 12.1.1.3. Company Financials
- 12.1.1.4. SWOT Analysis
- 12.1.2 Kyocera
- 12.1.2.1. Company Overview
- 12.1.2.2. Products
- 12.1.2.3. Company Financials
- 12.1.2.4. SWOT Analysis
- 12.1.3 3M
- 12.1.3.1. Company Overview
- 12.1.3.2. Products
- 12.1.3.3. Company Financials
- 12.1.3.4. SWOT Analysis
- 12.1.4 Ceramtec
- 12.1.4.1. Company Overview
- 12.1.4.2. Products
- 12.1.4.3. Company Financials
- 12.1.4.4. SWOT Analysis
- 12.1.5 NGK Spark
- 12.1.5.1. Company Overview
- 12.1.5.2. Products
- 12.1.5.3. Company Financials
- 12.1.5.4. SWOT Analysis
- 12.1.6 Morgan Advanced Materials
- 12.1.6.1. Company Overview
- 12.1.6.2. Products
- 12.1.6.3. Company Financials
- 12.1.6.4. SWOT Analysis
- 12.1.7 ERIKS
- 12.1.7.1. Company Overview
- 12.1.7.2. Products
- 12.1.7.3. Company Financials
- 12.1.7.4. SWOT Analysis
- 12.1.8 TOTO
- 12.1.8.1. Company Overview
- 12.1.8.2. Products
- 12.1.8.3. Company Financials
- 12.1.8.4. SWOT Analysis
- 12.1.9 Japan Fine Ceramics
- 12.1.9.1. Company Overview
- 12.1.9.2. Products
- 12.1.9.3. Company Financials
- 12.1.9.4. SWOT Analysis
- 12.1.10 Rauschert Steinbach
- 12.1.10.1. Company Overview
- 12.1.10.2. Products
- 12.1.10.3. Company Financials
- 12.1.10.4. SWOT Analysis
- 12.1.11 Schunk
- 12.1.11.1. Company Overview
- 12.1.11.2. Products
- 12.1.11.3. Company Financials
- 12.1.11.4. SWOT Analysis
- 12.1.12 Sinocera
- 12.1.12.1. Company Overview
- 12.1.12.2. Products
- 12.1.12.3. Company Financials
- 12.1.12.4. SWOT Analysis
- 12.1.1 Coorstek
- 12.2. Market Entropy
- 12.2.1 Company's Key Areas Served
- 12.2.2 Recent Developments
- 12.3. Company Market Share Analysis 2025
- 12.3.1 Top 5 Companies Market Share Analysis
- 12.3.2 Top 3 Companies Market Share Analysis
- 12.4. List of Potential Customers
- 13. Research Methodology
List of Figures
- Figure 1: Global Oxide Advanced Ceramics Revenue Breakdown (million, %) by Region 2025 & 2033
- Figure 2: Global Oxide Advanced Ceramics Volume Breakdown (K, %) by Region 2025 & 2033
- Figure 3: North America Oxide Advanced Ceramics Revenue (million), by Application 2025 & 2033
- Figure 4: North America Oxide Advanced Ceramics Volume (K), by Application 2025 & 2033
- Figure 5: North America Oxide Advanced Ceramics Revenue Share (%), by Application 2025 & 2033
- Figure 6: North America Oxide Advanced Ceramics Volume Share (%), by Application 2025 & 2033
- Figure 7: North America Oxide Advanced Ceramics Revenue (million), by Types 2025 & 2033
- Figure 8: North America Oxide Advanced Ceramics Volume (K), by Types 2025 & 2033
- Figure 9: North America Oxide Advanced Ceramics Revenue Share (%), by Types 2025 & 2033
- Figure 10: North America Oxide Advanced Ceramics Volume Share (%), by Types 2025 & 2033
- Figure 11: North America Oxide Advanced Ceramics Revenue (million), by Country 2025 & 2033
- Figure 12: North America Oxide Advanced Ceramics Volume (K), by Country 2025 & 2033
- Figure 13: North America Oxide Advanced Ceramics Revenue Share (%), by Country 2025 & 2033
- Figure 14: North America Oxide Advanced Ceramics Volume Share (%), by Country 2025 & 2033
- Figure 15: South America Oxide Advanced Ceramics Revenue (million), by Application 2025 & 2033
- Figure 16: South America Oxide Advanced Ceramics Volume (K), by Application 2025 & 2033
- Figure 17: South America Oxide Advanced Ceramics Revenue Share (%), by Application 2025 & 2033
- Figure 18: South America Oxide Advanced Ceramics Volume Share (%), by Application 2025 & 2033
- Figure 19: South America Oxide Advanced Ceramics Revenue (million), by Types 2025 & 2033
- Figure 20: South America Oxide Advanced Ceramics Volume (K), by Types 2025 & 2033
- Figure 21: South America Oxide Advanced Ceramics Revenue Share (%), by Types 2025 & 2033
- Figure 22: South America Oxide Advanced Ceramics Volume Share (%), by Types 2025 & 2033
- Figure 23: South America Oxide Advanced Ceramics Revenue (million), by Country 2025 & 2033
- Figure 24: South America Oxide Advanced Ceramics Volume (K), by Country 2025 & 2033
- Figure 25: South America Oxide Advanced Ceramics Revenue Share (%), by Country 2025 & 2033
- Figure 26: South America Oxide Advanced Ceramics Volume Share (%), by Country 2025 & 2033
- Figure 27: Europe Oxide Advanced Ceramics Revenue (million), by Application 2025 & 2033
- Figure 28: Europe Oxide Advanced Ceramics Volume (K), by Application 2025 & 2033
- Figure 29: Europe Oxide Advanced Ceramics Revenue Share (%), by Application 2025 & 2033
- Figure 30: Europe Oxide Advanced Ceramics Volume Share (%), by Application 2025 & 2033
- Figure 31: Europe Oxide Advanced Ceramics Revenue (million), by Types 2025 & 2033
- Figure 32: Europe Oxide Advanced Ceramics Volume (K), by Types 2025 & 2033
- Figure 33: Europe Oxide Advanced Ceramics Revenue Share (%), by Types 2025 & 2033
- Figure 34: Europe Oxide Advanced Ceramics Volume Share (%), by Types 2025 & 2033
- Figure 35: Europe Oxide Advanced Ceramics Revenue (million), by Country 2025 & 2033
- Figure 36: Europe Oxide Advanced Ceramics Volume (K), by Country 2025 & 2033
- Figure 37: Europe Oxide Advanced Ceramics Revenue Share (%), by Country 2025 & 2033
- Figure 38: Europe Oxide Advanced Ceramics Volume Share (%), by Country 2025 & 2033
- Figure 39: Middle East & Africa Oxide Advanced Ceramics Revenue (million), by Application 2025 & 2033
- Figure 40: Middle East & Africa Oxide Advanced Ceramics Volume (K), by Application 2025 & 2033
- Figure 41: Middle East & Africa Oxide Advanced Ceramics Revenue Share (%), by Application 2025 & 2033
- Figure 42: Middle East & Africa Oxide Advanced Ceramics Volume Share (%), by Application 2025 & 2033
- Figure 43: Middle East & Africa Oxide Advanced Ceramics Revenue (million), by Types 2025 & 2033
- Figure 44: Middle East & Africa Oxide Advanced Ceramics Volume (K), by Types 2025 & 2033
- Figure 45: Middle East & Africa Oxide Advanced Ceramics Revenue Share (%), by Types 2025 & 2033
- Figure 46: Middle East & Africa Oxide Advanced Ceramics Volume Share (%), by Types 2025 & 2033
- Figure 47: Middle East & Africa Oxide Advanced Ceramics Revenue (million), by Country 2025 & 2033
- Figure 48: Middle East & Africa Oxide Advanced Ceramics Volume (K), by Country 2025 & 2033
- Figure 49: Middle East & Africa Oxide Advanced Ceramics Revenue Share (%), by Country 2025 & 2033
- Figure 50: Middle East & Africa Oxide Advanced Ceramics Volume Share (%), by Country 2025 & 2033
- Figure 51: Asia Pacific Oxide Advanced Ceramics Revenue (million), by Application 2025 & 2033
- Figure 52: Asia Pacific Oxide Advanced Ceramics Volume (K), by Application 2025 & 2033
- Figure 53: Asia Pacific Oxide Advanced Ceramics Revenue Share (%), by Application 2025 & 2033
- Figure 54: Asia Pacific Oxide Advanced Ceramics Volume Share (%), by Application 2025 & 2033
- Figure 55: Asia Pacific Oxide Advanced Ceramics Revenue (million), by Types 2025 & 2033
- Figure 56: Asia Pacific Oxide Advanced Ceramics Volume (K), by Types 2025 & 2033
- Figure 57: Asia Pacific Oxide Advanced Ceramics Revenue Share (%), by Types 2025 & 2033
- Figure 58: Asia Pacific Oxide Advanced Ceramics Volume Share (%), by Types 2025 & 2033
- Figure 59: Asia Pacific Oxide Advanced Ceramics Revenue (million), by Country 2025 & 2033
- Figure 60: Asia Pacific Oxide Advanced Ceramics Volume (K), by Country 2025 & 2033
- Figure 61: Asia Pacific Oxide Advanced Ceramics Revenue Share (%), by Country 2025 & 2033
- Figure 62: Asia Pacific Oxide Advanced Ceramics Volume Share (%), by Country 2025 & 2033
List of Tables
- Table 1: Global Oxide Advanced Ceramics Revenue million Forecast, by Application 2020 & 2033
- Table 2: Global Oxide Advanced Ceramics Volume K Forecast, by Application 2020 & 2033
- Table 3: Global Oxide Advanced Ceramics Revenue million Forecast, by Types 2020 & 2033
- Table 4: Global Oxide Advanced Ceramics Volume K Forecast, by Types 2020 & 2033
- Table 5: Global Oxide Advanced Ceramics Revenue million Forecast, by Region 2020 & 2033
- Table 6: Global Oxide Advanced Ceramics Volume K Forecast, by Region 2020 & 2033
- Table 7: Global Oxide Advanced Ceramics Revenue million Forecast, by Application 2020 & 2033
- Table 8: Global Oxide Advanced Ceramics Volume K Forecast, by Application 2020 & 2033
- Table 9: Global Oxide Advanced Ceramics Revenue million Forecast, by Types 2020 & 2033
- Table 10: Global Oxide Advanced Ceramics Volume K Forecast, by Types 2020 & 2033
- Table 11: Global Oxide Advanced Ceramics Revenue million Forecast, by Country 2020 & 2033
- Table 12: Global Oxide Advanced Ceramics Volume K Forecast, by Country 2020 & 2033
- Table 13: United States Oxide Advanced Ceramics Revenue (million) Forecast, by Application 2020 & 2033
- Table 14: United States Oxide Advanced Ceramics Volume (K) Forecast, by Application 2020 & 2033
- Table 15: Canada Oxide Advanced Ceramics Revenue (million) Forecast, by Application 2020 & 2033
- Table 16: Canada Oxide Advanced Ceramics Volume (K) Forecast, by Application 2020 & 2033
- Table 17: Mexico Oxide Advanced Ceramics Revenue (million) Forecast, by Application 2020 & 2033
- Table 18: Mexico Oxide Advanced Ceramics Volume (K) Forecast, by Application 2020 & 2033
- Table 19: Global Oxide Advanced Ceramics Revenue million Forecast, by Application 2020 & 2033
- Table 20: Global Oxide Advanced Ceramics Volume K Forecast, by Application 2020 & 2033
- Table 21: Global Oxide Advanced Ceramics Revenue million Forecast, by Types 2020 & 2033
- Table 22: Global Oxide Advanced Ceramics Volume K Forecast, by Types 2020 & 2033
- Table 23: Global Oxide Advanced Ceramics Revenue million Forecast, by Country 2020 & 2033
- Table 24: Global Oxide Advanced Ceramics Volume K Forecast, by Country 2020 & 2033
- Table 25: Brazil Oxide Advanced Ceramics Revenue (million) Forecast, by Application 2020 & 2033
- Table 26: Brazil Oxide Advanced Ceramics Volume (K) Forecast, by Application 2020 & 2033
- Table 27: Argentina Oxide Advanced Ceramics Revenue (million) Forecast, by Application 2020 & 2033
- Table 28: Argentina Oxide Advanced Ceramics Volume (K) Forecast, by Application 2020 & 2033
- Table 29: Rest of South America Oxide Advanced Ceramics Revenue (million) Forecast, by Application 2020 & 2033
- Table 30: Rest of South America Oxide Advanced Ceramics Volume (K) Forecast, by Application 2020 & 2033
- Table 31: Global Oxide Advanced Ceramics Revenue million Forecast, by Application 2020 & 2033
- Table 32: Global Oxide Advanced Ceramics Volume K Forecast, by Application 2020 & 2033
- Table 33: Global Oxide Advanced Ceramics Revenue million Forecast, by Types 2020 & 2033
- Table 34: Global Oxide Advanced Ceramics Volume K Forecast, by Types 2020 & 2033
- Table 35: Global Oxide Advanced Ceramics Revenue million Forecast, by Country 2020 & 2033
- Table 36: Global Oxide Advanced Ceramics Volume K Forecast, by Country 2020 & 2033
- Table 37: United Kingdom Oxide Advanced Ceramics Revenue (million) Forecast, by Application 2020 & 2033
- Table 38: United Kingdom Oxide Advanced Ceramics Volume (K) Forecast, by Application 2020 & 2033
- Table 39: Germany Oxide Advanced Ceramics Revenue (million) Forecast, by Application 2020 & 2033
- Table 40: Germany Oxide Advanced Ceramics Volume (K) Forecast, by Application 2020 & 2033
- Table 41: France Oxide Advanced Ceramics Revenue (million) Forecast, by Application 2020 & 2033
- Table 42: France Oxide Advanced Ceramics Volume (K) Forecast, by Application 2020 & 2033
- Table 43: Italy Oxide Advanced Ceramics Revenue (million) Forecast, by Application 2020 & 2033
- Table 44: Italy Oxide Advanced Ceramics Volume (K) Forecast, by Application 2020 & 2033
- Table 45: Spain Oxide Advanced Ceramics Revenue (million) Forecast, by Application 2020 & 2033
- Table 46: Spain Oxide Advanced Ceramics Volume (K) Forecast, by Application 2020 & 2033
- Table 47: Russia Oxide Advanced Ceramics Revenue (million) Forecast, by Application 2020 & 2033
- Table 48: Russia Oxide Advanced Ceramics Volume (K) Forecast, by Application 2020 & 2033
- Table 49: Benelux Oxide Advanced Ceramics Revenue (million) Forecast, by Application 2020 & 2033
- Table 50: Benelux Oxide Advanced Ceramics Volume (K) Forecast, by Application 2020 & 2033
- Table 51: Nordics Oxide Advanced Ceramics Revenue (million) Forecast, by Application 2020 & 2033
- Table 52: Nordics Oxide Advanced Ceramics Volume (K) Forecast, by Application 2020 & 2033
- Table 53: Rest of Europe Oxide Advanced Ceramics Revenue (million) Forecast, by Application 2020 & 2033
- Table 54: Rest of Europe Oxide Advanced Ceramics Volume (K) Forecast, by Application 2020 & 2033
- Table 55: Global Oxide Advanced Ceramics Revenue million Forecast, by Application 2020 & 2033
- Table 56: Global Oxide Advanced Ceramics Volume K Forecast, by Application 2020 & 2033
- Table 57: Global Oxide Advanced Ceramics Revenue million Forecast, by Types 2020 & 2033
- Table 58: Global Oxide Advanced Ceramics Volume K Forecast, by Types 2020 & 2033
- Table 59: Global Oxide Advanced Ceramics Revenue million Forecast, by Country 2020 & 2033
- Table 60: Global Oxide Advanced Ceramics Volume K Forecast, by Country 2020 & 2033
- Table 61: Turkey Oxide Advanced Ceramics Revenue (million) Forecast, by Application 2020 & 2033
- Table 62: Turkey Oxide Advanced Ceramics Volume (K) Forecast, by Application 2020 & 2033
- Table 63: Israel Oxide Advanced Ceramics Revenue (million) Forecast, by Application 2020 & 2033
- Table 64: Israel Oxide Advanced Ceramics Volume (K) Forecast, by Application 2020 & 2033
- Table 65: GCC Oxide Advanced Ceramics Revenue (million) Forecast, by Application 2020 & 2033
- Table 66: GCC Oxide Advanced Ceramics Volume (K) Forecast, by Application 2020 & 2033
- Table 67: North Africa Oxide Advanced Ceramics Revenue (million) Forecast, by Application 2020 & 2033
- Table 68: North Africa Oxide Advanced Ceramics Volume (K) Forecast, by Application 2020 & 2033
- Table 69: South Africa Oxide Advanced Ceramics Revenue (million) Forecast, by Application 2020 & 2033
- Table 70: South Africa Oxide Advanced Ceramics Volume (K) Forecast, by Application 2020 & 2033
- Table 71: Rest of Middle East & Africa Oxide Advanced Ceramics Revenue (million) Forecast, by Application 2020 & 2033
- Table 72: Rest of Middle East & Africa Oxide Advanced Ceramics Volume (K) Forecast, by Application 2020 & 2033
- Table 73: Global Oxide Advanced Ceramics Revenue million Forecast, by Application 2020 & 2033
- Table 74: Global Oxide Advanced Ceramics Volume K Forecast, by Application 2020 & 2033
- Table 75: Global Oxide Advanced Ceramics Revenue million Forecast, by Types 2020 & 2033
- Table 76: Global Oxide Advanced Ceramics Volume K Forecast, by Types 2020 & 2033
- Table 77: Global Oxide Advanced Ceramics Revenue million Forecast, by Country 2020 & 2033
- Table 78: Global Oxide Advanced Ceramics Volume K Forecast, by Country 2020 & 2033
- Table 79: China Oxide Advanced Ceramics Revenue (million) Forecast, by Application 2020 & 2033
- Table 80: China Oxide Advanced Ceramics Volume (K) Forecast, by Application 2020 & 2033
- Table 81: India Oxide Advanced Ceramics Revenue (million) Forecast, by Application 2020 & 2033
- Table 82: India Oxide Advanced Ceramics Volume (K) Forecast, by Application 2020 & 2033
- Table 83: Japan Oxide Advanced Ceramics Revenue (million) Forecast, by Application 2020 & 2033
- Table 84: Japan Oxide Advanced Ceramics Volume (K) Forecast, by Application 2020 & 2033
- Table 85: South Korea Oxide Advanced Ceramics Revenue (million) Forecast, by Application 2020 & 2033
- Table 86: South Korea Oxide Advanced Ceramics Volume (K) Forecast, by Application 2020 & 2033
- Table 87: ASEAN Oxide Advanced Ceramics Revenue (million) Forecast, by Application 2020 & 2033
- Table 88: ASEAN Oxide Advanced Ceramics Volume (K) Forecast, by Application 2020 & 2033
- Table 89: Oceania Oxide Advanced Ceramics Revenue (million) Forecast, by Application 2020 & 2033
- Table 90: Oceania Oxide Advanced Ceramics Volume (K) Forecast, by Application 2020 & 2033
- Table 91: Rest of Asia Pacific Oxide Advanced Ceramics Revenue (million) Forecast, by Application 2020 & 2033
- Table 92: Rest of Asia Pacific Oxide Advanced Ceramics Volume (K) Forecast, by Application 2020 & 2033
Frequently Asked Questions
1. What is the projected Compound Annual Growth Rate (CAGR) of the Oxide Advanced Ceramics?
The projected CAGR is approximately XX%.
2. Which companies are prominent players in the Oxide Advanced Ceramics?
Key companies in the market include Coorstek, Kyocera, 3M, Ceramtec, NGK Spark, Morgan Advanced Materials, ERIKS, TOTO, Japan Fine Ceramics, Rauschert Steinbach, Schunk, Sinocera.
3. What are the main segments of the Oxide Advanced Ceramics?
The market segments include Application, Types.
4. Can you provide details about the market size?
The market size is estimated to be USD XXX million as of 2022.
5. What are some drivers contributing to market growth?
N/A
6. What are the notable trends driving market growth?
N/A
7. Are there any restraints impacting market growth?
N/A
8. Can you provide examples of recent developments in the market?
N/A
9. What pricing options are available for accessing the report?
Pricing options include single-user, multi-user, and enterprise licenses priced at USD 3950.00, USD 5925.00, and USD 7900.00 respectively.
10. Is the market size provided in terms of value or volume?
The market size is provided in terms of value, measured in million and volume, measured in K.
11. Are there any specific market keywords associated with the report?
Yes, the market keyword associated with the report is "Oxide Advanced Ceramics," which aids in identifying and referencing the specific market segment covered.
12. How do I determine which pricing option suits my needs best?
The pricing options vary based on user requirements and access needs. Individual users may opt for single-user licenses, while businesses requiring broader access may choose multi-user or enterprise licenses for cost-effective access to the report.
13. Are there any additional resources or data provided in the Oxide Advanced Ceramics report?
While the report offers comprehensive insights, it's advisable to review the specific contents or supplementary materials provided to ascertain if additional resources or data are available.
14. How can I stay updated on further developments or reports in the Oxide Advanced Ceramics?
To stay informed about further developments, trends, and reports in the Oxide Advanced Ceramics, consider subscribing to industry newsletters, following relevant companies and organizations, or regularly checking reputable industry news sources and publications.
Methodology
Step 1 - Identification of Relevant Samples Size from Population Database


Step 2 - Approaches for Defining Global Market Size (Value, Volume* & Price*)

Note*: In applicable scenarios
Step 3 - Data Sources
Primary Research
- Web Analytics
- Survey Reports
- Research Institute
- Latest Research Reports
- Opinion Leaders
Secondary Research
- Annual Reports
- White Paper
- Latest Press Release
- Industry Association
- Paid Database
- Investor Presentations

Step 4 - Data Triangulation
Involves using different sources of information in order to increase the validity of a study
These sources are likely to be stakeholders in a program - participants, other researchers, program staff, other community members, and so on.
Then we put all data in single framework & apply various statistical tools to find out the dynamic on the market.
During the analysis stage, feedback from the stakeholder groups would be compared to determine areas of agreement as well as areas of divergence