

Key Insights
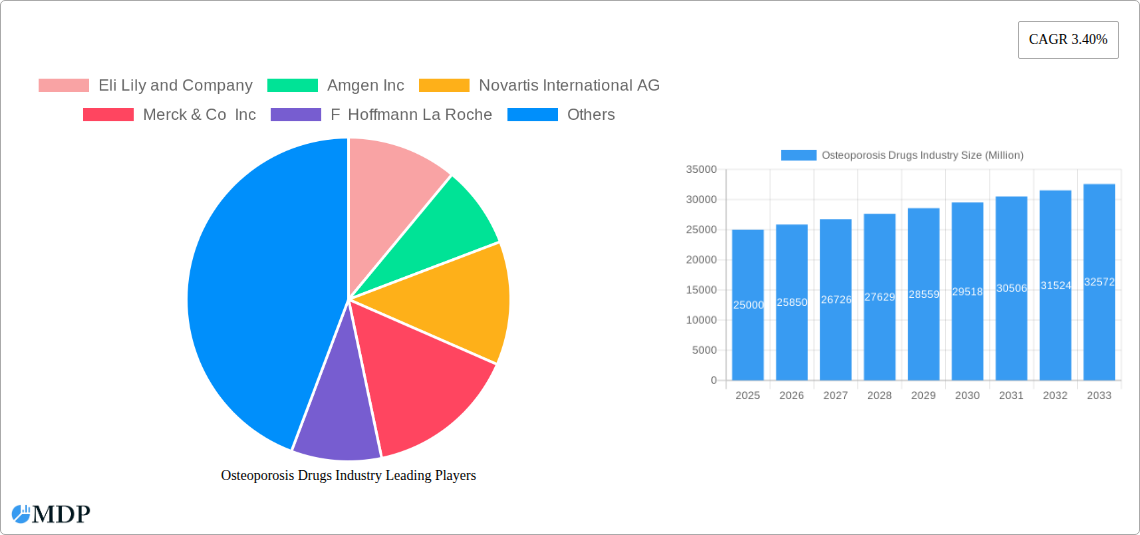
The global osteoporosis drugs market, currently exhibiting a robust presence, is projected to maintain steady growth throughout the forecast period (2025-2033). A CAGR of 3.40% indicates a consistent expansion driven by several key factors. The aging global population, a primary driver, contributes significantly to the increasing prevalence of osteoporosis, necessitating higher demand for effective treatment options. Furthermore, advancements in drug development, particularly in novel therapies targeting specific mechanisms of bone loss, are fueling market growth. The market is segmented by drug type (Parathyroid Hormone Therapy, Bisphosphonates, Calcitonin, RANKL Inhibitors, and Others) and application (Primary and Secondary Osteoporosis). Parathyroid Hormone Therapy and Bisphosphonates currently dominate the market, though RANKL inhibitors are gaining traction due to their efficacy and improved safety profiles. Geographic variations exist, with North America and Europe holding substantial market shares owing to higher healthcare expenditure and prevalence rates. However, emerging economies in Asia-Pacific are expected to demonstrate significant growth potential as healthcare infrastructure develops and awareness of osteoporosis increases. Despite these positive trends, challenges such as high treatment costs and potential side effects of certain drugs represent restraints to market growth. Competition among major pharmaceutical companies, including Eli Lilly and Company, Amgen Inc., and Novartis, drives innovation and the availability of various treatment options.
The competitive landscape is characterized by ongoing research and development efforts focused on improving drug efficacy, reducing side effects, and developing more convenient delivery methods. This continuous innovation is crucial for expanding the market's reach and addressing the unmet needs of osteoporosis patients. Furthermore, the market's future trajectory is closely linked to evolving healthcare policies, insurance coverage for osteoporosis treatments, and public health initiatives aimed at raising awareness and promoting early diagnosis and management of the disease. A comprehensive understanding of these market dynamics is crucial for both pharmaceutical companies operating within this space and stakeholders involved in healthcare policy and patient care. The ongoing shift towards personalized medicine is also anticipated to influence market growth, leading to the development of targeted therapies based on individual patient characteristics.
Osteoporosis Drugs Industry: A Comprehensive Market Report (2019-2033)
This comprehensive report provides an in-depth analysis of the global osteoporosis drugs market, offering valuable insights for stakeholders across the pharmaceutical industry. Covering the period from 2019 to 2033, with a focus on 2025, this report meticulously examines market dynamics, leading players, emerging trends, and future growth prospects. The global market size is projected to reach xx Million by 2033, showcasing significant growth potential.
Osteoporosis Drugs Industry Market Dynamics & Concentration
The osteoporosis drugs market is characterized by a moderately concentrated landscape, with several key players holding significant market share. The top ten companies—Eli Lily and Company, Amgen Inc, Novartis International AG, Merck & Co Inc, F Hoffmann La Roche, Teva Pharmaceutical Industries Ltd, Actavis PLC, Radius Health Inc, GlaxoSmithKline PLC, and Pfizer Inc—collectively account for an estimated xx% of the market in 2025. Market concentration is influenced by factors such as strong patent protection for certain drugs, high R&D investment, and extensive marketing efforts. Innovation is a key driver, with companies continuously investing in developing novel therapies and improving existing treatments. Regulatory frameworks, including FDA approvals and pricing regulations, significantly shape market dynamics. The market also faces competition from alternative treatments and lifestyle modifications. The increasing prevalence of osteoporosis, particularly amongst aging populations, is a key growth driver. Mergers and acquisitions (M&A) activity in the sector has been moderate, with approximately xx M&A deals recorded between 2019 and 2024. These deals primarily focused on expanding product portfolios and market access.
- Market Share: Top 10 companies hold xx% in 2025.
- M&A Activity: Approximately xx deals between 2019-2024.
- Innovation Drivers: Development of novel therapies and improved drug delivery systems.
- Regulatory Landscape: FDA approvals and pricing regulations play a significant role.
Osteoporosis Drugs Industry Industry Trends & Analysis
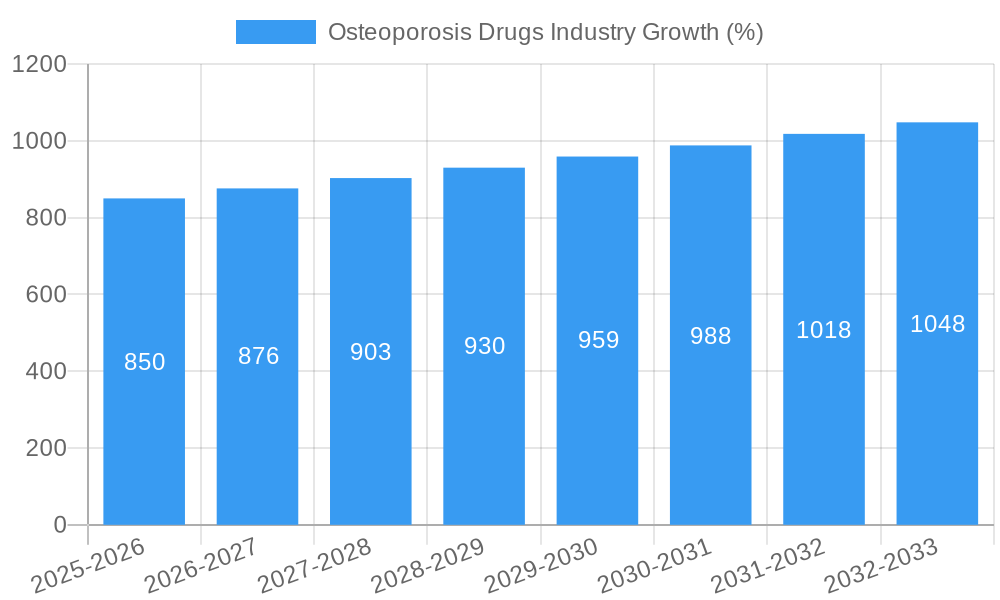
The osteoporosis drugs market is witnessing robust growth, driven by factors such as the rising prevalence of osteoporosis globally, particularly among aging populations. The market is estimated to exhibit a CAGR of xx% during the forecast period (2025-2033). This growth is further fueled by increased awareness regarding osteoporosis, improved diagnostic capabilities, and the launch of newer, more effective medications. Technological advancements, such as the development of biosimilars and targeted therapies, are also contributing to market expansion. Consumer preferences are shifting towards minimally invasive treatments with fewer side effects. The competitive landscape is highly dynamic, with existing players continuously striving for innovation and new market entrants seeking to establish a foothold. Market penetration of new therapies is driven by clinical trial success and subsequent regulatory approvals.
- CAGR (2025-2033): xx%
- Market Penetration: Driven by successful clinical trials and regulatory approvals.
Leading Markets & Segments in Osteoporosis Drugs Industry
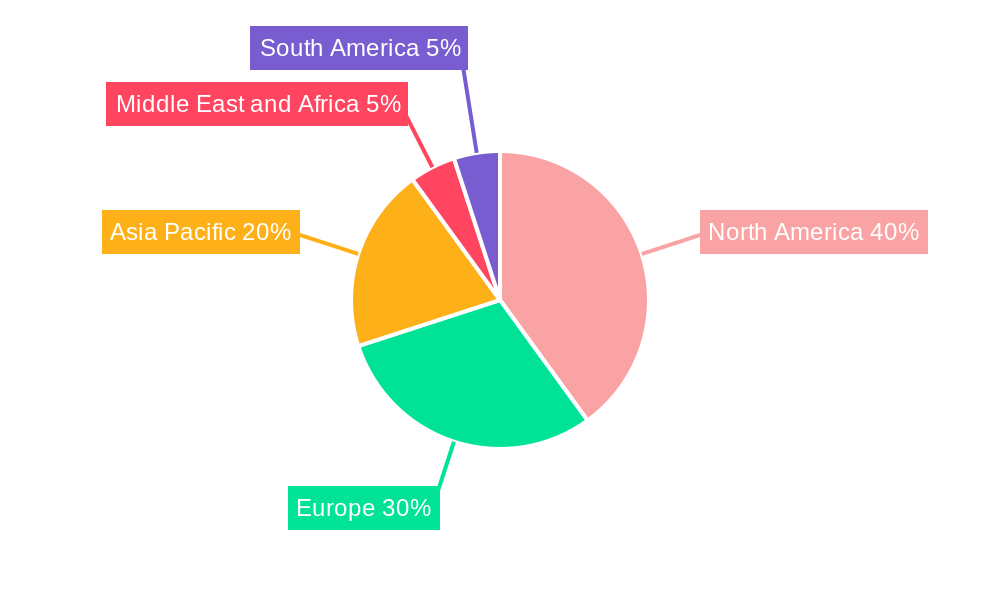
The North American region currently dominates the osteoporosis drugs market, followed by Europe and Asia-Pacific. Within drug types, bisphosphonates hold the largest market share in 2025, owing to their widespread use and established efficacy. However, parathyroid hormone therapy is gaining traction due to its superior efficacy and increasing adoption. In terms of application, primary osteoporosis accounts for a larger market segment compared to secondary osteoporosis.
Key Drivers:
- North America: High healthcare expenditure, aging population, and advanced healthcare infrastructure.
- Europe: High prevalence of osteoporosis and robust healthcare systems.
- Asia-Pacific: Rapidly growing elderly population and increasing healthcare awareness.
Dominance Analysis:
- Bisphosphonates: Largest market share due to established efficacy and widespread use.
- Parathyroid Hormone Therapy: Growing rapidly due to superior efficacy and increasing adoption.
- Primary Osteoporosis: Larger market segment compared to secondary osteoporosis.
Osteoporosis Drugs Industry Product Developments
Recent product developments focus on improving efficacy, reducing side effects, and enhancing patient compliance. This includes the development of biosimilars, offering more cost-effective alternatives to branded drugs. Technological advancements in drug delivery systems are also impacting the market, enabling more targeted therapies and improved patient outcomes. The focus on patient-centric care is driving the development of innovative solutions that enhance adherence and improve quality of life.
Key Drivers of Osteoporosis Drugs Industry Growth
Several factors drive the growth of the osteoporosis drugs market, including:
- Rising Prevalence of Osteoporosis: The aging global population is a major driver.
- Technological Advancements: Development of novel therapies and improved drug delivery systems.
- Increased Healthcare Expenditure: Higher spending on healthcare fuels market growth in developed nations.
- Regulatory Approvals: Successful clinical trials and regulatory approvals facilitate market entry for new drugs.
Challenges in the Osteoporosis Drugs Industry Market
The osteoporosis drugs market faces several challenges, including:
- High Drug Prices: Cost of treatment can be prohibitive for some patients.
- Side Effects: Some drugs have significant side effects, impacting patient compliance.
- Generic Competition: Entry of generic drugs erodes market share for branded products.
- Regulatory Hurdles: Stringent regulatory approvals and lengthy clinical trials increase the cost and time to market.
Emerging Opportunities in Osteoporosis Drugs Industry
Significant opportunities exist in the osteoporosis drugs market. These include:
- Development of Novel Therapies: Targeting specific disease mechanisms to improve efficacy and safety.
- Biosimilar Development: Providing cost-effective alternatives to branded drugs.
- Personalized Medicine: Tailoring treatments based on individual patient characteristics.
- Expansion into Emerging Markets: Reaching underserved populations in developing countries.
Leading Players in the Osteoporosis Drugs Industry Sector
- Eli Lily and Company
- Amgen Inc
- Novartis International AG
- Merck & Co Inc
- F Hoffmann La Roche
- Teva Pharmaceutical Industries Ltd
- Actavis PLC
- Radius Health Inc
- GlaxoSmithKline PLC
- Pfizer Inc
Key Milestones in Osteoporosis Drugs Industry Industry
- August 2021: Enzene Biosciences Ltd received Marketing Authorization (MA) from the Drug Controller General of India (DCGI) for its biosimilar drug, denosumab.
- January 2021: Theramex launched the osteoporosis medicine Livogiva in Europe.
Strategic Outlook for Osteoporosis Drugs Industry Market
The osteoporosis drugs market is poised for continued growth, driven by factors such as the aging global population, technological advancements, and increased healthcare spending. Strategic opportunities lie in developing innovative therapies, expanding into emerging markets, and forming strategic partnerships to enhance market access and competitiveness. Focusing on personalized medicine and improving patient compliance will further strengthen market position. The market is expected to witness continued consolidation as companies pursue acquisitions to expand their product portfolios and achieve economies of scale.
Osteoporosis Drugs Industry Segmentation
-
1. Drug Type
- 1.1. Parathyroid Hormone Therapy
- 1.2. Bisphosphonates
- 1.3. Calcitonin
- 1.4. RANKL Inhibitors
- 1.5. Other Drug Types
-
2. Application
- 2.1. Primary Osteoporosis
- 2.2. Secondary Osteoporosis
Osteoporosis Drugs Industry Segmentation By Geography
-
1. North America
- 1.1. United States
- 1.2. Canada
- 1.3. Mexico
-
2. Europe
- 2.1. Germany
- 2.2. United Kingdom
- 2.3. France
- 2.4. Italy
- 2.5. Spain
- 2.6. Rest of Europe
-
3. Asia Pacific
- 3.1. China
- 3.2. Japan
- 3.3. India
- 3.4. Australia
- 3.5. South Korea
- 3.6. Rest of Asia Pacific
-
4. Middle East and Africa
- 4.1. GCC
- 4.2. South Africa
- 4.3. Rest of Middle East and Africa
-
5. South America
- 5.1. Brazil
- 5.2. Argentina
- 5.3. Rest of South America
Osteoporosis Drugs Industry REPORT HIGHLIGHTS
| Aspects | Details |
|---|---|
| Study Period | 2019-2033 |
| Base Year | 2024 |
| Estimated Year | 2025 |
| Forecast Period | 2025-2033 |
| Historical Period | 2019-2024 |
| Growth Rate | CAGR of 3.40% from 2019-2033 |
| Segmentation |
|
Table of Contents
- 1. Introduction
- 1.1. Research Scope
- 1.2. Market Segmentation
- 1.3. Research Methodology
- 1.4. Definitions and Assumptions
- 2. Executive Summary
- 2.1. Introduction
- 3. Market Dynamics
- 3.1. Introduction
- 3.2. Market Drivers
- 3.2.1. Increasing Incidences of Osteoporosis; Rise in the Geriatric Populations
- 3.3. Market Restrains
- 3.3.1. Stringent Regulatory Environment
- 3.4. Market Trends
- 3.4.1. The RANK Ligand Inhibitors Segment is Expected to Dominate the Market Over the Forecast Period
- 4. Market Factor Analysis
- 4.1. Porters Five Forces
- 4.2. Supply/Value Chain
- 4.3. PESTEL analysis
- 4.4. Market Entropy
- 4.5. Patent/Trademark Analysis
- 5. Global Osteoporosis Drugs Industry Analysis, Insights and Forecast, 2019-2031
- 5.1. Market Analysis, Insights and Forecast - by Drug Type
- 5.1.1. Parathyroid Hormone Therapy
- 5.1.2. Bisphosphonates
- 5.1.3. Calcitonin
- 5.1.4. RANKL Inhibitors
- 5.1.5. Other Drug Types
- 5.2. Market Analysis, Insights and Forecast - by Application
- 5.2.1. Primary Osteoporosis
- 5.2.2. Secondary Osteoporosis
- 5.3. Market Analysis, Insights and Forecast - by Region
- 5.3.1. North America
- 5.3.2. Europe
- 5.3.3. Asia Pacific
- 5.3.4. Middle East and Africa
- 5.3.5. South America
- 5.1. Market Analysis, Insights and Forecast - by Drug Type
- 6. North America Osteoporosis Drugs Industry Analysis, Insights and Forecast, 2019-2031
- 6.1. Market Analysis, Insights and Forecast - by Drug Type
- 6.1.1. Parathyroid Hormone Therapy
- 6.1.2. Bisphosphonates
- 6.1.3. Calcitonin
- 6.1.4. RANKL Inhibitors
- 6.1.5. Other Drug Types
- 6.2. Market Analysis, Insights and Forecast - by Application
- 6.2.1. Primary Osteoporosis
- 6.2.2. Secondary Osteoporosis
- 6.1. Market Analysis, Insights and Forecast - by Drug Type
- 7. Europe Osteoporosis Drugs Industry Analysis, Insights and Forecast, 2019-2031
- 7.1. Market Analysis, Insights and Forecast - by Drug Type
- 7.1.1. Parathyroid Hormone Therapy
- 7.1.2. Bisphosphonates
- 7.1.3. Calcitonin
- 7.1.4. RANKL Inhibitors
- 7.1.5. Other Drug Types
- 7.2. Market Analysis, Insights and Forecast - by Application
- 7.2.1. Primary Osteoporosis
- 7.2.2. Secondary Osteoporosis
- 7.1. Market Analysis, Insights and Forecast - by Drug Type
- 8. Asia Pacific Osteoporosis Drugs Industry Analysis, Insights and Forecast, 2019-2031
- 8.1. Market Analysis, Insights and Forecast - by Drug Type
- 8.1.1. Parathyroid Hormone Therapy
- 8.1.2. Bisphosphonates
- 8.1.3. Calcitonin
- 8.1.4. RANKL Inhibitors
- 8.1.5. Other Drug Types
- 8.2. Market Analysis, Insights and Forecast - by Application
- 8.2.1. Primary Osteoporosis
- 8.2.2. Secondary Osteoporosis
- 8.1. Market Analysis, Insights and Forecast - by Drug Type
- 9. Middle East and Africa Osteoporosis Drugs Industry Analysis, Insights and Forecast, 2019-2031
- 9.1. Market Analysis, Insights and Forecast - by Drug Type
- 9.1.1. Parathyroid Hormone Therapy
- 9.1.2. Bisphosphonates
- 9.1.3. Calcitonin
- 9.1.4. RANKL Inhibitors
- 9.1.5. Other Drug Types
- 9.2. Market Analysis, Insights and Forecast - by Application
- 9.2.1. Primary Osteoporosis
- 9.2.2. Secondary Osteoporosis
- 9.1. Market Analysis, Insights and Forecast - by Drug Type
- 10. South America Osteoporosis Drugs Industry Analysis, Insights and Forecast, 2019-2031
- 10.1. Market Analysis, Insights and Forecast - by Drug Type
- 10.1.1. Parathyroid Hormone Therapy
- 10.1.2. Bisphosphonates
- 10.1.3. Calcitonin
- 10.1.4. RANKL Inhibitors
- 10.1.5. Other Drug Types
- 10.2. Market Analysis, Insights and Forecast - by Application
- 10.2.1. Primary Osteoporosis
- 10.2.2. Secondary Osteoporosis
- 10.1. Market Analysis, Insights and Forecast - by Drug Type
- 11. North America Osteoporosis Drugs Industry Analysis, Insights and Forecast, 2019-2031
- 11.1. Market Analysis, Insights and Forecast - By Country/Sub-region
- 11.1.1 United States
- 11.1.2 Canada
- 11.1.3 Mexico
- 12. Europe Osteoporosis Drugs Industry Analysis, Insights and Forecast, 2019-2031
- 12.1. Market Analysis, Insights and Forecast - By Country/Sub-region
- 12.1.1 Germany
- 12.1.2 United Kingdom
- 12.1.3 France
- 12.1.4 Italy
- 12.1.5 Spain
- 12.1.6 Rest of Europe
- 13. Asia Pacific Osteoporosis Drugs Industry Analysis, Insights and Forecast, 2019-2031
- 13.1. Market Analysis, Insights and Forecast - By Country/Sub-region
- 13.1.1 China
- 13.1.2 Japan
- 13.1.3 India
- 13.1.4 Australia
- 13.1.5 South Korea
- 13.1.6 Rest of Asia Pacific
- 14. Middle East and Africa Osteoporosis Drugs Industry Analysis, Insights and Forecast, 2019-2031
- 14.1. Market Analysis, Insights and Forecast - By Country/Sub-region
- 14.1.1 GCC
- 14.1.2 South Africa
- 14.1.3 Rest of Middle East and Africa
- 15. South America Osteoporosis Drugs Industry Analysis, Insights and Forecast, 2019-2031
- 15.1. Market Analysis, Insights and Forecast - By Country/Sub-region
- 15.1.1 Brazil
- 15.1.2 Argentina
- 15.1.3 Rest of South America
- 16. Competitive Analysis
- 16.1. Global Market Share Analysis 2024
- 16.2. Company Profiles
- 16.2.1 Eli Lily and Company
- 16.2.1.1. Overview
- 16.2.1.2. Products
- 16.2.1.3. SWOT Analysis
- 16.2.1.4. Recent Developments
- 16.2.1.5. Financials (Based on Availability)
- 16.2.2 Amgen Inc
- 16.2.2.1. Overview
- 16.2.2.2. Products
- 16.2.2.3. SWOT Analysis
- 16.2.2.4. Recent Developments
- 16.2.2.5. Financials (Based on Availability)
- 16.2.3 Novartis International AG
- 16.2.3.1. Overview
- 16.2.3.2. Products
- 16.2.3.3. SWOT Analysis
- 16.2.3.4. Recent Developments
- 16.2.3.5. Financials (Based on Availability)
- 16.2.4 Merck & Co Inc
- 16.2.4.1. Overview
- 16.2.4.2. Products
- 16.2.4.3. SWOT Analysis
- 16.2.4.4. Recent Developments
- 16.2.4.5. Financials (Based on Availability)
- 16.2.5 F Hoffmann La Roche
- 16.2.5.1. Overview
- 16.2.5.2. Products
- 16.2.5.3. SWOT Analysis
- 16.2.5.4. Recent Developments
- 16.2.5.5. Financials (Based on Availability)
- 16.2.6 Teva Pharmaceutical Industries Ltd
- 16.2.6.1. Overview
- 16.2.6.2. Products
- 16.2.6.3. SWOT Analysis
- 16.2.6.4. Recent Developments
- 16.2.6.5. Financials (Based on Availability)
- 16.2.7 Actavis PLC
- 16.2.7.1. Overview
- 16.2.7.2. Products
- 16.2.7.3. SWOT Analysis
- 16.2.7.4. Recent Developments
- 16.2.7.5. Financials (Based on Availability)
- 16.2.8 Radius Health Inc
- 16.2.8.1. Overview
- 16.2.8.2. Products
- 16.2.8.3. SWOT Analysis
- 16.2.8.4. Recent Developments
- 16.2.8.5. Financials (Based on Availability)
- 16.2.9 GlaxoSmithKline PLC
- 16.2.9.1. Overview
- 16.2.9.2. Products
- 16.2.9.3. SWOT Analysis
- 16.2.9.4. Recent Developments
- 16.2.9.5. Financials (Based on Availability)
- 16.2.10 Pfizer Inc
- 16.2.10.1. Overview
- 16.2.10.2. Products
- 16.2.10.3. SWOT Analysis
- 16.2.10.4. Recent Developments
- 16.2.10.5. Financials (Based on Availability)
- 16.2.1 Eli Lily and Company
List of Figures
- Figure 1: Global Osteoporosis Drugs Industry Revenue Breakdown (Million, %) by Region 2024 & 2032
- Figure 2: Global Osteoporosis Drugs Industry Volume Breakdown (K Unit, %) by Region 2024 & 2032
- Figure 3: North America Osteoporosis Drugs Industry Revenue (Million), by Country 2024 & 2032
- Figure 4: North America Osteoporosis Drugs Industry Volume (K Unit), by Country 2024 & 2032
- Figure 5: North America Osteoporosis Drugs Industry Revenue Share (%), by Country 2024 & 2032
- Figure 6: North America Osteoporosis Drugs Industry Volume Share (%), by Country 2024 & 2032
- Figure 7: Europe Osteoporosis Drugs Industry Revenue (Million), by Country 2024 & 2032
- Figure 8: Europe Osteoporosis Drugs Industry Volume (K Unit), by Country 2024 & 2032
- Figure 9: Europe Osteoporosis Drugs Industry Revenue Share (%), by Country 2024 & 2032
- Figure 10: Europe Osteoporosis Drugs Industry Volume Share (%), by Country 2024 & 2032
- Figure 11: Asia Pacific Osteoporosis Drugs Industry Revenue (Million), by Country 2024 & 2032
- Figure 12: Asia Pacific Osteoporosis Drugs Industry Volume (K Unit), by Country 2024 & 2032
- Figure 13: Asia Pacific Osteoporosis Drugs Industry Revenue Share (%), by Country 2024 & 2032
- Figure 14: Asia Pacific Osteoporosis Drugs Industry Volume Share (%), by Country 2024 & 2032
- Figure 15: Middle East and Africa Osteoporosis Drugs Industry Revenue (Million), by Country 2024 & 2032
- Figure 16: Middle East and Africa Osteoporosis Drugs Industry Volume (K Unit), by Country 2024 & 2032
- Figure 17: Middle East and Africa Osteoporosis Drugs Industry Revenue Share (%), by Country 2024 & 2032
- Figure 18: Middle East and Africa Osteoporosis Drugs Industry Volume Share (%), by Country 2024 & 2032
- Figure 19: South America Osteoporosis Drugs Industry Revenue (Million), by Country 2024 & 2032
- Figure 20: South America Osteoporosis Drugs Industry Volume (K Unit), by Country 2024 & 2032
- Figure 21: South America Osteoporosis Drugs Industry Revenue Share (%), by Country 2024 & 2032
- Figure 22: South America Osteoporosis Drugs Industry Volume Share (%), by Country 2024 & 2032
- Figure 23: North America Osteoporosis Drugs Industry Revenue (Million), by Drug Type 2024 & 2032
- Figure 24: North America Osteoporosis Drugs Industry Volume (K Unit), by Drug Type 2024 & 2032
- Figure 25: North America Osteoporosis Drugs Industry Revenue Share (%), by Drug Type 2024 & 2032
- Figure 26: North America Osteoporosis Drugs Industry Volume Share (%), by Drug Type 2024 & 2032
- Figure 27: North America Osteoporosis Drugs Industry Revenue (Million), by Application 2024 & 2032
- Figure 28: North America Osteoporosis Drugs Industry Volume (K Unit), by Application 2024 & 2032
- Figure 29: North America Osteoporosis Drugs Industry Revenue Share (%), by Application 2024 & 2032
- Figure 30: North America Osteoporosis Drugs Industry Volume Share (%), by Application 2024 & 2032
- Figure 31: North America Osteoporosis Drugs Industry Revenue (Million), by Country 2024 & 2032
- Figure 32: North America Osteoporosis Drugs Industry Volume (K Unit), by Country 2024 & 2032
- Figure 33: North America Osteoporosis Drugs Industry Revenue Share (%), by Country 2024 & 2032
- Figure 34: North America Osteoporosis Drugs Industry Volume Share (%), by Country 2024 & 2032
- Figure 35: Europe Osteoporosis Drugs Industry Revenue (Million), by Drug Type 2024 & 2032
- Figure 36: Europe Osteoporosis Drugs Industry Volume (K Unit), by Drug Type 2024 & 2032
- Figure 37: Europe Osteoporosis Drugs Industry Revenue Share (%), by Drug Type 2024 & 2032
- Figure 38: Europe Osteoporosis Drugs Industry Volume Share (%), by Drug Type 2024 & 2032
- Figure 39: Europe Osteoporosis Drugs Industry Revenue (Million), by Application 2024 & 2032
- Figure 40: Europe Osteoporosis Drugs Industry Volume (K Unit), by Application 2024 & 2032
- Figure 41: Europe Osteoporosis Drugs Industry Revenue Share (%), by Application 2024 & 2032
- Figure 42: Europe Osteoporosis Drugs Industry Volume Share (%), by Application 2024 & 2032
- Figure 43: Europe Osteoporosis Drugs Industry Revenue (Million), by Country 2024 & 2032
- Figure 44: Europe Osteoporosis Drugs Industry Volume (K Unit), by Country 2024 & 2032
- Figure 45: Europe Osteoporosis Drugs Industry Revenue Share (%), by Country 2024 & 2032
- Figure 46: Europe Osteoporosis Drugs Industry Volume Share (%), by Country 2024 & 2032
- Figure 47: Asia Pacific Osteoporosis Drugs Industry Revenue (Million), by Drug Type 2024 & 2032
- Figure 48: Asia Pacific Osteoporosis Drugs Industry Volume (K Unit), by Drug Type 2024 & 2032
- Figure 49: Asia Pacific Osteoporosis Drugs Industry Revenue Share (%), by Drug Type 2024 & 2032
- Figure 50: Asia Pacific Osteoporosis Drugs Industry Volume Share (%), by Drug Type 2024 & 2032
- Figure 51: Asia Pacific Osteoporosis Drugs Industry Revenue (Million), by Application 2024 & 2032
- Figure 52: Asia Pacific Osteoporosis Drugs Industry Volume (K Unit), by Application 2024 & 2032
- Figure 53: Asia Pacific Osteoporosis Drugs Industry Revenue Share (%), by Application 2024 & 2032
- Figure 54: Asia Pacific Osteoporosis Drugs Industry Volume Share (%), by Application 2024 & 2032
- Figure 55: Asia Pacific Osteoporosis Drugs Industry Revenue (Million), by Country 2024 & 2032
- Figure 56: Asia Pacific Osteoporosis Drugs Industry Volume (K Unit), by Country 2024 & 2032
- Figure 57: Asia Pacific Osteoporosis Drugs Industry Revenue Share (%), by Country 2024 & 2032
- Figure 58: Asia Pacific Osteoporosis Drugs Industry Volume Share (%), by Country 2024 & 2032
- Figure 59: Middle East and Africa Osteoporosis Drugs Industry Revenue (Million), by Drug Type 2024 & 2032
- Figure 60: Middle East and Africa Osteoporosis Drugs Industry Volume (K Unit), by Drug Type 2024 & 2032
- Figure 61: Middle East and Africa Osteoporosis Drugs Industry Revenue Share (%), by Drug Type 2024 & 2032
- Figure 62: Middle East and Africa Osteoporosis Drugs Industry Volume Share (%), by Drug Type 2024 & 2032
- Figure 63: Middle East and Africa Osteoporosis Drugs Industry Revenue (Million), by Application 2024 & 2032
- Figure 64: Middle East and Africa Osteoporosis Drugs Industry Volume (K Unit), by Application 2024 & 2032
- Figure 65: Middle East and Africa Osteoporosis Drugs Industry Revenue Share (%), by Application 2024 & 2032
- Figure 66: Middle East and Africa Osteoporosis Drugs Industry Volume Share (%), by Application 2024 & 2032
- Figure 67: Middle East and Africa Osteoporosis Drugs Industry Revenue (Million), by Country 2024 & 2032
- Figure 68: Middle East and Africa Osteoporosis Drugs Industry Volume (K Unit), by Country 2024 & 2032
- Figure 69: Middle East and Africa Osteoporosis Drugs Industry Revenue Share (%), by Country 2024 & 2032
- Figure 70: Middle East and Africa Osteoporosis Drugs Industry Volume Share (%), by Country 2024 & 2032
- Figure 71: South America Osteoporosis Drugs Industry Revenue (Million), by Drug Type 2024 & 2032
- Figure 72: South America Osteoporosis Drugs Industry Volume (K Unit), by Drug Type 2024 & 2032
- Figure 73: South America Osteoporosis Drugs Industry Revenue Share (%), by Drug Type 2024 & 2032
- Figure 74: South America Osteoporosis Drugs Industry Volume Share (%), by Drug Type 2024 & 2032
- Figure 75: South America Osteoporosis Drugs Industry Revenue (Million), by Application 2024 & 2032
- Figure 76: South America Osteoporosis Drugs Industry Volume (K Unit), by Application 2024 & 2032
- Figure 77: South America Osteoporosis Drugs Industry Revenue Share (%), by Application 2024 & 2032
- Figure 78: South America Osteoporosis Drugs Industry Volume Share (%), by Application 2024 & 2032
- Figure 79: South America Osteoporosis Drugs Industry Revenue (Million), by Country 2024 & 2032
- Figure 80: South America Osteoporosis Drugs Industry Volume (K Unit), by Country 2024 & 2032
- Figure 81: South America Osteoporosis Drugs Industry Revenue Share (%), by Country 2024 & 2032
- Figure 82: South America Osteoporosis Drugs Industry Volume Share (%), by Country 2024 & 2032
List of Tables
- Table 1: Global Osteoporosis Drugs Industry Revenue Million Forecast, by Region 2019 & 2032
- Table 2: Global Osteoporosis Drugs Industry Volume K Unit Forecast, by Region 2019 & 2032
- Table 3: Global Osteoporosis Drugs Industry Revenue Million Forecast, by Drug Type 2019 & 2032
- Table 4: Global Osteoporosis Drugs Industry Volume K Unit Forecast, by Drug Type 2019 & 2032
- Table 5: Global Osteoporosis Drugs Industry Revenue Million Forecast, by Application 2019 & 2032
- Table 6: Global Osteoporosis Drugs Industry Volume K Unit Forecast, by Application 2019 & 2032
- Table 7: Global Osteoporosis Drugs Industry Revenue Million Forecast, by Region 2019 & 2032
- Table 8: Global Osteoporosis Drugs Industry Volume K Unit Forecast, by Region 2019 & 2032
- Table 9: Global Osteoporosis Drugs Industry Revenue Million Forecast, by Country 2019 & 2032
- Table 10: Global Osteoporosis Drugs Industry Volume K Unit Forecast, by Country 2019 & 2032
- Table 11: United States Osteoporosis Drugs Industry Revenue (Million) Forecast, by Application 2019 & 2032
- Table 12: United States Osteoporosis Drugs Industry Volume (K Unit) Forecast, by Application 2019 & 2032
- Table 13: Canada Osteoporosis Drugs Industry Revenue (Million) Forecast, by Application 2019 & 2032
- Table 14: Canada Osteoporosis Drugs Industry Volume (K Unit) Forecast, by Application 2019 & 2032
- Table 15: Mexico Osteoporosis Drugs Industry Revenue (Million) Forecast, by Application 2019 & 2032
- Table 16: Mexico Osteoporosis Drugs Industry Volume (K Unit) Forecast, by Application 2019 & 2032
- Table 17: Global Osteoporosis Drugs Industry Revenue Million Forecast, by Country 2019 & 2032
- Table 18: Global Osteoporosis Drugs Industry Volume K Unit Forecast, by Country 2019 & 2032
- Table 19: Germany Osteoporosis Drugs Industry Revenue (Million) Forecast, by Application 2019 & 2032
- Table 20: Germany Osteoporosis Drugs Industry Volume (K Unit) Forecast, by Application 2019 & 2032
- Table 21: United Kingdom Osteoporosis Drugs Industry Revenue (Million) Forecast, by Application 2019 & 2032
- Table 22: United Kingdom Osteoporosis Drugs Industry Volume (K Unit) Forecast, by Application 2019 & 2032
- Table 23: France Osteoporosis Drugs Industry Revenue (Million) Forecast, by Application 2019 & 2032
- Table 24: France Osteoporosis Drugs Industry Volume (K Unit) Forecast, by Application 2019 & 2032
- Table 25: Italy Osteoporosis Drugs Industry Revenue (Million) Forecast, by Application 2019 & 2032
- Table 26: Italy Osteoporosis Drugs Industry Volume (K Unit) Forecast, by Application 2019 & 2032
- Table 27: Spain Osteoporosis Drugs Industry Revenue (Million) Forecast, by Application 2019 & 2032
- Table 28: Spain Osteoporosis Drugs Industry Volume (K Unit) Forecast, by Application 2019 & 2032
- Table 29: Rest of Europe Osteoporosis Drugs Industry Revenue (Million) Forecast, by Application 2019 & 2032
- Table 30: Rest of Europe Osteoporosis Drugs Industry Volume (K Unit) Forecast, by Application 2019 & 2032
- Table 31: Global Osteoporosis Drugs Industry Revenue Million Forecast, by Country 2019 & 2032
- Table 32: Global Osteoporosis Drugs Industry Volume K Unit Forecast, by Country 2019 & 2032
- Table 33: China Osteoporosis Drugs Industry Revenue (Million) Forecast, by Application 2019 & 2032
- Table 34: China Osteoporosis Drugs Industry Volume (K Unit) Forecast, by Application 2019 & 2032
- Table 35: Japan Osteoporosis Drugs Industry Revenue (Million) Forecast, by Application 2019 & 2032
- Table 36: Japan Osteoporosis Drugs Industry Volume (K Unit) Forecast, by Application 2019 & 2032
- Table 37: India Osteoporosis Drugs Industry Revenue (Million) Forecast, by Application 2019 & 2032
- Table 38: India Osteoporosis Drugs Industry Volume (K Unit) Forecast, by Application 2019 & 2032
- Table 39: Australia Osteoporosis Drugs Industry Revenue (Million) Forecast, by Application 2019 & 2032
- Table 40: Australia Osteoporosis Drugs Industry Volume (K Unit) Forecast, by Application 2019 & 2032
- Table 41: South Korea Osteoporosis Drugs Industry Revenue (Million) Forecast, by Application 2019 & 2032
- Table 42: South Korea Osteoporosis Drugs Industry Volume (K Unit) Forecast, by Application 2019 & 2032
- Table 43: Rest of Asia Pacific Osteoporosis Drugs Industry Revenue (Million) Forecast, by Application 2019 & 2032
- Table 44: Rest of Asia Pacific Osteoporosis Drugs Industry Volume (K Unit) Forecast, by Application 2019 & 2032
- Table 45: Global Osteoporosis Drugs Industry Revenue Million Forecast, by Country 2019 & 2032
- Table 46: Global Osteoporosis Drugs Industry Volume K Unit Forecast, by Country 2019 & 2032
- Table 47: GCC Osteoporosis Drugs Industry Revenue (Million) Forecast, by Application 2019 & 2032
- Table 48: GCC Osteoporosis Drugs Industry Volume (K Unit) Forecast, by Application 2019 & 2032
- Table 49: South Africa Osteoporosis Drugs Industry Revenue (Million) Forecast, by Application 2019 & 2032
- Table 50: South Africa Osteoporosis Drugs Industry Volume (K Unit) Forecast, by Application 2019 & 2032
- Table 51: Rest of Middle East and Africa Osteoporosis Drugs Industry Revenue (Million) Forecast, by Application 2019 & 2032
- Table 52: Rest of Middle East and Africa Osteoporosis Drugs Industry Volume (K Unit) Forecast, by Application 2019 & 2032
- Table 53: Global Osteoporosis Drugs Industry Revenue Million Forecast, by Country 2019 & 2032
- Table 54: Global Osteoporosis Drugs Industry Volume K Unit Forecast, by Country 2019 & 2032
- Table 55: Brazil Osteoporosis Drugs Industry Revenue (Million) Forecast, by Application 2019 & 2032
- Table 56: Brazil Osteoporosis Drugs Industry Volume (K Unit) Forecast, by Application 2019 & 2032
- Table 57: Argentina Osteoporosis Drugs Industry Revenue (Million) Forecast, by Application 2019 & 2032
- Table 58: Argentina Osteoporosis Drugs Industry Volume (K Unit) Forecast, by Application 2019 & 2032
- Table 59: Rest of South America Osteoporosis Drugs Industry Revenue (Million) Forecast, by Application 2019 & 2032
- Table 60: Rest of South America Osteoporosis Drugs Industry Volume (K Unit) Forecast, by Application 2019 & 2032
- Table 61: Global Osteoporosis Drugs Industry Revenue Million Forecast, by Drug Type 2019 & 2032
- Table 62: Global Osteoporosis Drugs Industry Volume K Unit Forecast, by Drug Type 2019 & 2032
- Table 63: Global Osteoporosis Drugs Industry Revenue Million Forecast, by Application 2019 & 2032
- Table 64: Global Osteoporosis Drugs Industry Volume K Unit Forecast, by Application 2019 & 2032
- Table 65: Global Osteoporosis Drugs Industry Revenue Million Forecast, by Country 2019 & 2032
- Table 66: Global Osteoporosis Drugs Industry Volume K Unit Forecast, by Country 2019 & 2032
- Table 67: United States Osteoporosis Drugs Industry Revenue (Million) Forecast, by Application 2019 & 2032
- Table 68: United States Osteoporosis Drugs Industry Volume (K Unit) Forecast, by Application 2019 & 2032
- Table 69: Canada Osteoporosis Drugs Industry Revenue (Million) Forecast, by Application 2019 & 2032
- Table 70: Canada Osteoporosis Drugs Industry Volume (K Unit) Forecast, by Application 2019 & 2032
- Table 71: Mexico Osteoporosis Drugs Industry Revenue (Million) Forecast, by Application 2019 & 2032
- Table 72: Mexico Osteoporosis Drugs Industry Volume (K Unit) Forecast, by Application 2019 & 2032
- Table 73: Global Osteoporosis Drugs Industry Revenue Million Forecast, by Drug Type 2019 & 2032
- Table 74: Global Osteoporosis Drugs Industry Volume K Unit Forecast, by Drug Type 2019 & 2032
- Table 75: Global Osteoporosis Drugs Industry Revenue Million Forecast, by Application 2019 & 2032
- Table 76: Global Osteoporosis Drugs Industry Volume K Unit Forecast, by Application 2019 & 2032
- Table 77: Global Osteoporosis Drugs Industry Revenue Million Forecast, by Country 2019 & 2032
- Table 78: Global Osteoporosis Drugs Industry Volume K Unit Forecast, by Country 2019 & 2032
- Table 79: Germany Osteoporosis Drugs Industry Revenue (Million) Forecast, by Application 2019 & 2032
- Table 80: Germany Osteoporosis Drugs Industry Volume (K Unit) Forecast, by Application 2019 & 2032
- Table 81: United Kingdom Osteoporosis Drugs Industry Revenue (Million) Forecast, by Application 2019 & 2032
- Table 82: United Kingdom Osteoporosis Drugs Industry Volume (K Unit) Forecast, by Application 2019 & 2032
- Table 83: France Osteoporosis Drugs Industry Revenue (Million) Forecast, by Application 2019 & 2032
- Table 84: France Osteoporosis Drugs Industry Volume (K Unit) Forecast, by Application 2019 & 2032
- Table 85: Italy Osteoporosis Drugs Industry Revenue (Million) Forecast, by Application 2019 & 2032
- Table 86: Italy Osteoporosis Drugs Industry Volume (K Unit) Forecast, by Application 2019 & 2032
- Table 87: Spain Osteoporosis Drugs Industry Revenue (Million) Forecast, by Application 2019 & 2032
- Table 88: Spain Osteoporosis Drugs Industry Volume (K Unit) Forecast, by Application 2019 & 2032
- Table 89: Rest of Europe Osteoporosis Drugs Industry Revenue (Million) Forecast, by Application 2019 & 2032
- Table 90: Rest of Europe Osteoporosis Drugs Industry Volume (K Unit) Forecast, by Application 2019 & 2032
- Table 91: Global Osteoporosis Drugs Industry Revenue Million Forecast, by Drug Type 2019 & 2032
- Table 92: Global Osteoporosis Drugs Industry Volume K Unit Forecast, by Drug Type 2019 & 2032
- Table 93: Global Osteoporosis Drugs Industry Revenue Million Forecast, by Application 2019 & 2032
- Table 94: Global Osteoporosis Drugs Industry Volume K Unit Forecast, by Application 2019 & 2032
- Table 95: Global Osteoporosis Drugs Industry Revenue Million Forecast, by Country 2019 & 2032
- Table 96: Global Osteoporosis Drugs Industry Volume K Unit Forecast, by Country 2019 & 2032
- Table 97: China Osteoporosis Drugs Industry Revenue (Million) Forecast, by Application 2019 & 2032
- Table 98: China Osteoporosis Drugs Industry Volume (K Unit) Forecast, by Application 2019 & 2032
- Table 99: Japan Osteoporosis Drugs Industry Revenue (Million) Forecast, by Application 2019 & 2032
- Table 100: Japan Osteoporosis Drugs Industry Volume (K Unit) Forecast, by Application 2019 & 2032
- Table 101: India Osteoporosis Drugs Industry Revenue (Million) Forecast, by Application 2019 & 2032
- Table 102: India Osteoporosis Drugs Industry Volume (K Unit) Forecast, by Application 2019 & 2032
- Table 103: Australia Osteoporosis Drugs Industry Revenue (Million) Forecast, by Application 2019 & 2032
- Table 104: Australia Osteoporosis Drugs Industry Volume (K Unit) Forecast, by Application 2019 & 2032
- Table 105: South Korea Osteoporosis Drugs Industry Revenue (Million) Forecast, by Application 2019 & 2032
- Table 106: South Korea Osteoporosis Drugs Industry Volume (K Unit) Forecast, by Application 2019 & 2032
- Table 107: Rest of Asia Pacific Osteoporosis Drugs Industry Revenue (Million) Forecast, by Application 2019 & 2032
- Table 108: Rest of Asia Pacific Osteoporosis Drugs Industry Volume (K Unit) Forecast, by Application 2019 & 2032
- Table 109: Global Osteoporosis Drugs Industry Revenue Million Forecast, by Drug Type 2019 & 2032
- Table 110: Global Osteoporosis Drugs Industry Volume K Unit Forecast, by Drug Type 2019 & 2032
- Table 111: Global Osteoporosis Drugs Industry Revenue Million Forecast, by Application 2019 & 2032
- Table 112: Global Osteoporosis Drugs Industry Volume K Unit Forecast, by Application 2019 & 2032
- Table 113: Global Osteoporosis Drugs Industry Revenue Million Forecast, by Country 2019 & 2032
- Table 114: Global Osteoporosis Drugs Industry Volume K Unit Forecast, by Country 2019 & 2032
- Table 115: GCC Osteoporosis Drugs Industry Revenue (Million) Forecast, by Application 2019 & 2032
- Table 116: GCC Osteoporosis Drugs Industry Volume (K Unit) Forecast, by Application 2019 & 2032
- Table 117: South Africa Osteoporosis Drugs Industry Revenue (Million) Forecast, by Application 2019 & 2032
- Table 118: South Africa Osteoporosis Drugs Industry Volume (K Unit) Forecast, by Application 2019 & 2032
- Table 119: Rest of Middle East and Africa Osteoporosis Drugs Industry Revenue (Million) Forecast, by Application 2019 & 2032
- Table 120: Rest of Middle East and Africa Osteoporosis Drugs Industry Volume (K Unit) Forecast, by Application 2019 & 2032
- Table 121: Global Osteoporosis Drugs Industry Revenue Million Forecast, by Drug Type 2019 & 2032
- Table 122: Global Osteoporosis Drugs Industry Volume K Unit Forecast, by Drug Type 2019 & 2032
- Table 123: Global Osteoporosis Drugs Industry Revenue Million Forecast, by Application 2019 & 2032
- Table 124: Global Osteoporosis Drugs Industry Volume K Unit Forecast, by Application 2019 & 2032
- Table 125: Global Osteoporosis Drugs Industry Revenue Million Forecast, by Country 2019 & 2032
- Table 126: Global Osteoporosis Drugs Industry Volume K Unit Forecast, by Country 2019 & 2032
- Table 127: Brazil Osteoporosis Drugs Industry Revenue (Million) Forecast, by Application 2019 & 2032
- Table 128: Brazil Osteoporosis Drugs Industry Volume (K Unit) Forecast, by Application 2019 & 2032
- Table 129: Argentina Osteoporosis Drugs Industry Revenue (Million) Forecast, by Application 2019 & 2032
- Table 130: Argentina Osteoporosis Drugs Industry Volume (K Unit) Forecast, by Application 2019 & 2032
- Table 131: Rest of South America Osteoporosis Drugs Industry Revenue (Million) Forecast, by Application 2019 & 2032
- Table 132: Rest of South America Osteoporosis Drugs Industry Volume (K Unit) Forecast, by Application 2019 & 2032
Frequently Asked Questions
1. What is the projected Compound Annual Growth Rate (CAGR) of the Osteoporosis Drugs Industry?
The projected CAGR is approximately 3.40%.
2. Which companies are prominent players in the Osteoporosis Drugs Industry?
Key companies in the market include Eli Lily and Company, Amgen Inc, Novartis International AG, Merck & Co Inc, F Hoffmann La Roche, Teva Pharmaceutical Industries Ltd, Actavis PLC, Radius Health Inc, GlaxoSmithKline PLC, Pfizer Inc.
3. What are the main segments of the Osteoporosis Drugs Industry?
The market segments include Drug Type, Application.
4. Can you provide details about the market size?
The market size is estimated to be USD XX Million as of 2022.
5. What are some drivers contributing to market growth?
Increasing Incidences of Osteoporosis; Rise in the Geriatric Populations.
6. What are the notable trends driving market growth?
The RANK Ligand Inhibitors Segment is Expected to Dominate the Market Over the Forecast Period.
7. Are there any restraints impacting market growth?
Stringent Regulatory Environment.
8. Can you provide examples of recent developments in the market?
In August 2021, Enzene Biosciences Ltd received Marketing Authorization (MA) from the Drug Controller General of India (DCGI) for its biosimilar drug, denosumab, indicated for the treatment of osteoporosis in adults.
9. What pricing options are available for accessing the report?
Pricing options include single-user, multi-user, and enterprise licenses priced at USD 4750, USD 5250, and USD 8750 respectively.
10. Is the market size provided in terms of value or volume?
The market size is provided in terms of value, measured in Million and volume, measured in K Unit.
11. Are there any specific market keywords associated with the report?
Yes, the market keyword associated with the report is "Osteoporosis Drugs Industry," which aids in identifying and referencing the specific market segment covered.
12. How do I determine which pricing option suits my needs best?
The pricing options vary based on user requirements and access needs. Individual users may opt for single-user licenses, while businesses requiring broader access may choose multi-user or enterprise licenses for cost-effective access to the report.
13. Are there any additional resources or data provided in the Osteoporosis Drugs Industry report?
While the report offers comprehensive insights, it's advisable to review the specific contents or supplementary materials provided to ascertain if additional resources or data are available.
14. How can I stay updated on further developments or reports in the Osteoporosis Drugs Industry?
To stay informed about further developments, trends, and reports in the Osteoporosis Drugs Industry, consider subscribing to industry newsletters, following relevant companies and organizations, or regularly checking reputable industry news sources and publications.
Methodology
Step 1 - Identification of Relevant Samples Size from Population Database


Step 2 - Approaches for Defining Global Market Size (Value, Volume* & Price*)

Note*: In applicable scenarios
Step 3 - Data Sources
Primary Research
- Web Analytics
- Survey Reports
- Research Institute
- Latest Research Reports
- Opinion Leaders
Secondary Research
- Annual Reports
- White Paper
- Latest Press Release
- Industry Association
- Paid Database
- Investor Presentations

Step 4 - Data Triangulation
Involves using different sources of information in order to increase the validity of a study
These sources are likely to be stakeholders in a program - participants, other researchers, program staff, other community members, and so on.
Then we put all data in single framework & apply various statistical tools to find out the dynamic on the market.
During the analysis stage, feedback from the stakeholder groups would be compared to determine areas of agreement as well as areas of divergence
