

Key Insights
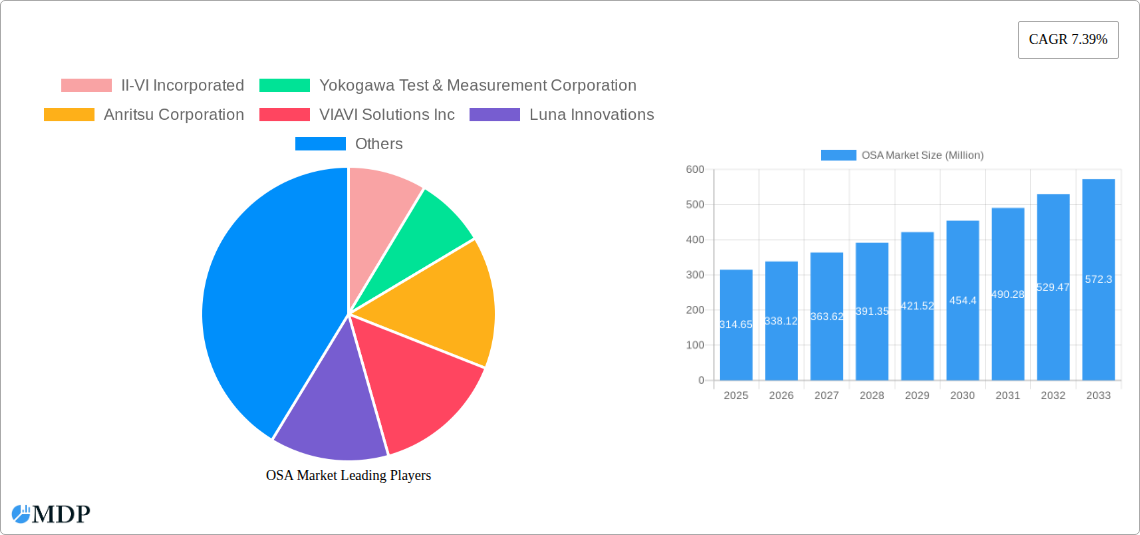
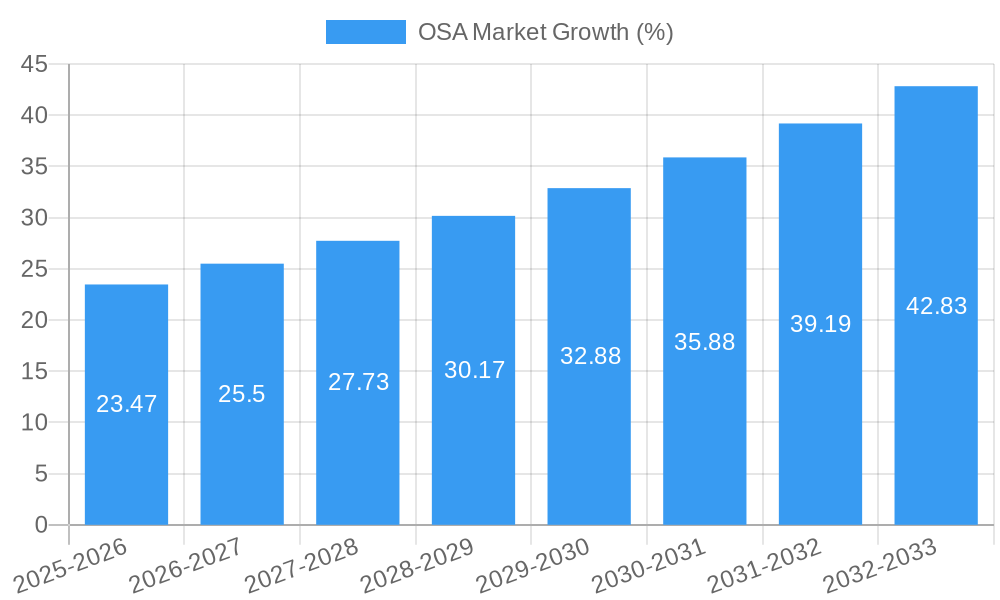
The Optical Spectrum Analyzer (OSA) market, valued at $314.65 million in 2025, is projected to experience robust growth, driven by increasing demand across diverse sectors. The telecommunications industry remains a key driver, fueled by the expansion of 5G networks and the growing need for high-speed data transmission. The healthcare sector's adoption of optical technologies for advanced diagnostics and treatment further contributes to market expansion. Consumer electronics, with its increasing reliance on high-bandwidth optical communication in devices like smartphones and smart TVs, also presents a significant growth opportunity. The market is segmented by type (portable, handheld, benchtop) and end-user industry, reflecting the varied application needs. Portable and handheld OSAs are gaining traction due to their convenience and portability, particularly for field testing and maintenance applications. Technological advancements such as improved resolution, wider wavelength ranges, and enhanced software capabilities are key trends shaping market dynamics. However, the high cost of advanced OSAs and the need for specialized technical expertise can pose challenges to market penetration. The forecast period (2025-2033) anticipates a consistent Compound Annual Growth Rate (CAGR) of 7.39%, indicating a significant expansion of the market. This growth is expected to be geographically diverse, with regions like Asia Pacific showing considerable potential due to rapid infrastructure development and rising technological adoption. Competition among major players like II-VI Incorporated, Yokogawa Test & Measurement Corporation, and Anritsu Corporation is expected to remain intense, fostering innovation and price competitiveness.
The continued growth in data consumption and the expansion of fiber optic networks worldwide will sustain the demand for OSAs. The increasing adoption of optical sensing technologies in various industries, including environmental monitoring and industrial automation, is also anticipated to contribute significantly to the market's expansion. Furthermore, ongoing research and development in OSA technology, focusing on miniaturization, enhanced performance, and reduced costs, are expected to further stimulate market growth. The integration of artificial intelligence (AI) and machine learning (ML) capabilities into OSA systems for improved data analysis and automated fault detection is a significant emerging trend. Despite potential restraints, such as the need for skilled personnel, the overall outlook for the OSA market remains positive, supported by robust industry growth and technological advancements across multiple sectors.
This comprehensive report provides a detailed analysis of the Optical Spectrum Analyzer (OSA) market, offering invaluable insights for industry stakeholders. With a study period spanning 2019-2033, a base year of 2025, and a forecast period of 2025-2033, this report covers market dynamics, industry trends, leading players, and future opportunities. The report is designed to help businesses make informed decisions in this rapidly evolving market, valued at xx Million in 2025 and projected to reach xx Million by 2033.
OSA Market Market Dynamics & Concentration
The OSA market is characterized by a moderately concentrated landscape, with key players such as II-VI Incorporated, Yokogawa Test & Measurement Corporation, Anritsu Corporation, VIAVI Solutions Inc., and others holding significant market share. Innovation in areas like higher sensitivity, wider wavelength ranges, and integrated functionalities are driving market growth. Stringent regulatory frameworks governing telecommunications and healthcare applications influence market development. Product substitutes, such as optical power meters, are present but offer limited functionality, maintaining OSA market dominance. End-user trends towards higher bandwidths and advanced network technologies fuel demand for high-performance OSAs. The number of M&A activities in the OSA market during the historical period (2019-2024) was estimated to be around xx, indicating a moderate level of consolidation. Market share data for the top 5 players is as follows:
- II-VI Incorporated: xx%
- Yokogawa Test & Measurement Corporation: xx%
- Anritsu Corporation: xx%
- VIAVI Solutions Inc.: xx%
- Others: xx%
OSA Market Industry Trends & Analysis
The OSA market is witnessing robust growth, driven by the expanding telecommunications sector, increasing demand for high-speed data transmission, and rising adoption of OSAs in various industries. The market is expected to exhibit a Compound Annual Growth Rate (CAGR) of xx% during the forecast period (2025-2033). Technological advancements, such as the integration of advanced algorithms and software, are enhancing OSA capabilities. Consumer preferences for high-quality optical components and services influence market demand. The market displays intense competition among established players and emerging entrants, prompting continuous innovation and strategic partnerships. Market penetration is increasing across diverse end-user segments and geographical locations, particularly in developing economies.
Leading Markets & Segments in OSA Market
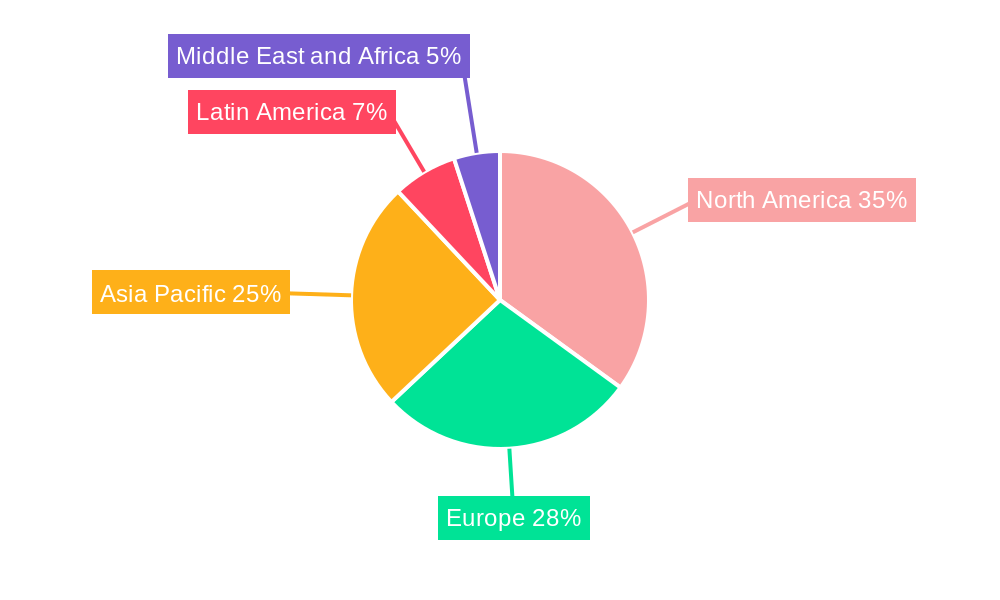
The Telecommunication segment dominates the OSA market due to the extensive use of OSAs in optical fiber network testing and maintenance. Within the By Type segment, the benchtop OSA holds the largest market share owing to its advanced features and higher accuracy. The North American region exhibits the highest market share due to significant investments in infrastructure and the presence of major market players.
Key Drivers:
- Telecommunication: Expanding 5G and fiber optic networks, increasing demand for high-bandwidth data transmission.
- Healthcare: Growth in minimally invasive surgeries requiring precise optical imaging.
- North America: Strong technological advancements, government support for infrastructure development.
- Benchtop OSAs: Superior performance and functionality for demanding applications.
Dominance analysis reveals that the North American market is leading due to the presence of a large number of established manufacturers and an extensive fiber optic network. This dominance is expected to persist during the forecast period due to continuing technological innovation and the increasing adoption of 5G technology.
OSA Market Product Developments
Recent years have witnessed significant advancements in OSA technology, including increased wavelength coverage, improved accuracy, and portability. Manufacturers are incorporating advanced features such as automated measurements, data analysis software, and user-friendly interfaces. These developments are enhancing OSA performance and expanding their applications across various industries. The focus is on developing compact and portable OSAs for field deployments, alongside high-performance benchtop models for research and development.
Key Drivers of OSA Market Growth
The OSA market's growth is fueled by several key factors. Firstly, rapid advancements in optical communication technologies are increasing the demand for reliable testing and monitoring solutions. Secondly, the proliferation of high-speed internet and 5G networks requires precise optical measurement equipment. Finally, increasing government investments in infrastructure development, particularly in emerging economies, are further driving market growth.
Challenges in the OSA Market Market
The OSA market faces challenges such as high initial investment costs, the complexity of operation and maintenance, and intense competition from established players. Supply chain disruptions, particularly the shortage of essential components, are also creating uncertainty and impacting market growth. Regulatory compliance requirements vary across regions, creating complexities for manufacturers operating internationally.
Emerging Opportunities in OSA Market
The OSA market presents significant opportunities driven by technological advancements, including the development of more compact, portable, and cost-effective OSAs. Strategic partnerships between OSA manufacturers and end-users are creating innovative applications in various sectors. Expanding into emerging markets with growing infrastructure development offers substantial growth potential.
Leading Players in the OSA Market Sector
- II-VI Incorporated
- Yokogawa Test & Measurement Corporation
- Anritsu Corporation
- VIAVI Solutions Inc
- Luna Innovations
- Quantifi Photonics Limited
- ID Photonics GmbH
- Exfo Inc
- Aragon Photonics Brillouin
- Thorlabs Inc
- Apex Technologies
Key Milestones in OSA Market Industry
- August 2022: Yokogawa launched two new OSAs (AQ6375E and AQ6376E), expanding wavelength measurement capabilities.
- January 2022: SAF Tehnika expanded its Spectrum Compact family of handheld microwave spectrum analyzers, enhancing performance and affordability.
- June 2021: VIAVI Solutions introduced the MOSA module, adding optical spectrum analysis to its MAP optical manufacturing test system.
- May 2021: EXFO launched the 5GPro OSA, a modular RF testing solution for 4G/LTE and 5G NR environments.
Strategic Outlook for OSA Market Market
The OSA market holds significant potential for future growth, driven by technological advancements and expanding applications across various sectors. Strategic partnerships, market expansion into emerging economies, and focusing on developing cost-effective and user-friendly solutions will be key for success. The market is poised for continuous innovation and consolidation, presenting both opportunities and challenges for players in the coming years.
OSA Market Segmentation
-
1. Type
- 1.1. Portable
- 1.2. Handheld
- 1.3. Benchtop
-
2. End-user Industry
- 2.1. Telecommunication
- 2.2. Healthcare
- 2.3. Consumer Electronics
- 2.4. Other End-user Industry
OSA Market Segmentation By Geography
- 1. North America
- 2. Europe
- 3. Asia Pacific
- 4. Latin America
- 5. Middle East and Africa
OSA Market REPORT HIGHLIGHTS
| Aspects | Details |
|---|---|
| Study Period | 2019-2033 |
| Base Year | 2024 |
| Estimated Year | 2025 |
| Forecast Period | 2025-2033 |
| Historical Period | 2019-2024 |
| Growth Rate | CAGR of 7.39% from 2019-2033 |
| Segmentation |
|
Table of Contents
- 1. Introduction
- 1.1. Research Scope
- 1.2. Market Segmentation
- 1.3. Research Methodology
- 1.4. Definitions and Assumptions
- 2. Executive Summary
- 2.1. Introduction
- 3. Market Dynamics
- 3.1. Introduction
- 3.2. Market Drivers
- 3.2.1. Growth of 5G (Millimeter Wave) Technology
- 3.3. Market Restrains
- 3.3.1. Replacement of Optical Spectrum Analyzer Products with Advanced Products
- 3.4. Market Trends
- 3.4.1. Telecommunications is Expected to Hold the Largest Share
- 4. Market Factor Analysis
- 4.1. Porters Five Forces
- 4.2. Supply/Value Chain
- 4.3. PESTEL analysis
- 4.4. Market Entropy
- 4.5. Patent/Trademark Analysis
- 5. Global OSA Market Analysis, Insights and Forecast, 2019-2031
- 5.1. Market Analysis, Insights and Forecast - by Type
- 5.1.1. Portable
- 5.1.2. Handheld
- 5.1.3. Benchtop
- 5.2. Market Analysis, Insights and Forecast - by End-user Industry
- 5.2.1. Telecommunication
- 5.2.2. Healthcare
- 5.2.3. Consumer Electronics
- 5.2.4. Other End-user Industry
- 5.3. Market Analysis, Insights and Forecast - by Region
- 5.3.1. North America
- 5.3.2. Europe
- 5.3.3. Asia Pacific
- 5.3.4. Latin America
- 5.3.5. Middle East and Africa
- 5.1. Market Analysis, Insights and Forecast - by Type
- 6. North America OSA Market Analysis, Insights and Forecast, 2019-2031
- 6.1. Market Analysis, Insights and Forecast - by Type
- 6.1.1. Portable
- 6.1.2. Handheld
- 6.1.3. Benchtop
- 6.2. Market Analysis, Insights and Forecast - by End-user Industry
- 6.2.1. Telecommunication
- 6.2.2. Healthcare
- 6.2.3. Consumer Electronics
- 6.2.4. Other End-user Industry
- 6.1. Market Analysis, Insights and Forecast - by Type
- 7. Europe OSA Market Analysis, Insights and Forecast, 2019-2031
- 7.1. Market Analysis, Insights and Forecast - by Type
- 7.1.1. Portable
- 7.1.2. Handheld
- 7.1.3. Benchtop
- 7.2. Market Analysis, Insights and Forecast - by End-user Industry
- 7.2.1. Telecommunication
- 7.2.2. Healthcare
- 7.2.3. Consumer Electronics
- 7.2.4. Other End-user Industry
- 7.1. Market Analysis, Insights and Forecast - by Type
- 8. Asia Pacific OSA Market Analysis, Insights and Forecast, 2019-2031
- 8.1. Market Analysis, Insights and Forecast - by Type
- 8.1.1. Portable
- 8.1.2. Handheld
- 8.1.3. Benchtop
- 8.2. Market Analysis, Insights and Forecast - by End-user Industry
- 8.2.1. Telecommunication
- 8.2.2. Healthcare
- 8.2.3. Consumer Electronics
- 8.2.4. Other End-user Industry
- 8.1. Market Analysis, Insights and Forecast - by Type
- 9. Latin America OSA Market Analysis, Insights and Forecast, 2019-2031
- 9.1. Market Analysis, Insights and Forecast - by Type
- 9.1.1. Portable
- 9.1.2. Handheld
- 9.1.3. Benchtop
- 9.2. Market Analysis, Insights and Forecast - by End-user Industry
- 9.2.1. Telecommunication
- 9.2.2. Healthcare
- 9.2.3. Consumer Electronics
- 9.2.4. Other End-user Industry
- 9.1. Market Analysis, Insights and Forecast - by Type
- 10. Middle East and Africa OSA Market Analysis, Insights and Forecast, 2019-2031
- 10.1. Market Analysis, Insights and Forecast - by Type
- 10.1.1. Portable
- 10.1.2. Handheld
- 10.1.3. Benchtop
- 10.2. Market Analysis, Insights and Forecast - by End-user Industry
- 10.2.1. Telecommunication
- 10.2.2. Healthcare
- 10.2.3. Consumer Electronics
- 10.2.4. Other End-user Industry
- 10.1. Market Analysis, Insights and Forecast - by Type
- 11. North America OSA Market Analysis, Insights and Forecast, 2019-2031
- 11.1. Market Analysis, Insights and Forecast - By Country/Sub-region
- 11.1.1.
- 12. Europe OSA Market Analysis, Insights and Forecast, 2019-2031
- 12.1. Market Analysis, Insights and Forecast - By Country/Sub-region
- 12.1.1.
- 13. Asia Pacific OSA Market Analysis, Insights and Forecast, 2019-2031
- 13.1. Market Analysis, Insights and Forecast - By Country/Sub-region
- 13.1.1.
- 14. Latin America OSA Market Analysis, Insights and Forecast, 2019-2031
- 14.1. Market Analysis, Insights and Forecast - By Country/Sub-region
- 14.1.1.
- 15. Middle East and Africa OSA Market Analysis, Insights and Forecast, 2019-2031
- 15.1. Market Analysis, Insights and Forecast - By Country/Sub-region
- 15.1.1.
- 16. Competitive Analysis
- 16.1. Global Market Share Analysis 2024
- 16.2. Company Profiles
- 16.2.1 II-VI Incorporated
- 16.2.1.1. Overview
- 16.2.1.2. Products
- 16.2.1.3. SWOT Analysis
- 16.2.1.4. Recent Developments
- 16.2.1.5. Financials (Based on Availability)
- 16.2.2 Yokogawa Test & Measurement Corporation
- 16.2.2.1. Overview
- 16.2.2.2. Products
- 16.2.2.3. SWOT Analysis
- 16.2.2.4. Recent Developments
- 16.2.2.5. Financials (Based on Availability)
- 16.2.3 Anritsu Corporation
- 16.2.3.1. Overview
- 16.2.3.2. Products
- 16.2.3.3. SWOT Analysis
- 16.2.3.4. Recent Developments
- 16.2.3.5. Financials (Based on Availability)
- 16.2.4 VIAVI Solutions Inc
- 16.2.4.1. Overview
- 16.2.4.2. Products
- 16.2.4.3. SWOT Analysis
- 16.2.4.4. Recent Developments
- 16.2.4.5. Financials (Based on Availability)
- 16.2.5 Luna Innovations
- 16.2.5.1. Overview
- 16.2.5.2. Products
- 16.2.5.3. SWOT Analysis
- 16.2.5.4. Recent Developments
- 16.2.5.5. Financials (Based on Availability)
- 16.2.6 Quantifi Photonics Limited
- 16.2.6.1. Overview
- 16.2.6.2. Products
- 16.2.6.3. SWOT Analysis
- 16.2.6.4. Recent Developments
- 16.2.6.5. Financials (Based on Availability)
- 16.2.7 ID Photonics GmbH*List Not Exhaustive
- 16.2.7.1. Overview
- 16.2.7.2. Products
- 16.2.7.3. SWOT Analysis
- 16.2.7.4. Recent Developments
- 16.2.7.5. Financials (Based on Availability)
- 16.2.8 Exfo Inc
- 16.2.8.1. Overview
- 16.2.8.2. Products
- 16.2.8.3. SWOT Analysis
- 16.2.8.4. Recent Developments
- 16.2.8.5. Financials (Based on Availability)
- 16.2.9 Aragon Photonics Brillouin
- 16.2.9.1. Overview
- 16.2.9.2. Products
- 16.2.9.3. SWOT Analysis
- 16.2.9.4. Recent Developments
- 16.2.9.5. Financials (Based on Availability)
- 16.2.10 Thorlabs Inc
- 16.2.10.1. Overview
- 16.2.10.2. Products
- 16.2.10.3. SWOT Analysis
- 16.2.10.4. Recent Developments
- 16.2.10.5. Financials (Based on Availability)
- 16.2.11 Apex Technologies
- 16.2.11.1. Overview
- 16.2.11.2. Products
- 16.2.11.3. SWOT Analysis
- 16.2.11.4. Recent Developments
- 16.2.11.5. Financials (Based on Availability)
- 16.2.1 II-VI Incorporated
List of Figures
- Figure 1: Global OSA Market Revenue Breakdown (Million, %) by Region 2024 & 2032
- Figure 2: North America OSA Market Revenue (Million), by Country 2024 & 2032
- Figure 3: North America OSA Market Revenue Share (%), by Country 2024 & 2032
- Figure 4: Europe OSA Market Revenue (Million), by Country 2024 & 2032
- Figure 5: Europe OSA Market Revenue Share (%), by Country 2024 & 2032
- Figure 6: Asia Pacific OSA Market Revenue (Million), by Country 2024 & 2032
- Figure 7: Asia Pacific OSA Market Revenue Share (%), by Country 2024 & 2032
- Figure 8: Latin America OSA Market Revenue (Million), by Country 2024 & 2032
- Figure 9: Latin America OSA Market Revenue Share (%), by Country 2024 & 2032
- Figure 10: Middle East and Africa OSA Market Revenue (Million), by Country 2024 & 2032
- Figure 11: Middle East and Africa OSA Market Revenue Share (%), by Country 2024 & 2032
- Figure 12: North America OSA Market Revenue (Million), by Type 2024 & 2032
- Figure 13: North America OSA Market Revenue Share (%), by Type 2024 & 2032
- Figure 14: North America OSA Market Revenue (Million), by End-user Industry 2024 & 2032
- Figure 15: North America OSA Market Revenue Share (%), by End-user Industry 2024 & 2032
- Figure 16: North America OSA Market Revenue (Million), by Country 2024 & 2032
- Figure 17: North America OSA Market Revenue Share (%), by Country 2024 & 2032
- Figure 18: Europe OSA Market Revenue (Million), by Type 2024 & 2032
- Figure 19: Europe OSA Market Revenue Share (%), by Type 2024 & 2032
- Figure 20: Europe OSA Market Revenue (Million), by End-user Industry 2024 & 2032
- Figure 21: Europe OSA Market Revenue Share (%), by End-user Industry 2024 & 2032
- Figure 22: Europe OSA Market Revenue (Million), by Country 2024 & 2032
- Figure 23: Europe OSA Market Revenue Share (%), by Country 2024 & 2032
- Figure 24: Asia Pacific OSA Market Revenue (Million), by Type 2024 & 2032
- Figure 25: Asia Pacific OSA Market Revenue Share (%), by Type 2024 & 2032
- Figure 26: Asia Pacific OSA Market Revenue (Million), by End-user Industry 2024 & 2032
- Figure 27: Asia Pacific OSA Market Revenue Share (%), by End-user Industry 2024 & 2032
- Figure 28: Asia Pacific OSA Market Revenue (Million), by Country 2024 & 2032
- Figure 29: Asia Pacific OSA Market Revenue Share (%), by Country 2024 & 2032
- Figure 30: Latin America OSA Market Revenue (Million), by Type 2024 & 2032
- Figure 31: Latin America OSA Market Revenue Share (%), by Type 2024 & 2032
- Figure 32: Latin America OSA Market Revenue (Million), by End-user Industry 2024 & 2032
- Figure 33: Latin America OSA Market Revenue Share (%), by End-user Industry 2024 & 2032
- Figure 34: Latin America OSA Market Revenue (Million), by Country 2024 & 2032
- Figure 35: Latin America OSA Market Revenue Share (%), by Country 2024 & 2032
- Figure 36: Middle East and Africa OSA Market Revenue (Million), by Type 2024 & 2032
- Figure 37: Middle East and Africa OSA Market Revenue Share (%), by Type 2024 & 2032
- Figure 38: Middle East and Africa OSA Market Revenue (Million), by End-user Industry 2024 & 2032
- Figure 39: Middle East and Africa OSA Market Revenue Share (%), by End-user Industry 2024 & 2032
- Figure 40: Middle East and Africa OSA Market Revenue (Million), by Country 2024 & 2032
- Figure 41: Middle East and Africa OSA Market Revenue Share (%), by Country 2024 & 2032
List of Tables
- Table 1: Global OSA Market Revenue Million Forecast, by Region 2019 & 2032
- Table 2: Global OSA Market Revenue Million Forecast, by Type 2019 & 2032
- Table 3: Global OSA Market Revenue Million Forecast, by End-user Industry 2019 & 2032
- Table 4: Global OSA Market Revenue Million Forecast, by Region 2019 & 2032
- Table 5: Global OSA Market Revenue Million Forecast, by Country 2019 & 2032
- Table 6: OSA Market Revenue (Million) Forecast, by Application 2019 & 2032
- Table 7: Global OSA Market Revenue Million Forecast, by Country 2019 & 2032
- Table 8: OSA Market Revenue (Million) Forecast, by Application 2019 & 2032
- Table 9: Global OSA Market Revenue Million Forecast, by Country 2019 & 2032
- Table 10: OSA Market Revenue (Million) Forecast, by Application 2019 & 2032
- Table 11: Global OSA Market Revenue Million Forecast, by Country 2019 & 2032
- Table 12: OSA Market Revenue (Million) Forecast, by Application 2019 & 2032
- Table 13: Global OSA Market Revenue Million Forecast, by Country 2019 & 2032
- Table 14: OSA Market Revenue (Million) Forecast, by Application 2019 & 2032
- Table 15: Global OSA Market Revenue Million Forecast, by Type 2019 & 2032
- Table 16: Global OSA Market Revenue Million Forecast, by End-user Industry 2019 & 2032
- Table 17: Global OSA Market Revenue Million Forecast, by Country 2019 & 2032
- Table 18: Global OSA Market Revenue Million Forecast, by Type 2019 & 2032
- Table 19: Global OSA Market Revenue Million Forecast, by End-user Industry 2019 & 2032
- Table 20: Global OSA Market Revenue Million Forecast, by Country 2019 & 2032
- Table 21: Global OSA Market Revenue Million Forecast, by Type 2019 & 2032
- Table 22: Global OSA Market Revenue Million Forecast, by End-user Industry 2019 & 2032
- Table 23: Global OSA Market Revenue Million Forecast, by Country 2019 & 2032
- Table 24: Global OSA Market Revenue Million Forecast, by Type 2019 & 2032
- Table 25: Global OSA Market Revenue Million Forecast, by End-user Industry 2019 & 2032
- Table 26: Global OSA Market Revenue Million Forecast, by Country 2019 & 2032
- Table 27: Global OSA Market Revenue Million Forecast, by Type 2019 & 2032
- Table 28: Global OSA Market Revenue Million Forecast, by End-user Industry 2019 & 2032
- Table 29: Global OSA Market Revenue Million Forecast, by Country 2019 & 2032
Frequently Asked Questions
1. What is the projected Compound Annual Growth Rate (CAGR) of the OSA Market?
The projected CAGR is approximately 7.39%.
2. Which companies are prominent players in the OSA Market?
Key companies in the market include II-VI Incorporated, Yokogawa Test & Measurement Corporation, Anritsu Corporation, VIAVI Solutions Inc, Luna Innovations, Quantifi Photonics Limited, ID Photonics GmbH*List Not Exhaustive, Exfo Inc, Aragon Photonics Brillouin, Thorlabs Inc, Apex Technologies.
3. What are the main segments of the OSA Market?
The market segments include Type, End-user Industry.
4. Can you provide details about the market size?
The market size is estimated to be USD 314.65 Million as of 2022.
5. What are some drivers contributing to market growth?
Growth of 5G (Millimeter Wave) Technology.
6. What are the notable trends driving market growth?
Telecommunications is Expected to Hold the Largest Share.
7. Are there any restraints impacting market growth?
Replacement of Optical Spectrum Analyzer Products with Advanced Products.
8. Can you provide examples of recent developments in the market?
August 2022 - Yokogawa announced to launch of two new optical spectrum analyzers (OSAs), AQ6375E and AQ6376E. The launch aimed to fulfill market demands for an instrument capable of measuring a wide range of wavelengths to meet new needs in optical product manufacturing and development.
9. What pricing options are available for accessing the report?
Pricing options include single-user, multi-user, and enterprise licenses priced at USD 4750, USD 5250, and USD 8750 respectively.
10. Is the market size provided in terms of value or volume?
The market size is provided in terms of value, measured in Million.
11. Are there any specific market keywords associated with the report?
Yes, the market keyword associated with the report is "OSA Market," which aids in identifying and referencing the specific market segment covered.
12. How do I determine which pricing option suits my needs best?
The pricing options vary based on user requirements and access needs. Individual users may opt for single-user licenses, while businesses requiring broader access may choose multi-user or enterprise licenses for cost-effective access to the report.
13. Are there any additional resources or data provided in the OSA Market report?
While the report offers comprehensive insights, it's advisable to review the specific contents or supplementary materials provided to ascertain if additional resources or data are available.
14. How can I stay updated on further developments or reports in the OSA Market?
To stay informed about further developments, trends, and reports in the OSA Market, consider subscribing to industry newsletters, following relevant companies and organizations, or regularly checking reputable industry news sources and publications.
Methodology
Step 1 - Identification of Relevant Samples Size from Population Database


Step 2 - Approaches for Defining Global Market Size (Value, Volume* & Price*)

Note*: In applicable scenarios
Step 3 - Data Sources
Primary Research
- Web Analytics
- Survey Reports
- Research Institute
- Latest Research Reports
- Opinion Leaders
Secondary Research
- Annual Reports
- White Paper
- Latest Press Release
- Industry Association
- Paid Database
- Investor Presentations

Step 4 - Data Triangulation
Involves using different sources of information in order to increase the validity of a study
These sources are likely to be stakeholders in a program - participants, other researchers, program staff, other community members, and so on.
Then we put all data in single framework & apply various statistical tools to find out the dynamic on the market.
During the analysis stage, feedback from the stakeholder groups would be compared to determine areas of agreement as well as areas of divergence
