

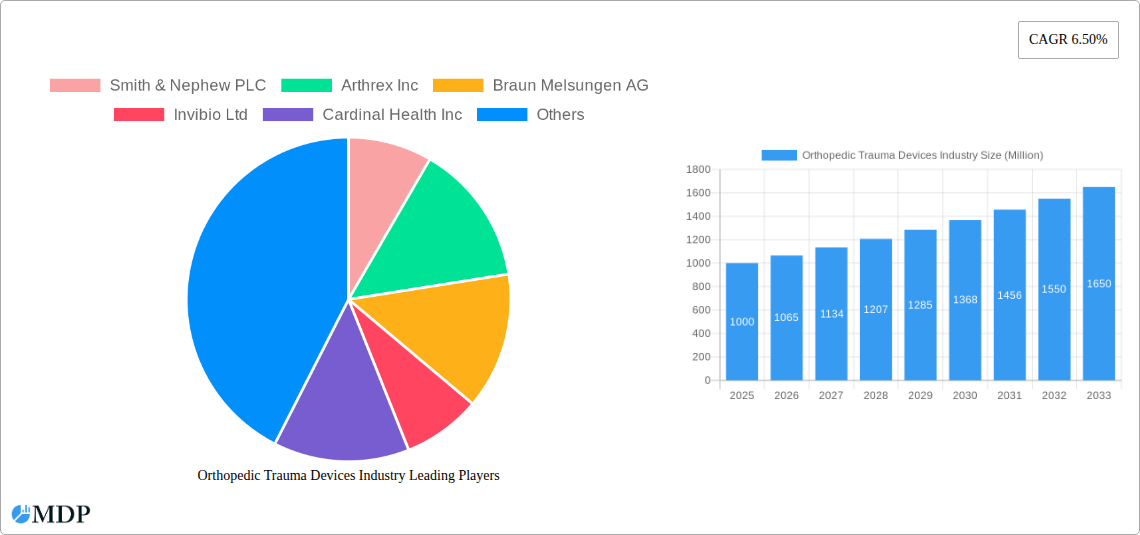
Key Insights
The orthopedic trauma devices market, valued at approximately $XX million in 2025, is projected to experience robust growth, driven by a 6.5% CAGR from 2025 to 2033. This expansion is fueled by several key factors. The aging global population, leading to increased incidence of fractures and trauma, significantly contributes to market demand. Technological advancements, including the development of minimally invasive surgical techniques and biocompatible materials (like titanium alloys and polymers), are improving surgical outcomes and patient recovery times, thereby stimulating market growth. Furthermore, rising healthcare expenditure and improved healthcare infrastructure, particularly in developing economies, are broadening access to advanced orthopedic care, further bolstering market expansion. The increasing prevalence of road accidents and sports injuries also play a significant role in driving the demand for orthopedic trauma devices. Internal fixators currently dominate the market, followed by external fixators, catering to a diverse range of trauma types across upper and lower extremities. Hospitals and ambulatory surgery centers constitute the primary end-users, though the segment of "other end-users" (e.g., clinics) is expected to see significant growth in the forecast period due to increasing adoption of outpatient procedures.
However, the market faces certain restraints. High costs associated with advanced orthopedic implants and procedures can limit accessibility, particularly in low- and middle-income countries. Stringent regulatory approvals and lengthy product development cycles can hinder market entry for new players. Additionally, potential risks associated with surgical procedures, such as infections and implant failure, necessitate careful consideration in market projections. Despite these challenges, the overall outlook for the orthopedic trauma devices market remains positive, with substantial growth opportunities particularly in the Asia-Pacific region due to its expanding population and rising healthcare spending. Competitive rivalry among established players like Smith & Nephew, Arthrex, and Stryker is intense, necessitating continuous innovation and strategic partnerships to maintain market share. The market's future is likely to be shaped by personalized medicine approaches and the development of more durable, bio-integrated implants.
Orthopedic Trauma Devices Industry: A Comprehensive Market Report (2019-2033)
This comprehensive report provides a detailed analysis of the Orthopedic Trauma Devices industry, offering invaluable insights for stakeholders seeking to navigate this dynamic market. From market sizing and segmentation to competitive landscapes and future trends, this report equips you with the data-driven intelligence needed to make strategic decisions. With a forecast period spanning 2025-2033 (Base Year: 2025, Estimated Year: 2025, Historical Period: 2019-2024, Study Period: 2019-2033), this report covers key aspects of the industry, including its current state and future prospects. The market is expected to reach xx Million by 2033, exhibiting a CAGR of xx% during the forecast period.
Orthopedic Trauma Devices Industry Market Dynamics & Concentration
This section analyzes the market concentration, innovation drivers, regulatory frameworks, product substitutes, end-user trends, and mergers and acquisitions (M&A) activities within the orthopedic trauma devices industry. The market is moderately concentrated, with key players holding significant market share.
- Market Concentration: The top 5 players account for approximately xx% of the global market share in 2024.
- Innovation Drivers: The industry is driven by technological advancements in biomaterials, minimally invasive surgical techniques, and personalized medicine approaches. These innovations aim to improve implant design, reduce recovery time, and enhance patient outcomes.
- Regulatory Frameworks: Stringent regulatory requirements from bodies like the FDA (United States) and CE marking (Europe) significantly impact the market. Compliance and approvals are crucial for market entry and product success.
- Product Substitutes: Alternative treatment methods, such as non-surgical therapies and rehabilitation programs, offer some level of substitution, but surgical intervention remains crucial for severe trauma cases.
- End-User Trends: The increasing aging population, rising incidence of trauma cases due to accidents and sports injuries, and a shift toward ambulatory surgical centers are driving market growth.
- M&A Activities: The industry has witnessed a moderate number of M&A deals in recent years (xx deals in the last 5 years), with larger companies acquiring smaller innovative firms to expand their product portfolio and market reach.
Orthopedic Trauma Devices Industry Industry Trends & Analysis
This section explores the factors influencing the growth of the orthopedic trauma devices market, analyzing market growth drivers, technological disruptions, consumer preferences, and competitive dynamics. The global market is driven by the increasing prevalence of trauma cases globally, an aging population, and advancements in minimally invasive surgical techniques.
Technological advancements such as 3D-printed implants, smart implants with sensors, and improved biomaterials are transforming the industry. The demand for high-quality, reliable, and cost-effective devices remains significant. Increased focus on patient-centric care, with reduced recovery times and enhanced rehabilitation options, also fuels market expansion. The market demonstrates significant competitive intensity, with companies focused on product differentiation, technological innovation, and strategic partnerships to maintain their market share.
Leading Markets & Segments in Orthopedic Trauma Devices Industry
This section highlights the dominant regions, countries, and segments within the Orthopedic Trauma Devices industry.
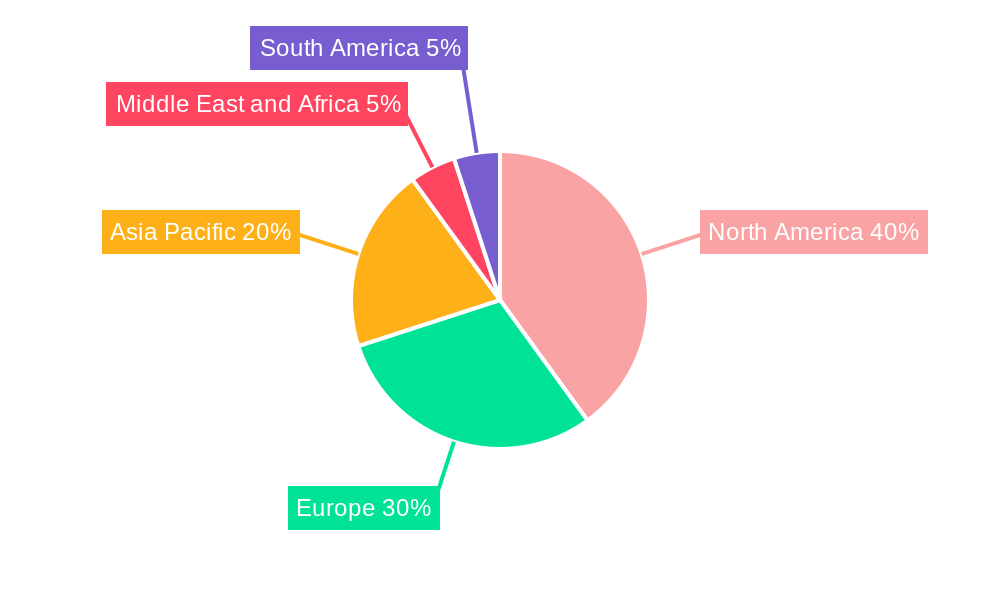
Dominant Region: North America is currently the largest market, driven by high healthcare expenditure, advanced medical infrastructure, and a large aging population. Europe holds the second largest market share, followed by the Asia-Pacific region, which shows significant growth potential.
Dominant Segment: Internal fixators currently dominate the market due to their widespread use in treating fractures. Lower extremity applications constitute the largest segment due to the higher incidence of lower limb injuries. Hospitals remain the primary end-users, followed by ambulatory surgery centers.
Key Drivers:
- North America: High healthcare spending, robust healthcare infrastructure, and technological advancements.
- Europe: Growing aging population, high prevalence of trauma, and increasing healthcare expenditure.
- Asia-Pacific: Rising disposable incomes, improving healthcare infrastructure, and increasing awareness of advanced treatment options.
Orthopedic Trauma Devices Industry Product Developments
Recent years have seen significant innovation in orthopedic trauma devices. Companies are focusing on developing biocompatible materials, minimally invasive devices, and personalized implants designed to meet specific patient needs. 3D-printing technology is increasingly used to create customized implants, improving surgical precision and patient outcomes. The integration of smart technologies, such as sensors and data analytics, allows for improved monitoring and personalized rehabilitation plans. These advancements contribute to the enhanced efficacy and reduced recovery times offered by modern orthopedic trauma devices.
Key Drivers of Orthopedic Trauma Devices Industry Growth
Several factors contribute to the growth of the orthopedic trauma devices industry. Technological advancements leading to improved implant designs and minimally invasive surgical techniques are key drivers. The rising prevalence of traumatic injuries, driven by factors such as increasing road accidents and sports participation, fuels demand. Moreover, favorable regulatory environments and increased healthcare spending in many regions globally contribute to market expansion. Finally, the growing elderly population, which is more susceptible to fractures, is significantly driving demand for these devices.
Challenges in the Orthopedic Trauma Devices Industry Market
The orthopedic trauma devices market faces several challenges. Stringent regulatory approvals and compliance requirements can delay product launches and increase development costs. Supply chain disruptions, particularly for raw materials, can impact production and availability. Intense competition among established players and emerging companies, with a focus on pricing and innovation, poses a significant challenge. Furthermore, pricing pressure from healthcare payers can limit profitability. These factors collectively affect the overall market dynamics.
Emerging Opportunities in Orthopedic Trauma Devices Industry
Significant opportunities exist for growth within the orthopedic trauma devices market. Continued technological advancements, such as the development of bio-integrated implants and personalized medicine approaches, offer vast potential. Strategic collaborations and partnerships between device manufacturers, healthcare providers, and research institutions can facilitate innovation and market expansion. Focus on emerging markets and untapped patient segments, alongside expanding market penetration in existing regions, present lucrative growth avenues.
Leading Players in the Orthopedic Trauma Devices Industry Sector
- Smith & Nephew PLC
- Arthrex Inc
- Braun Melsungen AG
- Invibio Ltd
- Cardinal Health Inc
- Medtronic PLC
- Orthofix Medical Inc
- Conmed Corporation
- Johnson & Johnson
- Stryker Corporation
- Zimmer Biomet
Key Milestones in Orthopedic Trauma Devices Industry Industry
- October 2020: DePuy Synthes (Johnson & Johnson) launched the 'FIBULINK Syndesmosis Repair System' in the U.S., addressing syndesmosis injuries.
- July 2020: Orthofix received FDA and CE Mark approval for its 'JuniOrtho plating system' for pediatric lower extremity reconstruction.
Strategic Outlook for Orthopedic Trauma Devices Industry Market
The future of the orthopedic trauma devices market is promising, driven by technological innovation, demographic shifts, and increasing healthcare spending. Companies that prioritize product differentiation, strategic partnerships, and a focus on minimally invasive and personalized solutions are poised for significant growth. Expansion into emerging markets and tapping into unmet clinical needs will be critical for success. The market is expected to witness a sustained period of growth, driven by the factors outlined in this report.
Orthopedic Trauma Devices Industry Segmentation
-
1. Type
-
1.1. Internal Fixators
- 1.1.1. Plates
- 1.1.2. Screws
- 1.1.3. Nails
- 1.1.4. Others
-
1.2. External Fixators
- 1.2.1. Unilateral and Bilateral External Fixators
- 1.2.2. Circular Fixators
- 1.2.3. Hybrid Fixators
-
1.1. Internal Fixators
-
2. Surgical Site
-
2.1. Lower Extremities
- 2.1.1. Hip and Pelvic
- 2.1.2. Foot and Ankle
- 2.1.3. Knee
- 2.1.4. Others
-
2.2. Upper Extremities
- 2.2.1. Hand and Wrist
- 2.2.2. Shoulder
- 2.2.3. Spine
-
2.1. Lower Extremities
-
3. End User
- 3.1. Hospitals
- 3.2. Ambulatory Surgery Centers
- 3.3. Other End Users
Orthopedic Trauma Devices Industry Segmentation By Geography
-
1. North America
- 1.1. United States
- 1.2. Canada
- 1.3. Mexico
-
2. Europe
- 2.1. Germany
- 2.2. United Kingdom
- 2.3. France
- 2.4. Italy
- 2.5. Spain
- 2.6. Rest of Europe
-
3. Asia Pacific
- 3.1. China
- 3.2. Japan
- 3.3. India
- 3.4. Australia
- 3.5. South Korea
- 3.6. Rest of Asia Pacific
-
4. Middle East and Africa
- 4.1. GCC
- 4.2. South Africa
- 4.3. Rest of Middle East and Africa
-
5. South America
- 5.1. Brazil
- 5.2. Argentina
- 5.3. Rest of South America
Orthopedic Trauma Devices Industry REPORT HIGHLIGHTS
| Aspects | Details |
|---|---|
| Study Period | 2019-2033 |
| Base Year | 2024 |
| Estimated Year | 2025 |
| Forecast Period | 2025-2033 |
| Historical Period | 2019-2024 |
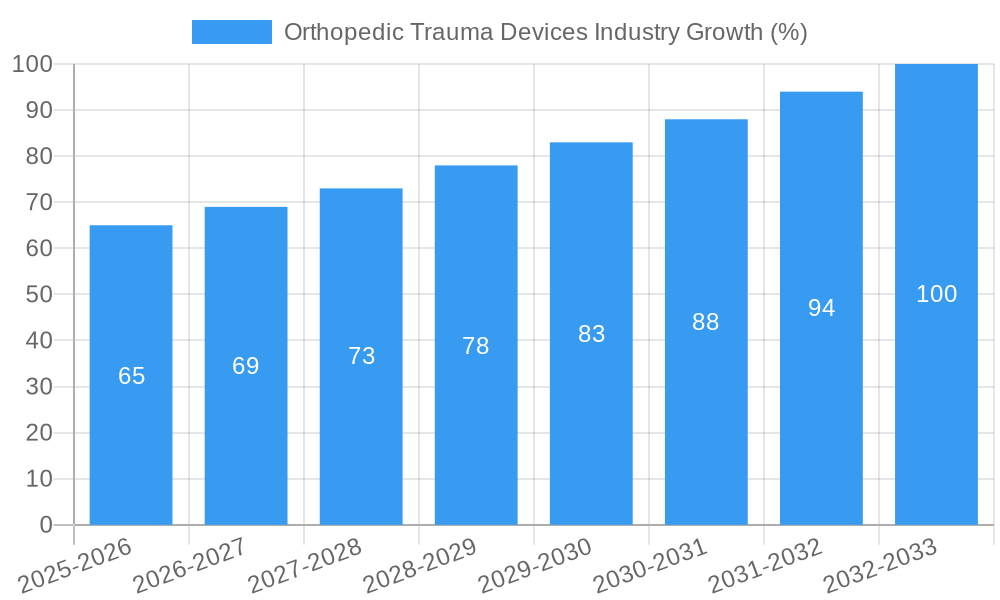
| Growth Rate | CAGR of 6.50% from 2019-2033 |
| Segmentation |
|
Table of Contents
- 1. Introduction
- 1.1. Research Scope
- 1.2. Market Segmentation
- 1.3. Research Methodology
- 1.4. Definitions and Assumptions
- 2. Executive Summary
- 2.1. Introduction
- 3. Market Dynamics
- 3.1. Introduction
- 3.2. Market Drivers
- 3.2.1. Growing Burden of Bone Degenerative Diseases; Increasing Number of Road Accidents; Technological Advancements in Medical Devices
- 3.3. Market Restrains
- 3.3.1. Lack of Trained Professionals; Stringent Regulatory Issues
- 3.4. Market Trends
- 3.4.1. Circular Fixators Segment is Expected to Hold a Major Share in the Trauma Fixation Devices Market
- 4. Market Factor Analysis
- 4.1. Porters Five Forces
- 4.2. Supply/Value Chain
- 4.3. PESTEL analysis
- 4.4. Market Entropy
- 4.5. Patent/Trademark Analysis
- 5. Global Orthopedic Trauma Devices Industry Analysis, Insights and Forecast, 2019-2031
- 5.1. Market Analysis, Insights and Forecast - by Type
- 5.1.1. Internal Fixators
- 5.1.1.1. Plates
- 5.1.1.2. Screws
- 5.1.1.3. Nails
- 5.1.1.4. Others
- 5.1.2. External Fixators
- 5.1.2.1. Unilateral and Bilateral External Fixators
- 5.1.2.2. Circular Fixators
- 5.1.2.3. Hybrid Fixators
- 5.1.1. Internal Fixators
- 5.2. Market Analysis, Insights and Forecast - by Surgical Site
- 5.2.1. Lower Extremities
- 5.2.1.1. Hip and Pelvic
- 5.2.1.2. Foot and Ankle
- 5.2.1.3. Knee
- 5.2.1.4. Others
- 5.2.2. Upper Extremities
- 5.2.2.1. Hand and Wrist
- 5.2.2.2. Shoulder
- 5.2.2.3. Spine
- 5.2.1. Lower Extremities
- 5.3. Market Analysis, Insights and Forecast - by End User
- 5.3.1. Hospitals
- 5.3.2. Ambulatory Surgery Centers
- 5.3.3. Other End Users
- 5.4. Market Analysis, Insights and Forecast - by Region
- 5.4.1. North America
- 5.4.2. Europe
- 5.4.3. Asia Pacific
- 5.4.4. Middle East and Africa
- 5.4.5. South America
- 5.1. Market Analysis, Insights and Forecast - by Type
- 6. North America Orthopedic Trauma Devices Industry Analysis, Insights and Forecast, 2019-2031
- 6.1. Market Analysis, Insights and Forecast - by Type
- 6.1.1. Internal Fixators
- 6.1.1.1. Plates
- 6.1.1.2. Screws
- 6.1.1.3. Nails
- 6.1.1.4. Others
- 6.1.2. External Fixators
- 6.1.2.1. Unilateral and Bilateral External Fixators
- 6.1.2.2. Circular Fixators
- 6.1.2.3. Hybrid Fixators
- 6.1.1. Internal Fixators
- 6.2. Market Analysis, Insights and Forecast - by Surgical Site
- 6.2.1. Lower Extremities
- 6.2.1.1. Hip and Pelvic
- 6.2.1.2. Foot and Ankle
- 6.2.1.3. Knee
- 6.2.1.4. Others
- 6.2.2. Upper Extremities
- 6.2.2.1. Hand and Wrist
- 6.2.2.2. Shoulder
- 6.2.2.3. Spine
- 6.2.1. Lower Extremities
- 6.3. Market Analysis, Insights and Forecast - by End User
- 6.3.1. Hospitals
- 6.3.2. Ambulatory Surgery Centers
- 6.3.3. Other End Users
- 6.1. Market Analysis, Insights and Forecast - by Type
- 7. Europe Orthopedic Trauma Devices Industry Analysis, Insights and Forecast, 2019-2031
- 7.1. Market Analysis, Insights and Forecast - by Type
- 7.1.1. Internal Fixators
- 7.1.1.1. Plates
- 7.1.1.2. Screws
- 7.1.1.3. Nails
- 7.1.1.4. Others
- 7.1.2. External Fixators
- 7.1.2.1. Unilateral and Bilateral External Fixators
- 7.1.2.2. Circular Fixators
- 7.1.2.3. Hybrid Fixators
- 7.1.1. Internal Fixators
- 7.2. Market Analysis, Insights and Forecast - by Surgical Site
- 7.2.1. Lower Extremities
- 7.2.1.1. Hip and Pelvic
- 7.2.1.2. Foot and Ankle
- 7.2.1.3. Knee
- 7.2.1.4. Others
- 7.2.2. Upper Extremities
- 7.2.2.1. Hand and Wrist
- 7.2.2.2. Shoulder
- 7.2.2.3. Spine
- 7.2.1. Lower Extremities
- 7.3. Market Analysis, Insights and Forecast - by End User
- 7.3.1. Hospitals
- 7.3.2. Ambulatory Surgery Centers
- 7.3.3. Other End Users
- 7.1. Market Analysis, Insights and Forecast - by Type
- 8. Asia Pacific Orthopedic Trauma Devices Industry Analysis, Insights and Forecast, 2019-2031
- 8.1. Market Analysis, Insights and Forecast - by Type
- 8.1.1. Internal Fixators
- 8.1.1.1. Plates
- 8.1.1.2. Screws
- 8.1.1.3. Nails
- 8.1.1.4. Others
- 8.1.2. External Fixators
- 8.1.2.1. Unilateral and Bilateral External Fixators
- 8.1.2.2. Circular Fixators
- 8.1.2.3. Hybrid Fixators
- 8.1.1. Internal Fixators
- 8.2. Market Analysis, Insights and Forecast - by Surgical Site
- 8.2.1. Lower Extremities
- 8.2.1.1. Hip and Pelvic
- 8.2.1.2. Foot and Ankle
- 8.2.1.3. Knee
- 8.2.1.4. Others
- 8.2.2. Upper Extremities
- 8.2.2.1. Hand and Wrist
- 8.2.2.2. Shoulder
- 8.2.2.3. Spine
- 8.2.1. Lower Extremities
- 8.3. Market Analysis, Insights and Forecast - by End User
- 8.3.1. Hospitals
- 8.3.2. Ambulatory Surgery Centers
- 8.3.3. Other End Users
- 8.1. Market Analysis, Insights and Forecast - by Type
- 9. Middle East and Africa Orthopedic Trauma Devices Industry Analysis, Insights and Forecast, 2019-2031
- 9.1. Market Analysis, Insights and Forecast - by Type
- 9.1.1. Internal Fixators
- 9.1.1.1. Plates
- 9.1.1.2. Screws
- 9.1.1.3. Nails
- 9.1.1.4. Others
- 9.1.2. External Fixators
- 9.1.2.1. Unilateral and Bilateral External Fixators
- 9.1.2.2. Circular Fixators
- 9.1.2.3. Hybrid Fixators
- 9.1.1. Internal Fixators
- 9.2. Market Analysis, Insights and Forecast - by Surgical Site
- 9.2.1. Lower Extremities
- 9.2.1.1. Hip and Pelvic
- 9.2.1.2. Foot and Ankle
- 9.2.1.3. Knee
- 9.2.1.4. Others
- 9.2.2. Upper Extremities
- 9.2.2.1. Hand and Wrist
- 9.2.2.2. Shoulder
- 9.2.2.3. Spine
- 9.2.1. Lower Extremities
- 9.3. Market Analysis, Insights and Forecast - by End User
- 9.3.1. Hospitals
- 9.3.2. Ambulatory Surgery Centers
- 9.3.3. Other End Users
- 9.1. Market Analysis, Insights and Forecast - by Type
- 10. South America Orthopedic Trauma Devices Industry Analysis, Insights and Forecast, 2019-2031
- 10.1. Market Analysis, Insights and Forecast - by Type
- 10.1.1. Internal Fixators
- 10.1.1.1. Plates
- 10.1.1.2. Screws
- 10.1.1.3. Nails
- 10.1.1.4. Others
- 10.1.2. External Fixators
- 10.1.2.1. Unilateral and Bilateral External Fixators
- 10.1.2.2. Circular Fixators
- 10.1.2.3. Hybrid Fixators
- 10.1.1. Internal Fixators
- 10.2. Market Analysis, Insights and Forecast - by Surgical Site
- 10.2.1. Lower Extremities
- 10.2.1.1. Hip and Pelvic
- 10.2.1.2. Foot and Ankle
- 10.2.1.3. Knee
- 10.2.1.4. Others
- 10.2.2. Upper Extremities
- 10.2.2.1. Hand and Wrist
- 10.2.2.2. Shoulder
- 10.2.2.3. Spine
- 10.2.1. Lower Extremities
- 10.3. Market Analysis, Insights and Forecast - by End User
- 10.3.1. Hospitals
- 10.3.2. Ambulatory Surgery Centers
- 10.3.3. Other End Users
- 10.1. Market Analysis, Insights and Forecast - by Type
- 11. North America Orthopedic Trauma Devices Industry Analysis, Insights and Forecast, 2019-2031
- 11.1. Market Analysis, Insights and Forecast - By Country/Sub-region
- 11.1.1. undefined
- 12. Europe Orthopedic Trauma Devices Industry Analysis, Insights and Forecast, 2019-2031
- 12.1. Market Analysis, Insights and Forecast - By Country/Sub-region
- 12.1.1. undefined
- 13. Asia Pacific Orthopedic Trauma Devices Industry Analysis, Insights and Forecast, 2019-2031
- 13.1. Market Analysis, Insights and Forecast - By Country/Sub-region
- 13.1.1. undefined
- 14. Middle East and Africa Orthopedic Trauma Devices Industry Analysis, Insights and Forecast, 2019-2031
- 14.1. Market Analysis, Insights and Forecast - By Country/Sub-region
- 14.1.1. undefined
- 15. South America Orthopedic Trauma Devices Industry Analysis, Insights and Forecast, 2019-2031
- 15.1. Market Analysis, Insights and Forecast - By Country/Sub-region
- 15.1.1. undefined
- 16. Competitive Analysis
- 16.1. Global Market Share Analysis 2024
- 16.2. Company Profiles
- 16.2.1 Smith & Nephew PLC
- 16.2.1.1. Overview
- 16.2.1.2. Products
- 16.2.1.3. SWOT Analysis
- 16.2.1.4. Recent Developments
- 16.2.1.5. Financials (Based on Availability)
- 16.2.2 Arthrex Inc
- 16.2.2.1. Overview
- 16.2.2.2. Products
- 16.2.2.3. SWOT Analysis
- 16.2.2.4. Recent Developments
- 16.2.2.5. Financials (Based on Availability)
- 16.2.3 Braun Melsungen AG
- 16.2.3.1. Overview
- 16.2.3.2. Products
- 16.2.3.3. SWOT Analysis
- 16.2.3.4. Recent Developments
- 16.2.3.5. Financials (Based on Availability)
- 16.2.4 Invibio Ltd
- 16.2.4.1. Overview
- 16.2.4.2. Products
- 16.2.4.3. SWOT Analysis
- 16.2.4.4. Recent Developments
- 16.2.4.5. Financials (Based on Availability)
- 16.2.5 Cardinal Health Inc
- 16.2.5.1. Overview
- 16.2.5.2. Products
- 16.2.5.3. SWOT Analysis
- 16.2.5.4. Recent Developments
- 16.2.5.5. Financials (Based on Availability)
- 16.2.6 Medtronic PLC
- 16.2.6.1. Overview
- 16.2.6.2. Products
- 16.2.6.3. SWOT Analysis
- 16.2.6.4. Recent Developments
- 16.2.6.5. Financials (Based on Availability)
- 16.2.7 Orthofix Medical Inc
- 16.2.7.1. Overview
- 16.2.7.2. Products
- 16.2.7.3. SWOT Analysis
- 16.2.7.4. Recent Developments
- 16.2.7.5. Financials (Based on Availability)
- 16.2.8 Conmed Corporation
- 16.2.8.1. Overview
- 16.2.8.2. Products
- 16.2.8.3. SWOT Analysis
- 16.2.8.4. Recent Developments
- 16.2.8.5. Financials (Based on Availability)
- 16.2.9 Johnson & Johnson
- 16.2.9.1. Overview
- 16.2.9.2. Products
- 16.2.9.3. SWOT Analysis
- 16.2.9.4. Recent Developments
- 16.2.9.5. Financials (Based on Availability)
- 16.2.10 Stryker Corporation
- 16.2.10.1. Overview
- 16.2.10.2. Products
- 16.2.10.3. SWOT Analysis
- 16.2.10.4. Recent Developments
- 16.2.10.5. Financials (Based on Availability)
- 16.2.11 Zimmer Biomet
- 16.2.11.1. Overview
- 16.2.11.2. Products
- 16.2.11.3. SWOT Analysis
- 16.2.11.4. Recent Developments
- 16.2.11.5. Financials (Based on Availability)
- 16.2.1 Smith & Nephew PLC
List of Figures
- Figure 1: Global Orthopedic Trauma Devices Industry Revenue Breakdown (Million, %) by Region 2024 & 2032
- Figure 2: Global Orthopedic Trauma Devices Industry Volume Breakdown (K Unit, %) by Region 2024 & 2032
- Figure 3: North America Orthopedic Trauma Devices Industry Revenue (Million), by Country 2024 & 2032
- Figure 4: North America Orthopedic Trauma Devices Industry Volume (K Unit), by Country 2024 & 2032
- Figure 5: North America Orthopedic Trauma Devices Industry Revenue Share (%), by Country 2024 & 2032
- Figure 6: North America Orthopedic Trauma Devices Industry Volume Share (%), by Country 2024 & 2032
- Figure 7: Europe Orthopedic Trauma Devices Industry Revenue (Million), by Country 2024 & 2032
- Figure 8: Europe Orthopedic Trauma Devices Industry Volume (K Unit), by Country 2024 & 2032
- Figure 9: Europe Orthopedic Trauma Devices Industry Revenue Share (%), by Country 2024 & 2032
- Figure 10: Europe Orthopedic Trauma Devices Industry Volume Share (%), by Country 2024 & 2032
- Figure 11: Asia Pacific Orthopedic Trauma Devices Industry Revenue (Million), by Country 2024 & 2032
- Figure 12: Asia Pacific Orthopedic Trauma Devices Industry Volume (K Unit), by Country 2024 & 2032
- Figure 13: Asia Pacific Orthopedic Trauma Devices Industry Revenue Share (%), by Country 2024 & 2032
- Figure 14: Asia Pacific Orthopedic Trauma Devices Industry Volume Share (%), by Country 2024 & 2032
- Figure 15: Middle East and Africa Orthopedic Trauma Devices Industry Revenue (Million), by Country 2024 & 2032
- Figure 16: Middle East and Africa Orthopedic Trauma Devices Industry Volume (K Unit), by Country 2024 & 2032
- Figure 17: Middle East and Africa Orthopedic Trauma Devices Industry Revenue Share (%), by Country 2024 & 2032
- Figure 18: Middle East and Africa Orthopedic Trauma Devices Industry Volume Share (%), by Country 2024 & 2032
- Figure 19: South America Orthopedic Trauma Devices Industry Revenue (Million), by Country 2024 & 2032
- Figure 20: South America Orthopedic Trauma Devices Industry Volume (K Unit), by Country 2024 & 2032
- Figure 21: South America Orthopedic Trauma Devices Industry Revenue Share (%), by Country 2024 & 2032
- Figure 22: South America Orthopedic Trauma Devices Industry Volume Share (%), by Country 2024 & 2032
- Figure 23: North America Orthopedic Trauma Devices Industry Revenue (Million), by Type 2024 & 2032
- Figure 24: North America Orthopedic Trauma Devices Industry Volume (K Unit), by Type 2024 & 2032
- Figure 25: North America Orthopedic Trauma Devices Industry Revenue Share (%), by Type 2024 & 2032
- Figure 26: North America Orthopedic Trauma Devices Industry Volume Share (%), by Type 2024 & 2032
- Figure 27: North America Orthopedic Trauma Devices Industry Revenue (Million), by Surgical Site 2024 & 2032
- Figure 28: North America Orthopedic Trauma Devices Industry Volume (K Unit), by Surgical Site 2024 & 2032
- Figure 29: North America Orthopedic Trauma Devices Industry Revenue Share (%), by Surgical Site 2024 & 2032
- Figure 30: North America Orthopedic Trauma Devices Industry Volume Share (%), by Surgical Site 2024 & 2032
- Figure 31: North America Orthopedic Trauma Devices Industry Revenue (Million), by End User 2024 & 2032
- Figure 32: North America Orthopedic Trauma Devices Industry Volume (K Unit), by End User 2024 & 2032
- Figure 33: North America Orthopedic Trauma Devices Industry Revenue Share (%), by End User 2024 & 2032
- Figure 34: North America Orthopedic Trauma Devices Industry Volume Share (%), by End User 2024 & 2032
- Figure 35: North America Orthopedic Trauma Devices Industry Revenue (Million), by Country 2024 & 2032
- Figure 36: North America Orthopedic Trauma Devices Industry Volume (K Unit), by Country 2024 & 2032
- Figure 37: North America Orthopedic Trauma Devices Industry Revenue Share (%), by Country 2024 & 2032
- Figure 38: North America Orthopedic Trauma Devices Industry Volume Share (%), by Country 2024 & 2032
- Figure 39: Europe Orthopedic Trauma Devices Industry Revenue (Million), by Type 2024 & 2032
- Figure 40: Europe Orthopedic Trauma Devices Industry Volume (K Unit), by Type 2024 & 2032
- Figure 41: Europe Orthopedic Trauma Devices Industry Revenue Share (%), by Type 2024 & 2032
- Figure 42: Europe Orthopedic Trauma Devices Industry Volume Share (%), by Type 2024 & 2032
- Figure 43: Europe Orthopedic Trauma Devices Industry Revenue (Million), by Surgical Site 2024 & 2032
- Figure 44: Europe Orthopedic Trauma Devices Industry Volume (K Unit), by Surgical Site 2024 & 2032
- Figure 45: Europe Orthopedic Trauma Devices Industry Revenue Share (%), by Surgical Site 2024 & 2032
- Figure 46: Europe Orthopedic Trauma Devices Industry Volume Share (%), by Surgical Site 2024 & 2032
- Figure 47: Europe Orthopedic Trauma Devices Industry Revenue (Million), by End User 2024 & 2032
- Figure 48: Europe Orthopedic Trauma Devices Industry Volume (K Unit), by End User 2024 & 2032
- Figure 49: Europe Orthopedic Trauma Devices Industry Revenue Share (%), by End User 2024 & 2032
- Figure 50: Europe Orthopedic Trauma Devices Industry Volume Share (%), by End User 2024 & 2032
- Figure 51: Europe Orthopedic Trauma Devices Industry Revenue (Million), by Country 2024 & 2032
- Figure 52: Europe Orthopedic Trauma Devices Industry Volume (K Unit), by Country 2024 & 2032
- Figure 53: Europe Orthopedic Trauma Devices Industry Revenue Share (%), by Country 2024 & 2032
- Figure 54: Europe Orthopedic Trauma Devices Industry Volume Share (%), by Country 2024 & 2032
- Figure 55: Asia Pacific Orthopedic Trauma Devices Industry Revenue (Million), by Type 2024 & 2032
- Figure 56: Asia Pacific Orthopedic Trauma Devices Industry Volume (K Unit), by Type 2024 & 2032
- Figure 57: Asia Pacific Orthopedic Trauma Devices Industry Revenue Share (%), by Type 2024 & 2032
- Figure 58: Asia Pacific Orthopedic Trauma Devices Industry Volume Share (%), by Type 2024 & 2032
- Figure 59: Asia Pacific Orthopedic Trauma Devices Industry Revenue (Million), by Surgical Site 2024 & 2032
- Figure 60: Asia Pacific Orthopedic Trauma Devices Industry Volume (K Unit), by Surgical Site 2024 & 2032
- Figure 61: Asia Pacific Orthopedic Trauma Devices Industry Revenue Share (%), by Surgical Site 2024 & 2032
- Figure 62: Asia Pacific Orthopedic Trauma Devices Industry Volume Share (%), by Surgical Site 2024 & 2032
- Figure 63: Asia Pacific Orthopedic Trauma Devices Industry Revenue (Million), by End User 2024 & 2032
- Figure 64: Asia Pacific Orthopedic Trauma Devices Industry Volume (K Unit), by End User 2024 & 2032
- Figure 65: Asia Pacific Orthopedic Trauma Devices Industry Revenue Share (%), by End User 2024 & 2032
- Figure 66: Asia Pacific Orthopedic Trauma Devices Industry Volume Share (%), by End User 2024 & 2032
- Figure 67: Asia Pacific Orthopedic Trauma Devices Industry Revenue (Million), by Country 2024 & 2032
- Figure 68: Asia Pacific Orthopedic Trauma Devices Industry Volume (K Unit), by Country 2024 & 2032
- Figure 69: Asia Pacific Orthopedic Trauma Devices Industry Revenue Share (%), by Country 2024 & 2032
- Figure 70: Asia Pacific Orthopedic Trauma Devices Industry Volume Share (%), by Country 2024 & 2032
- Figure 71: Middle East and Africa Orthopedic Trauma Devices Industry Revenue (Million), by Type 2024 & 2032
- Figure 72: Middle East and Africa Orthopedic Trauma Devices Industry Volume (K Unit), by Type 2024 & 2032
- Figure 73: Middle East and Africa Orthopedic Trauma Devices Industry Revenue Share (%), by Type 2024 & 2032
- Figure 74: Middle East and Africa Orthopedic Trauma Devices Industry Volume Share (%), by Type 2024 & 2032
- Figure 75: Middle East and Africa Orthopedic Trauma Devices Industry Revenue (Million), by Surgical Site 2024 & 2032
- Figure 76: Middle East and Africa Orthopedic Trauma Devices Industry Volume (K Unit), by Surgical Site 2024 & 2032
- Figure 77: Middle East and Africa Orthopedic Trauma Devices Industry Revenue Share (%), by Surgical Site 2024 & 2032
- Figure 78: Middle East and Africa Orthopedic Trauma Devices Industry Volume Share (%), by Surgical Site 2024 & 2032
- Figure 79: Middle East and Africa Orthopedic Trauma Devices Industry Revenue (Million), by End User 2024 & 2032
- Figure 80: Middle East and Africa Orthopedic Trauma Devices Industry Volume (K Unit), by End User 2024 & 2032
- Figure 81: Middle East and Africa Orthopedic Trauma Devices Industry Revenue Share (%), by End User 2024 & 2032
- Figure 82: Middle East and Africa Orthopedic Trauma Devices Industry Volume Share (%), by End User 2024 & 2032
- Figure 83: Middle East and Africa Orthopedic Trauma Devices Industry Revenue (Million), by Country 2024 & 2032
- Figure 84: Middle East and Africa Orthopedic Trauma Devices Industry Volume (K Unit), by Country 2024 & 2032
- Figure 85: Middle East and Africa Orthopedic Trauma Devices Industry Revenue Share (%), by Country 2024 & 2032
- Figure 86: Middle East and Africa Orthopedic Trauma Devices Industry Volume Share (%), by Country 2024 & 2032
- Figure 87: South America Orthopedic Trauma Devices Industry Revenue (Million), by Type 2024 & 2032
- Figure 88: South America Orthopedic Trauma Devices Industry Volume (K Unit), by Type 2024 & 2032
- Figure 89: South America Orthopedic Trauma Devices Industry Revenue Share (%), by Type 2024 & 2032
- Figure 90: South America Orthopedic Trauma Devices Industry Volume Share (%), by Type 2024 & 2032
- Figure 91: South America Orthopedic Trauma Devices Industry Revenue (Million), by Surgical Site 2024 & 2032
- Figure 92: South America Orthopedic Trauma Devices Industry Volume (K Unit), by Surgical Site 2024 & 2032
- Figure 93: South America Orthopedic Trauma Devices Industry Revenue Share (%), by Surgical Site 2024 & 2032
- Figure 94: South America Orthopedic Trauma Devices Industry Volume Share (%), by Surgical Site 2024 & 2032
- Figure 95: South America Orthopedic Trauma Devices Industry Revenue (Million), by End User 2024 & 2032
- Figure 96: South America Orthopedic Trauma Devices Industry Volume (K Unit), by End User 2024 & 2032
- Figure 97: South America Orthopedic Trauma Devices Industry Revenue Share (%), by End User 2024 & 2032
- Figure 98: South America Orthopedic Trauma Devices Industry Volume Share (%), by End User 2024 & 2032
- Figure 99: South America Orthopedic Trauma Devices Industry Revenue (Million), by Country 2024 & 2032
- Figure 100: South America Orthopedic Trauma Devices Industry Volume (K Unit), by Country 2024 & 2032
- Figure 101: South America Orthopedic Trauma Devices Industry Revenue Share (%), by Country 2024 & 2032
- Figure 102: South America Orthopedic Trauma Devices Industry Volume Share (%), by Country 2024 & 2032
List of Tables
- Table 1: Global Orthopedic Trauma Devices Industry Revenue Million Forecast, by Region 2019 & 2032
- Table 2: Global Orthopedic Trauma Devices Industry Volume K Unit Forecast, by Region 2019 & 2032
- Table 3: Global Orthopedic Trauma Devices Industry Revenue Million Forecast, by Type 2019 & 2032
- Table 4: Global Orthopedic Trauma Devices Industry Volume K Unit Forecast, by Type 2019 & 2032
- Table 5: Global Orthopedic Trauma Devices Industry Revenue Million Forecast, by Surgical Site 2019 & 2032
- Table 6: Global Orthopedic Trauma Devices Industry Volume K Unit Forecast, by Surgical Site 2019 & 2032
- Table 7: Global Orthopedic Trauma Devices Industry Revenue Million Forecast, by End User 2019 & 2032
- Table 8: Global Orthopedic Trauma Devices Industry Volume K Unit Forecast, by End User 2019 & 2032
- Table 9: Global Orthopedic Trauma Devices Industry Revenue Million Forecast, by Region 2019 & 2032
- Table 10: Global Orthopedic Trauma Devices Industry Volume K Unit Forecast, by Region 2019 & 2032
- Table 11: Global Orthopedic Trauma Devices Industry Revenue Million Forecast, by Country 2019 & 2032
- Table 12: Global Orthopedic Trauma Devices Industry Volume K Unit Forecast, by Country 2019 & 2032
- Table 13: Global Orthopedic Trauma Devices Industry Revenue Million Forecast, by Country 2019 & 2032
- Table 14: Global Orthopedic Trauma Devices Industry Volume K Unit Forecast, by Country 2019 & 2032
- Table 15: Global Orthopedic Trauma Devices Industry Revenue Million Forecast, by Country 2019 & 2032
- Table 16: Global Orthopedic Trauma Devices Industry Volume K Unit Forecast, by Country 2019 & 2032
- Table 17: Global Orthopedic Trauma Devices Industry Revenue Million Forecast, by Country 2019 & 2032
- Table 18: Global Orthopedic Trauma Devices Industry Volume K Unit Forecast, by Country 2019 & 2032
- Table 19: Global Orthopedic Trauma Devices Industry Revenue Million Forecast, by Country 2019 & 2032
- Table 20: Global Orthopedic Trauma Devices Industry Volume K Unit Forecast, by Country 2019 & 2032
- Table 21: Global Orthopedic Trauma Devices Industry Revenue Million Forecast, by Type 2019 & 2032
- Table 22: Global Orthopedic Trauma Devices Industry Volume K Unit Forecast, by Type 2019 & 2032
- Table 23: Global Orthopedic Trauma Devices Industry Revenue Million Forecast, by Surgical Site 2019 & 2032
- Table 24: Global Orthopedic Trauma Devices Industry Volume K Unit Forecast, by Surgical Site 2019 & 2032
- Table 25: Global Orthopedic Trauma Devices Industry Revenue Million Forecast, by End User 2019 & 2032
- Table 26: Global Orthopedic Trauma Devices Industry Volume K Unit Forecast, by End User 2019 & 2032
- Table 27: Global Orthopedic Trauma Devices Industry Revenue Million Forecast, by Country 2019 & 2032
- Table 28: Global Orthopedic Trauma Devices Industry Volume K Unit Forecast, by Country 2019 & 2032
- Table 29: United States Orthopedic Trauma Devices Industry Revenue (Million) Forecast, by Application 2019 & 2032
- Table 30: United States Orthopedic Trauma Devices Industry Volume (K Unit) Forecast, by Application 2019 & 2032
- Table 31: Canada Orthopedic Trauma Devices Industry Revenue (Million) Forecast, by Application 2019 & 2032
- Table 32: Canada Orthopedic Trauma Devices Industry Volume (K Unit) Forecast, by Application 2019 & 2032
- Table 33: Mexico Orthopedic Trauma Devices Industry Revenue (Million) Forecast, by Application 2019 & 2032
- Table 34: Mexico Orthopedic Trauma Devices Industry Volume (K Unit) Forecast, by Application 2019 & 2032
- Table 35: Global Orthopedic Trauma Devices Industry Revenue Million Forecast, by Type 2019 & 2032
- Table 36: Global Orthopedic Trauma Devices Industry Volume K Unit Forecast, by Type 2019 & 2032
- Table 37: Global Orthopedic Trauma Devices Industry Revenue Million Forecast, by Surgical Site 2019 & 2032
- Table 38: Global Orthopedic Trauma Devices Industry Volume K Unit Forecast, by Surgical Site 2019 & 2032
- Table 39: Global Orthopedic Trauma Devices Industry Revenue Million Forecast, by End User 2019 & 2032
- Table 40: Global Orthopedic Trauma Devices Industry Volume K Unit Forecast, by End User 2019 & 2032
- Table 41: Global Orthopedic Trauma Devices Industry Revenue Million Forecast, by Country 2019 & 2032
- Table 42: Global Orthopedic Trauma Devices Industry Volume K Unit Forecast, by Country 2019 & 2032
- Table 43: Germany Orthopedic Trauma Devices Industry Revenue (Million) Forecast, by Application 2019 & 2032
- Table 44: Germany Orthopedic Trauma Devices Industry Volume (K Unit) Forecast, by Application 2019 & 2032
- Table 45: United Kingdom Orthopedic Trauma Devices Industry Revenue (Million) Forecast, by Application 2019 & 2032
- Table 46: United Kingdom Orthopedic Trauma Devices Industry Volume (K Unit) Forecast, by Application 2019 & 2032
- Table 47: France Orthopedic Trauma Devices Industry Revenue (Million) Forecast, by Application 2019 & 2032
- Table 48: France Orthopedic Trauma Devices Industry Volume (K Unit) Forecast, by Application 2019 & 2032
- Table 49: Italy Orthopedic Trauma Devices Industry Revenue (Million) Forecast, by Application 2019 & 2032
- Table 50: Italy Orthopedic Trauma Devices Industry Volume (K Unit) Forecast, by Application 2019 & 2032
- Table 51: Spain Orthopedic Trauma Devices Industry Revenue (Million) Forecast, by Application 2019 & 2032
- Table 52: Spain Orthopedic Trauma Devices Industry Volume (K Unit) Forecast, by Application 2019 & 2032
- Table 53: Rest of Europe Orthopedic Trauma Devices Industry Revenue (Million) Forecast, by Application 2019 & 2032
- Table 54: Rest of Europe Orthopedic Trauma Devices Industry Volume (K Unit) Forecast, by Application 2019 & 2032
- Table 55: Global Orthopedic Trauma Devices Industry Revenue Million Forecast, by Type 2019 & 2032
- Table 56: Global Orthopedic Trauma Devices Industry Volume K Unit Forecast, by Type 2019 & 2032
- Table 57: Global Orthopedic Trauma Devices Industry Revenue Million Forecast, by Surgical Site 2019 & 2032
- Table 58: Global Orthopedic Trauma Devices Industry Volume K Unit Forecast, by Surgical Site 2019 & 2032
- Table 59: Global Orthopedic Trauma Devices Industry Revenue Million Forecast, by End User 2019 & 2032
- Table 60: Global Orthopedic Trauma Devices Industry Volume K Unit Forecast, by End User 2019 & 2032
- Table 61: Global Orthopedic Trauma Devices Industry Revenue Million Forecast, by Country 2019 & 2032
- Table 62: Global Orthopedic Trauma Devices Industry Volume K Unit Forecast, by Country 2019 & 2032
- Table 63: China Orthopedic Trauma Devices Industry Revenue (Million) Forecast, by Application 2019 & 2032
- Table 64: China Orthopedic Trauma Devices Industry Volume (K Unit) Forecast, by Application 2019 & 2032
- Table 65: Japan Orthopedic Trauma Devices Industry Revenue (Million) Forecast, by Application 2019 & 2032
- Table 66: Japan Orthopedic Trauma Devices Industry Volume (K Unit) Forecast, by Application 2019 & 2032
- Table 67: India Orthopedic Trauma Devices Industry Revenue (Million) Forecast, by Application 2019 & 2032
- Table 68: India Orthopedic Trauma Devices Industry Volume (K Unit) Forecast, by Application 2019 & 2032
- Table 69: Australia Orthopedic Trauma Devices Industry Revenue (Million) Forecast, by Application 2019 & 2032
- Table 70: Australia Orthopedic Trauma Devices Industry Volume (K Unit) Forecast, by Application 2019 & 2032
- Table 71: South Korea Orthopedic Trauma Devices Industry Revenue (Million) Forecast, by Application 2019 & 2032
- Table 72: South Korea Orthopedic Trauma Devices Industry Volume (K Unit) Forecast, by Application 2019 & 2032
- Table 73: Rest of Asia Pacific Orthopedic Trauma Devices Industry Revenue (Million) Forecast, by Application 2019 & 2032
- Table 74: Rest of Asia Pacific Orthopedic Trauma Devices Industry Volume (K Unit) Forecast, by Application 2019 & 2032
- Table 75: Global Orthopedic Trauma Devices Industry Revenue Million Forecast, by Type 2019 & 2032
- Table 76: Global Orthopedic Trauma Devices Industry Volume K Unit Forecast, by Type 2019 & 2032
- Table 77: Global Orthopedic Trauma Devices Industry Revenue Million Forecast, by Surgical Site 2019 & 2032
- Table 78: Global Orthopedic Trauma Devices Industry Volume K Unit Forecast, by Surgical Site 2019 & 2032
- Table 79: Global Orthopedic Trauma Devices Industry Revenue Million Forecast, by End User 2019 & 2032
- Table 80: Global Orthopedic Trauma Devices Industry Volume K Unit Forecast, by End User 2019 & 2032
- Table 81: Global Orthopedic Trauma Devices Industry Revenue Million Forecast, by Country 2019 & 2032
- Table 82: Global Orthopedic Trauma Devices Industry Volume K Unit Forecast, by Country 2019 & 2032
- Table 83: GCC Orthopedic Trauma Devices Industry Revenue (Million) Forecast, by Application 2019 & 2032
- Table 84: GCC Orthopedic Trauma Devices Industry Volume (K Unit) Forecast, by Application 2019 & 2032
- Table 85: South Africa Orthopedic Trauma Devices Industry Revenue (Million) Forecast, by Application 2019 & 2032
- Table 86: South Africa Orthopedic Trauma Devices Industry Volume (K Unit) Forecast, by Application 2019 & 2032
- Table 87: Rest of Middle East and Africa Orthopedic Trauma Devices Industry Revenue (Million) Forecast, by Application 2019 & 2032
- Table 88: Rest of Middle East and Africa Orthopedic Trauma Devices Industry Volume (K Unit) Forecast, by Application 2019 & 2032
- Table 89: Global Orthopedic Trauma Devices Industry Revenue Million Forecast, by Type 2019 & 2032
- Table 90: Global Orthopedic Trauma Devices Industry Volume K Unit Forecast, by Type 2019 & 2032
- Table 91: Global Orthopedic Trauma Devices Industry Revenue Million Forecast, by Surgical Site 2019 & 2032
- Table 92: Global Orthopedic Trauma Devices Industry Volume K Unit Forecast, by Surgical Site 2019 & 2032
- Table 93: Global Orthopedic Trauma Devices Industry Revenue Million Forecast, by End User 2019 & 2032
- Table 94: Global Orthopedic Trauma Devices Industry Volume K Unit Forecast, by End User 2019 & 2032
- Table 95: Global Orthopedic Trauma Devices Industry Revenue Million Forecast, by Country 2019 & 2032
- Table 96: Global Orthopedic Trauma Devices Industry Volume K Unit Forecast, by Country 2019 & 2032
- Table 97: Brazil Orthopedic Trauma Devices Industry Revenue (Million) Forecast, by Application 2019 & 2032
- Table 98: Brazil Orthopedic Trauma Devices Industry Volume (K Unit) Forecast, by Application 2019 & 2032
- Table 99: Argentina Orthopedic Trauma Devices Industry Revenue (Million) Forecast, by Application 2019 & 2032
- Table 100: Argentina Orthopedic Trauma Devices Industry Volume (K Unit) Forecast, by Application 2019 & 2032
- Table 101: Rest of South America Orthopedic Trauma Devices Industry Revenue (Million) Forecast, by Application 2019 & 2032
- Table 102: Rest of South America Orthopedic Trauma Devices Industry Volume (K Unit) Forecast, by Application 2019 & 2032
Frequently Asked Questions
1. What is the projected Compound Annual Growth Rate (CAGR) of the Orthopedic Trauma Devices Industry?
The projected CAGR is approximately 6.50%.
2. Which companies are prominent players in the Orthopedic Trauma Devices Industry?
Key companies in the market include Smith & Nephew PLC, Arthrex Inc, Braun Melsungen AG, Invibio Ltd, Cardinal Health Inc, Medtronic PLC, Orthofix Medical Inc, Conmed Corporation, Johnson & Johnson, Stryker Corporation, Zimmer Biomet.
3. What are the main segments of the Orthopedic Trauma Devices Industry?
The market segments include Type, Surgical Site, End User.
4. Can you provide details about the market size?
The market size is estimated to be USD XX Million as of 2022.
5. What are some drivers contributing to market growth?
Growing Burden of Bone Degenerative Diseases; Increasing Number of Road Accidents; Technological Advancements in Medical Devices.
6. What are the notable trends driving market growth?
Circular Fixators Segment is Expected to Hold a Major Share in the Trauma Fixation Devices Market.
7. Are there any restraints impacting market growth?
Lack of Trained Professionals; Stringent Regulatory Issues.
8. Can you provide examples of recent developments in the market?
In October 2020, DePuy Synthes (Johnson & Johnson) introduced the 'FIBULINK Syndesmosis Repair System' in the United States. The device is designed to address traumatic injuries to the syndesmosis.
9. What pricing options are available for accessing the report?
Pricing options include single-user, multi-user, and enterprise licenses priced at USD 4750, USD 5250, and USD 8750 respectively.
10. Is the market size provided in terms of value or volume?
The market size is provided in terms of value, measured in Million and volume, measured in K Unit.
11. Are there any specific market keywords associated with the report?
Yes, the market keyword associated with the report is "Orthopedic Trauma Devices Industry," which aids in identifying and referencing the specific market segment covered.
12. How do I determine which pricing option suits my needs best?
The pricing options vary based on user requirements and access needs. Individual users may opt for single-user licenses, while businesses requiring broader access may choose multi-user or enterprise licenses for cost-effective access to the report.
13. Are there any additional resources or data provided in the Orthopedic Trauma Devices Industry report?
While the report offers comprehensive insights, it's advisable to review the specific contents or supplementary materials provided to ascertain if additional resources or data are available.
14. How can I stay updated on further developments or reports in the Orthopedic Trauma Devices Industry?
To stay informed about further developments, trends, and reports in the Orthopedic Trauma Devices Industry, consider subscribing to industry newsletters, following relevant companies and organizations, or regularly checking reputable industry news sources and publications.
Methodology
Step 1 - Identification of Relevant Samples Size from Population Database


Step 2 - Approaches for Defining Global Market Size (Value, Volume* & Price*)

Note*: In applicable scenarios
Step 3 - Data Sources
Primary Research
- Web Analytics
- Survey Reports
- Research Institute
- Latest Research Reports
- Opinion Leaders
Secondary Research
- Annual Reports
- White Paper
- Latest Press Release
- Industry Association
- Paid Database
- Investor Presentations

Step 4 - Data Triangulation
Involves using different sources of information in order to increase the validity of a study
These sources are likely to be stakeholders in a program - participants, other researchers, program staff, other community members, and so on.
Then we put all data in single framework & apply various statistical tools to find out the dynamic on the market.
During the analysis stage, feedback from the stakeholder groups would be compared to determine areas of agreement as well as areas of divergence
