

Key Insights
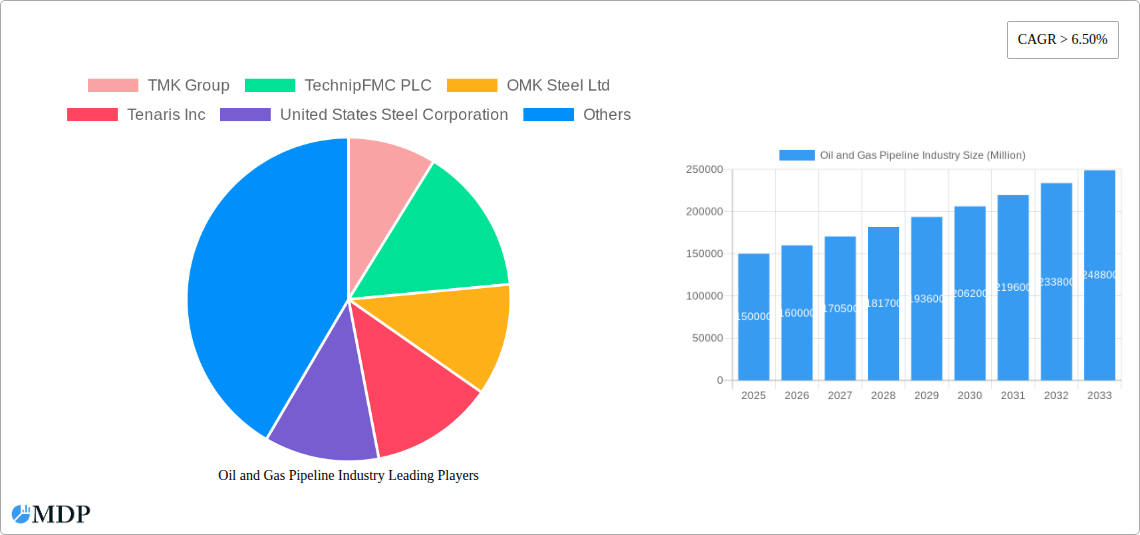
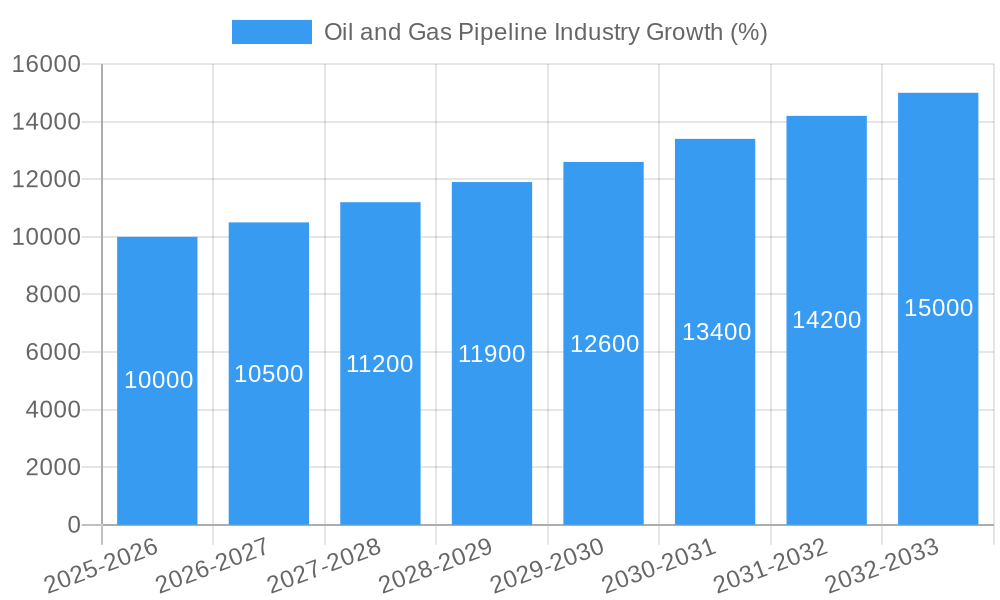
The global oil and gas pipeline industry is experiencing robust growth, driven by increasing energy demand, particularly in developing economies, and the continued reliance on fossil fuels for power generation and transportation. A compound annual growth rate (CAGR) exceeding 6.50% indicates a significant expansion of the market, projected to reach substantial value by 2033. Key drivers include the expansion of existing pipeline networks to accommodate growing energy consumption, the development of new pipeline infrastructure in emerging markets, and government investments in energy infrastructure projects. Trends such as the adoption of advanced materials for pipeline construction (enhancing durability and lifespan), the increasing implementation of smart pipeline technologies (for leak detection, monitoring, and predictive maintenance), and a growing focus on pipeline safety regulations contribute significantly to market growth. While environmental concerns and regulatory pressures present certain restraints, the industry is actively adapting through initiatives aimed at minimizing environmental impact and enhancing safety protocols. The market is segmented by location (onshore and offshore) and pipeline type (crude oil and gas). Onshore pipelines currently dominate the market share due to lower installation costs and easier accessibility; however, offshore pipeline projects are witnessing considerable growth fueled by offshore oil and gas exploration activities. The competitive landscape comprises major players like TMK Group, TechnipFMC PLC, OMK Steel Ltd, Tenaris Inc, and others, each leveraging their expertise in pipeline construction, materials, and services.
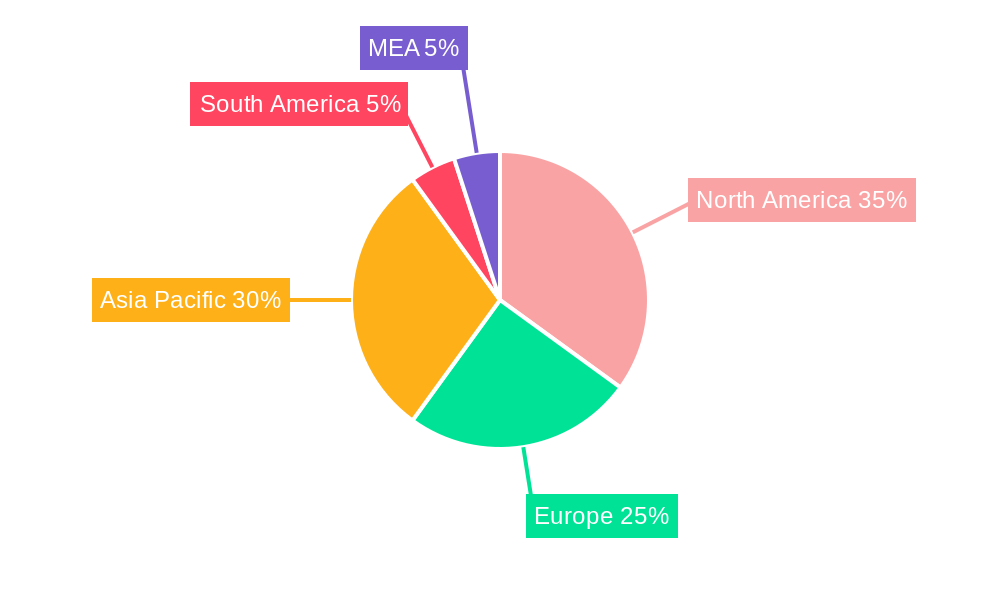
Regional market analysis reveals strong growth across North America, Europe, and Asia Pacific. North America benefits from robust domestic oil and gas production, while Asia Pacific experiences substantial growth due to rapid industrialization and rising energy demands in countries like China and India. Europe, while facing challenges from stricter environmental regulations, is seeing growth in pipeline modernization and expansion projects. The ongoing global energy transition towards renewable sources will likely influence market dynamics in the long term; however, the foreseeable future suggests continued growth for the oil and gas pipeline industry, albeit at a potentially moderating rate as renewable energy sources gain greater traction. This growth will be further shaped by geopolitical factors impacting energy trade and the continued evolution of pipeline technologies.
Oil and Gas Pipeline Industry: A Comprehensive Market Report (2019-2033)
This comprehensive report provides an in-depth analysis of the global oil and gas pipeline industry, offering actionable insights for stakeholders across the value chain. With a study period spanning 2019-2033, a base year of 2025, and a forecast period of 2025-2033, this report leverages historical data (2019-2024) to project future market trends. The report encompasses key segments, including onshore and offshore deployments, as well as crude oil and gas pipelines, and profiles leading players like TMK Group, TechnipFMC PLC, and Tenaris Inc., among others. Expect detailed analysis of market dynamics, industry trends, leading markets, product developments, growth drivers, challenges, opportunities, and a strategic outlook for the industry. This report is essential reading for investors, industry professionals, and anyone seeking a comprehensive understanding of this critical sector.
Oil and Gas Pipeline Industry Market Dynamics & Concentration
The oil and gas pipeline industry is characterized by moderate concentration, with a few major players controlling significant market share. TMK Group, TechnipFMC PLC, and Tenaris Inc. hold substantial positions, though the exact market share fluctuates depending on specific segments and regions. The industry experiences periodic mergers and acquisitions (M&A) activity, with an estimated xx number of deals completed annually in the historical period (2019-2024). Innovation is a key driver, with companies constantly seeking to improve pipeline materials, construction techniques, and monitoring technologies to enhance efficiency and safety. Regulatory frameworks vary significantly across regions, influencing costs and operational practices. Product substitutes, such as rail transport and LNG shipping, present ongoing competition, particularly for shorter distances or specialized transportation needs. End-user trends, including shifts in energy demand and growing awareness of environmental concerns, are impacting pipeline investment and infrastructure development.
Oil and Gas Pipeline Industry Industry Trends & Analysis
The oil and gas pipeline industry is experiencing a complex interplay of growth drivers and challenges. Market growth is projected to reach xx Million USD by 2033, with a Compound Annual Growth Rate (CAGR) of xx% during the forecast period (2025-2033). This growth is driven by increasing global energy demand, particularly in developing economies, and the need for efficient and reliable infrastructure to transport hydrocarbons. Technological disruptions, including the adoption of advanced materials, digitalization, and automation, are improving pipeline efficiency, safety, and longevity. However, consumer preferences are shifting towards cleaner energy sources, presenting a long-term challenge to the industry. Intense competitive dynamics among pipeline operators and contractors, along with fluctuations in commodity prices, further contribute to the complexity of market trends. Market penetration rates for advanced pipeline technologies are expected to grow from xx% in 2025 to xx% by 2033.
Leading Markets & Segments in Oil and Gas Pipeline Industry
The North American and Asia-Pacific regions currently dominate the oil and gas pipeline market. Specific countries within these regions, such as the United States, Canada, China, and India, exhibit strong growth potential due to factors including their substantial hydrocarbon reserves, expanding energy demand, and ongoing infrastructure development projects.
- Onshore Pipelines: This segment maintains the largest market share due to the extensive existing infrastructure and lower installation costs compared to offshore pipelines. Key drivers include large-scale energy projects, government investment in energy infrastructure, and growing industrial activity.
- Offshore Pipelines: Offshore pipelines are primarily utilized for deep-sea transportation of hydrocarbons. High installation costs and stringent regulatory environments limit market growth, although this segment experiences growth in areas with significant offshore reserves.
- Crude Oil Pipelines: This segment is heavily influenced by fluctuations in global crude oil prices and production levels. The demand for crude oil pipelines is expected to remain relatively strong due to persistent reliance on this fuel source.
- Gas Pipelines: This segment's growth is linked to increasing global natural gas demand. The shift towards natural gas as a cleaner-burning fuel compared to coal is driving pipeline development in regions where gas infrastructure is underdeveloped. Government policies promoting gas utilization further support growth.
Oil and Gas Pipeline Industry Product Developments
Recent product innovations focus on enhancing pipeline durability, safety, and efficiency. Advanced materials, including high-strength steels and composite pipes, are improving pipeline lifespan and reducing maintenance costs. Smart pipelines equipped with sensors and advanced monitoring systems allow for real-time leak detection and predictive maintenance, minimizing environmental risks and operational disruptions. These technological trends cater to the industry's increasing focus on safety, environmental responsibility, and cost-effectiveness.
Key Drivers of Oil and Gas Pipeline Industry Growth
The oil and gas pipeline industry's growth is fueled by several factors. Increasing global energy demand, particularly in emerging economies, drives the need for efficient hydrocarbon transportation. Government initiatives to improve energy infrastructure and support the development of hydrocarbon resources are also vital drivers. Technological advancements, such as the development of advanced materials and intelligent pipeline systems, are enhancing pipeline efficiency, safety, and longevity, further stimulating growth.
Challenges in the Oil and Gas Pipeline Industry Market
The industry faces significant challenges, including stringent regulatory environments and obtaining necessary permits. Supply chain disruptions, particularly related to steel and other key materials, can impact project timelines and costs. Furthermore, intense competition among pipeline operators and contractors adds to the pressure on margins and profitability. These challenges can lead to delays in project implementation and increased project costs. For instance, supply chain issues in 2022 contributed to xx Million USD in added project costs across the industry.
Emerging Opportunities in Oil and Gas Pipeline Industry
Significant opportunities lie in leveraging technological advancements, such as AI-powered predictive maintenance and advanced materials, to enhance efficiency and reduce operational costs. Strategic partnerships between pipeline operators, technology providers, and energy companies can unlock synergies and foster innovation. Expanding into new markets, particularly in regions experiencing rapid economic growth and increasing energy demand, presents substantial growth potential.
Leading Players in the Oil and Gas Pipeline Industry Sector
- TMK Group
- TechnipFMC PLC
- OMK Steel Ltd
- Tenaris Inc
- United States Steel Corporation
- Nippon Steel Corporation
- ChelPipe Group
- Shengli Oil & Gas Pipe Holdings Limited
- Mott Macdonald Group Ltd
Key Milestones in Oil and Gas Pipeline Industry Industry
- June 2022: Kalpataru Power Transmission Limited (KPTL) secured a contract for the construction of a steel gas pipeline for GAIL (India) Ltd.'s Mumbai-Nagpur Pipeline Project, signaling increased investment in gas infrastructure in India.
- December 2022: Argentina secured USD 689 Million in financing for a natural gas pipeline expansion in the Vaca Muerta shale region, highlighting the ongoing investment in South American energy infrastructure.
Strategic Outlook for Oil and Gas Pipeline Industry Market
The oil and gas pipeline industry is poised for continued growth, driven by global energy demand, infrastructure development, and technological advancements. Strategic opportunities exist in leveraging advanced technologies, forging strategic partnerships, and expanding into new markets. By adapting to evolving regulatory landscapes and addressing sustainability concerns, industry players can capitalize on this growth and secure a strong long-term position.
Oil and Gas Pipeline Industry Segmentation
-
1. Location of Deployment
- 1.1. Onshore
- 1.2. Offshore
-
2. Type
- 2.1. Crude Oil Pipeline
- 2.2. Gas Pipeline
Oil and Gas Pipeline Industry Segmentation By Geography
- 1. North America
- 2. Europe
- 3. Asia Pacific
- 4. South America
- 5. Middle East and Africa
Oil and Gas Pipeline Industry REPORT HIGHLIGHTS
| Aspects | Details |
|---|---|
| Study Period | 2019-2033 |
| Base Year | 2024 |
| Estimated Year | 2025 |
| Forecast Period | 2025-2033 |
| Historical Period | 2019-2024 |
| Growth Rate | CAGR of > 6.50% from 2019-2033 |
| Segmentation |
|
Table of Contents
- 1. Introduction
- 1.1. Research Scope
- 1.2. Market Segmentation
- 1.3. Research Methodology
- 1.4. Definitions and Assumptions
- 2. Executive Summary
- 2.1. Introduction
- 3. Market Dynamics
- 3.1. Introduction
- 3.2. Market Drivers
- 3.2.1. 4.; Rising Demand for Increaing Refinening Capacity4.; Increasing Investment in Downstream Sector
- 3.3. Market Restrains
- 3.3.1. 4.; Fluctuating Price of Crude Oil May Impede the Development of the Downstream Sector
- 3.4. Market Trends
- 3.4.1. The Gas Pipeline Segment to Dominate the Market
- 4. Market Factor Analysis
- 4.1. Porters Five Forces
- 4.2. Supply/Value Chain
- 4.3. PESTEL analysis
- 4.4. Market Entropy
- 4.5. Patent/Trademark Analysis
- 5. Global Oil and Gas Pipeline Industry Analysis, Insights and Forecast, 2019-2031
- 5.1. Market Analysis, Insights and Forecast - by Location of Deployment
- 5.1.1. Onshore
- 5.1.2. Offshore
- 5.2. Market Analysis, Insights and Forecast - by Type
- 5.2.1. Crude Oil Pipeline
- 5.2.2. Gas Pipeline
- 5.3. Market Analysis, Insights and Forecast - by Region
- 5.3.1. North America
- 5.3.2. Europe
- 5.3.3. Asia Pacific
- 5.3.4. South America
- 5.3.5. Middle East and Africa
- 5.1. Market Analysis, Insights and Forecast - by Location of Deployment
- 6. North America Oil and Gas Pipeline Industry Analysis, Insights and Forecast, 2019-2031
- 6.1. Market Analysis, Insights and Forecast - by Location of Deployment
- 6.1.1. Onshore
- 6.1.2. Offshore
- 6.2. Market Analysis, Insights and Forecast - by Type
- 6.2.1. Crude Oil Pipeline
- 6.2.2. Gas Pipeline
- 6.1. Market Analysis, Insights and Forecast - by Location of Deployment
- 7. Europe Oil and Gas Pipeline Industry Analysis, Insights and Forecast, 2019-2031
- 7.1. Market Analysis, Insights and Forecast - by Location of Deployment
- 7.1.1. Onshore
- 7.1.2. Offshore
- 7.2. Market Analysis, Insights and Forecast - by Type
- 7.2.1. Crude Oil Pipeline
- 7.2.2. Gas Pipeline
- 7.1. Market Analysis, Insights and Forecast - by Location of Deployment
- 8. Asia Pacific Oil and Gas Pipeline Industry Analysis, Insights and Forecast, 2019-2031
- 8.1. Market Analysis, Insights and Forecast - by Location of Deployment
- 8.1.1. Onshore
- 8.1.2. Offshore
- 8.2. Market Analysis, Insights and Forecast - by Type
- 8.2.1. Crude Oil Pipeline
- 8.2.2. Gas Pipeline
- 8.1. Market Analysis, Insights and Forecast - by Location of Deployment
- 9. South America Oil and Gas Pipeline Industry Analysis, Insights and Forecast, 2019-2031
- 9.1. Market Analysis, Insights and Forecast - by Location of Deployment
- 9.1.1. Onshore
- 9.1.2. Offshore
- 9.2. Market Analysis, Insights and Forecast - by Type
- 9.2.1. Crude Oil Pipeline
- 9.2.2. Gas Pipeline
- 9.1. Market Analysis, Insights and Forecast - by Location of Deployment
- 10. Middle East and Africa Oil and Gas Pipeline Industry Analysis, Insights and Forecast, 2019-2031
- 10.1. Market Analysis, Insights and Forecast - by Location of Deployment
- 10.1.1. Onshore
- 10.1.2. Offshore
- 10.2. Market Analysis, Insights and Forecast - by Type
- 10.2.1. Crude Oil Pipeline
- 10.2.2. Gas Pipeline
- 10.1. Market Analysis, Insights and Forecast - by Location of Deployment
- 11. North America Oil and Gas Pipeline Industry Analysis, Insights and Forecast, 2019-2031
- 11.1. Market Analysis, Insights and Forecast - By Country/Sub-region
- 11.1.1 United States
- 11.1.2 Canada
- 11.1.3 Mexico
- 12. Europe Oil and Gas Pipeline Industry Analysis, Insights and Forecast, 2019-2031
- 12.1. Market Analysis, Insights and Forecast - By Country/Sub-region
- 12.1.1 Germany
- 12.1.2 United Kingdom
- 12.1.3 France
- 12.1.4 Spain
- 12.1.5 Italy
- 12.1.6 Spain
- 12.1.7 Belgium
- 12.1.8 Netherland
- 12.1.9 Nordics
- 12.1.10 Rest of Europe
- 13. Asia Pacific Oil and Gas Pipeline Industry Analysis, Insights and Forecast, 2019-2031
- 13.1. Market Analysis, Insights and Forecast - By Country/Sub-region
- 13.1.1 China
- 13.1.2 Japan
- 13.1.3 India
- 13.1.4 South Korea
- 13.1.5 Southeast Asia
- 13.1.6 Australia
- 13.1.7 Indonesia
- 13.1.8 Phillipes
- 13.1.9 Singapore
- 13.1.10 Thailandc
- 13.1.11 Rest of Asia Pacific
- 14. South America Oil and Gas Pipeline Industry Analysis, Insights and Forecast, 2019-2031
- 14.1. Market Analysis, Insights and Forecast - By Country/Sub-region
- 14.1.1 Brazil
- 14.1.2 Argentina
- 14.1.3 Peru
- 14.1.4 Chile
- 14.1.5 Colombia
- 14.1.6 Ecuador
- 14.1.7 Venezuela
- 14.1.8 Rest of South America
- 15. MEA Oil and Gas Pipeline Industry Analysis, Insights and Forecast, 2019-2031
- 15.1. Market Analysis, Insights and Forecast - By Country/Sub-region
- 15.1.1 United Arab Emirates
- 15.1.2 Saudi Arabia
- 15.1.3 South Africa
- 15.1.4 Rest of Middle East and Africa
- 16. Competitive Analysis
- 16.1. Global Market Share Analysis 2024
- 16.2. Company Profiles
- 16.2.1 TMK Group
- 16.2.1.1. Overview
- 16.2.1.2. Products
- 16.2.1.3. SWOT Analysis
- 16.2.1.4. Recent Developments
- 16.2.1.5. Financials (Based on Availability)
- 16.2.2 TechnipFMC PLC
- 16.2.2.1. Overview
- 16.2.2.2. Products
- 16.2.2.3. SWOT Analysis
- 16.2.2.4. Recent Developments
- 16.2.2.5. Financials (Based on Availability)
- 16.2.3 OMK Steel Ltd
- 16.2.3.1. Overview
- 16.2.3.2. Products
- 16.2.3.3. SWOT Analysis
- 16.2.3.4. Recent Developments
- 16.2.3.5. Financials (Based on Availability)
- 16.2.4 Tenaris Inc
- 16.2.4.1. Overview
- 16.2.4.2. Products
- 16.2.4.3. SWOT Analysis
- 16.2.4.4. Recent Developments
- 16.2.4.5. Financials (Based on Availability)
- 16.2.5 United States Steel Corporation
- 16.2.5.1. Overview
- 16.2.5.2. Products
- 16.2.5.3. SWOT Analysis
- 16.2.5.4. Recent Developments
- 16.2.5.5. Financials (Based on Availability)
- 16.2.6 Nippon Steel Corporation
- 16.2.6.1. Overview
- 16.2.6.2. Products
- 16.2.6.3. SWOT Analysis
- 16.2.6.4. Recent Developments
- 16.2.6.5. Financials (Based on Availability)
- 16.2.7 ChelPipe Group
- 16.2.7.1. Overview
- 16.2.7.2. Products
- 16.2.7.3. SWOT Analysis
- 16.2.7.4. Recent Developments
- 16.2.7.5. Financials (Based on Availability)
- 16.2.8 Shengli Oil & Gas Pipe Holdings Limited
- 16.2.8.1. Overview
- 16.2.8.2. Products
- 16.2.8.3. SWOT Analysis
- 16.2.8.4. Recent Developments
- 16.2.8.5. Financials (Based on Availability)
- 16.2.9 Mott Macdonald Group Ltd
- 16.2.9.1. Overview
- 16.2.9.2. Products
- 16.2.9.3. SWOT Analysis
- 16.2.9.4. Recent Developments
- 16.2.9.5. Financials (Based on Availability)
- 16.2.1 TMK Group
List of Figures
- Figure 1: Global Oil and Gas Pipeline Industry Revenue Breakdown (Million, %) by Region 2024 & 2032
- Figure 2: North America Oil and Gas Pipeline Industry Revenue (Million), by Country 2024 & 2032
- Figure 3: North America Oil and Gas Pipeline Industry Revenue Share (%), by Country 2024 & 2032
- Figure 4: Europe Oil and Gas Pipeline Industry Revenue (Million), by Country 2024 & 2032
- Figure 5: Europe Oil and Gas Pipeline Industry Revenue Share (%), by Country 2024 & 2032
- Figure 6: Asia Pacific Oil and Gas Pipeline Industry Revenue (Million), by Country 2024 & 2032
- Figure 7: Asia Pacific Oil and Gas Pipeline Industry Revenue Share (%), by Country 2024 & 2032
- Figure 8: South America Oil and Gas Pipeline Industry Revenue (Million), by Country 2024 & 2032
- Figure 9: South America Oil and Gas Pipeline Industry Revenue Share (%), by Country 2024 & 2032
- Figure 10: MEA Oil and Gas Pipeline Industry Revenue (Million), by Country 2024 & 2032
- Figure 11: MEA Oil and Gas Pipeline Industry Revenue Share (%), by Country 2024 & 2032
- Figure 12: North America Oil and Gas Pipeline Industry Revenue (Million), by Location of Deployment 2024 & 2032
- Figure 13: North America Oil and Gas Pipeline Industry Revenue Share (%), by Location of Deployment 2024 & 2032
- Figure 14: North America Oil and Gas Pipeline Industry Revenue (Million), by Type 2024 & 2032
- Figure 15: North America Oil and Gas Pipeline Industry Revenue Share (%), by Type 2024 & 2032
- Figure 16: North America Oil and Gas Pipeline Industry Revenue (Million), by Country 2024 & 2032
- Figure 17: North America Oil and Gas Pipeline Industry Revenue Share (%), by Country 2024 & 2032
- Figure 18: Europe Oil and Gas Pipeline Industry Revenue (Million), by Location of Deployment 2024 & 2032
- Figure 19: Europe Oil and Gas Pipeline Industry Revenue Share (%), by Location of Deployment 2024 & 2032
- Figure 20: Europe Oil and Gas Pipeline Industry Revenue (Million), by Type 2024 & 2032
- Figure 21: Europe Oil and Gas Pipeline Industry Revenue Share (%), by Type 2024 & 2032
- Figure 22: Europe Oil and Gas Pipeline Industry Revenue (Million), by Country 2024 & 2032
- Figure 23: Europe Oil and Gas Pipeline Industry Revenue Share (%), by Country 2024 & 2032
- Figure 24: Asia Pacific Oil and Gas Pipeline Industry Revenue (Million), by Location of Deployment 2024 & 2032
- Figure 25: Asia Pacific Oil and Gas Pipeline Industry Revenue Share (%), by Location of Deployment 2024 & 2032
- Figure 26: Asia Pacific Oil and Gas Pipeline Industry Revenue (Million), by Type 2024 & 2032
- Figure 27: Asia Pacific Oil and Gas Pipeline Industry Revenue Share (%), by Type 2024 & 2032
- Figure 28: Asia Pacific Oil and Gas Pipeline Industry Revenue (Million), by Country 2024 & 2032
- Figure 29: Asia Pacific Oil and Gas Pipeline Industry Revenue Share (%), by Country 2024 & 2032
- Figure 30: South America Oil and Gas Pipeline Industry Revenue (Million), by Location of Deployment 2024 & 2032
- Figure 31: South America Oil and Gas Pipeline Industry Revenue Share (%), by Location of Deployment 2024 & 2032
- Figure 32: South America Oil and Gas Pipeline Industry Revenue (Million), by Type 2024 & 2032
- Figure 33: South America Oil and Gas Pipeline Industry Revenue Share (%), by Type 2024 & 2032
- Figure 34: South America Oil and Gas Pipeline Industry Revenue (Million), by Country 2024 & 2032
- Figure 35: South America Oil and Gas Pipeline Industry Revenue Share (%), by Country 2024 & 2032
- Figure 36: Middle East and Africa Oil and Gas Pipeline Industry Revenue (Million), by Location of Deployment 2024 & 2032
- Figure 37: Middle East and Africa Oil and Gas Pipeline Industry Revenue Share (%), by Location of Deployment 2024 & 2032
- Figure 38: Middle East and Africa Oil and Gas Pipeline Industry Revenue (Million), by Type 2024 & 2032
- Figure 39: Middle East and Africa Oil and Gas Pipeline Industry Revenue Share (%), by Type 2024 & 2032
- Figure 40: Middle East and Africa Oil and Gas Pipeline Industry Revenue (Million), by Country 2024 & 2032
- Figure 41: Middle East and Africa Oil and Gas Pipeline Industry Revenue Share (%), by Country 2024 & 2032
List of Tables
- Table 1: Global Oil and Gas Pipeline Industry Revenue Million Forecast, by Region 2019 & 2032
- Table 2: Global Oil and Gas Pipeline Industry Revenue Million Forecast, by Location of Deployment 2019 & 2032
- Table 3: Global Oil and Gas Pipeline Industry Revenue Million Forecast, by Type 2019 & 2032
- Table 4: Global Oil and Gas Pipeline Industry Revenue Million Forecast, by Region 2019 & 2032
- Table 5: Global Oil and Gas Pipeline Industry Revenue Million Forecast, by Country 2019 & 2032
- Table 6: United States Oil and Gas Pipeline Industry Revenue (Million) Forecast, by Application 2019 & 2032
- Table 7: Canada Oil and Gas Pipeline Industry Revenue (Million) Forecast, by Application 2019 & 2032
- Table 8: Mexico Oil and Gas Pipeline Industry Revenue (Million) Forecast, by Application 2019 & 2032
- Table 9: Global Oil and Gas Pipeline Industry Revenue Million Forecast, by Country 2019 & 2032
- Table 10: Germany Oil and Gas Pipeline Industry Revenue (Million) Forecast, by Application 2019 & 2032
- Table 11: United Kingdom Oil and Gas Pipeline Industry Revenue (Million) Forecast, by Application 2019 & 2032
- Table 12: France Oil and Gas Pipeline Industry Revenue (Million) Forecast, by Application 2019 & 2032
- Table 13: Spain Oil and Gas Pipeline Industry Revenue (Million) Forecast, by Application 2019 & 2032
- Table 14: Italy Oil and Gas Pipeline Industry Revenue (Million) Forecast, by Application 2019 & 2032
- Table 15: Spain Oil and Gas Pipeline Industry Revenue (Million) Forecast, by Application 2019 & 2032
- Table 16: Belgium Oil and Gas Pipeline Industry Revenue (Million) Forecast, by Application 2019 & 2032
- Table 17: Netherland Oil and Gas Pipeline Industry Revenue (Million) Forecast, by Application 2019 & 2032
- Table 18: Nordics Oil and Gas Pipeline Industry Revenue (Million) Forecast, by Application 2019 & 2032
- Table 19: Rest of Europe Oil and Gas Pipeline Industry Revenue (Million) Forecast, by Application 2019 & 2032
- Table 20: Global Oil and Gas Pipeline Industry Revenue Million Forecast, by Country 2019 & 2032
- Table 21: China Oil and Gas Pipeline Industry Revenue (Million) Forecast, by Application 2019 & 2032
- Table 22: Japan Oil and Gas Pipeline Industry Revenue (Million) Forecast, by Application 2019 & 2032
- Table 23: India Oil and Gas Pipeline Industry Revenue (Million) Forecast, by Application 2019 & 2032
- Table 24: South Korea Oil and Gas Pipeline Industry Revenue (Million) Forecast, by Application 2019 & 2032
- Table 25: Southeast Asia Oil and Gas Pipeline Industry Revenue (Million) Forecast, by Application 2019 & 2032
- Table 26: Australia Oil and Gas Pipeline Industry Revenue (Million) Forecast, by Application 2019 & 2032
- Table 27: Indonesia Oil and Gas Pipeline Industry Revenue (Million) Forecast, by Application 2019 & 2032
- Table 28: Phillipes Oil and Gas Pipeline Industry Revenue (Million) Forecast, by Application 2019 & 2032
- Table 29: Singapore Oil and Gas Pipeline Industry Revenue (Million) Forecast, by Application 2019 & 2032
- Table 30: Thailandc Oil and Gas Pipeline Industry Revenue (Million) Forecast, by Application 2019 & 2032
- Table 31: Rest of Asia Pacific Oil and Gas Pipeline Industry Revenue (Million) Forecast, by Application 2019 & 2032
- Table 32: Global Oil and Gas Pipeline Industry Revenue Million Forecast, by Country 2019 & 2032
- Table 33: Brazil Oil and Gas Pipeline Industry Revenue (Million) Forecast, by Application 2019 & 2032
- Table 34: Argentina Oil and Gas Pipeline Industry Revenue (Million) Forecast, by Application 2019 & 2032
- Table 35: Peru Oil and Gas Pipeline Industry Revenue (Million) Forecast, by Application 2019 & 2032
- Table 36: Chile Oil and Gas Pipeline Industry Revenue (Million) Forecast, by Application 2019 & 2032
- Table 37: Colombia Oil and Gas Pipeline Industry Revenue (Million) Forecast, by Application 2019 & 2032
- Table 38: Ecuador Oil and Gas Pipeline Industry Revenue (Million) Forecast, by Application 2019 & 2032
- Table 39: Venezuela Oil and Gas Pipeline Industry Revenue (Million) Forecast, by Application 2019 & 2032
- Table 40: Rest of South America Oil and Gas Pipeline Industry Revenue (Million) Forecast, by Application 2019 & 2032
- Table 41: Global Oil and Gas Pipeline Industry Revenue Million Forecast, by Country 2019 & 2032
- Table 42: United Arab Emirates Oil and Gas Pipeline Industry Revenue (Million) Forecast, by Application 2019 & 2032
- Table 43: Saudi Arabia Oil and Gas Pipeline Industry Revenue (Million) Forecast, by Application 2019 & 2032
- Table 44: South Africa Oil and Gas Pipeline Industry Revenue (Million) Forecast, by Application 2019 & 2032
- Table 45: Rest of Middle East and Africa Oil and Gas Pipeline Industry Revenue (Million) Forecast, by Application 2019 & 2032
- Table 46: Global Oil and Gas Pipeline Industry Revenue Million Forecast, by Location of Deployment 2019 & 2032
- Table 47: Global Oil and Gas Pipeline Industry Revenue Million Forecast, by Type 2019 & 2032
- Table 48: Global Oil and Gas Pipeline Industry Revenue Million Forecast, by Country 2019 & 2032
- Table 49: Global Oil and Gas Pipeline Industry Revenue Million Forecast, by Location of Deployment 2019 & 2032
- Table 50: Global Oil and Gas Pipeline Industry Revenue Million Forecast, by Type 2019 & 2032
- Table 51: Global Oil and Gas Pipeline Industry Revenue Million Forecast, by Country 2019 & 2032
- Table 52: Global Oil and Gas Pipeline Industry Revenue Million Forecast, by Location of Deployment 2019 & 2032
- Table 53: Global Oil and Gas Pipeline Industry Revenue Million Forecast, by Type 2019 & 2032
- Table 54: Global Oil and Gas Pipeline Industry Revenue Million Forecast, by Country 2019 & 2032
- Table 55: Global Oil and Gas Pipeline Industry Revenue Million Forecast, by Location of Deployment 2019 & 2032
- Table 56: Global Oil and Gas Pipeline Industry Revenue Million Forecast, by Type 2019 & 2032
- Table 57: Global Oil and Gas Pipeline Industry Revenue Million Forecast, by Country 2019 & 2032
- Table 58: Global Oil and Gas Pipeline Industry Revenue Million Forecast, by Location of Deployment 2019 & 2032
- Table 59: Global Oil and Gas Pipeline Industry Revenue Million Forecast, by Type 2019 & 2032
- Table 60: Global Oil and Gas Pipeline Industry Revenue Million Forecast, by Country 2019 & 2032
Frequently Asked Questions
1. What is the projected Compound Annual Growth Rate (CAGR) of the Oil and Gas Pipeline Industry?
The projected CAGR is approximately > 6.50%.
2. Which companies are prominent players in the Oil and Gas Pipeline Industry?
Key companies in the market include TMK Group, TechnipFMC PLC, OMK Steel Ltd, Tenaris Inc, United States Steel Corporation, Nippon Steel Corporation, ChelPipe Group, Shengli Oil & Gas Pipe Holdings Limited, Mott Macdonald Group Ltd.
3. What are the main segments of the Oil and Gas Pipeline Industry?
The market segments include Location of Deployment, Type.
4. Can you provide details about the market size?
The market size is estimated to be USD XX Million as of 2022.
5. What are some drivers contributing to market growth?
4.; Rising Demand for Increaing Refinening Capacity4.; Increasing Investment in Downstream Sector.
6. What are the notable trends driving market growth?
The Gas Pipeline Segment to Dominate the Market.
7. Are there any restraints impacting market growth?
4.; Fluctuating Price of Crude Oil May Impede the Development of the Downstream Sector.
8. Can you provide examples of recent developments in the market?
June 2022: Kalpataru Power Transmission Limited (KPTL) was awarded the laying & construction of a steel gas pipeline and terminals along with associated facilities for Section II of the Mumbai - Nagpur Pipeline Project (Part A) for GAIL (India) Ltd.
9. What pricing options are available for accessing the report?
Pricing options include single-user, multi-user, and enterprise licenses priced at USD 4750, USD 5250, and USD 8750 respectively.
10. Is the market size provided in terms of value or volume?
The market size is provided in terms of value, measured in Million.
11. Are there any specific market keywords associated with the report?
Yes, the market keyword associated with the report is "Oil and Gas Pipeline Industry," which aids in identifying and referencing the specific market segment covered.
12. How do I determine which pricing option suits my needs best?
The pricing options vary based on user requirements and access needs. Individual users may opt for single-user licenses, while businesses requiring broader access may choose multi-user or enterprise licenses for cost-effective access to the report.
13. Are there any additional resources or data provided in the Oil and Gas Pipeline Industry report?
While the report offers comprehensive insights, it's advisable to review the specific contents or supplementary materials provided to ascertain if additional resources or data are available.
14. How can I stay updated on further developments or reports in the Oil and Gas Pipeline Industry?
To stay informed about further developments, trends, and reports in the Oil and Gas Pipeline Industry, consider subscribing to industry newsletters, following relevant companies and organizations, or regularly checking reputable industry news sources and publications.
Methodology
Step 1 - Identification of Relevant Samples Size from Population Database


Step 2 - Approaches for Defining Global Market Size (Value, Volume* & Price*)

Note*: In applicable scenarios
Step 3 - Data Sources
Primary Research
- Web Analytics
- Survey Reports
- Research Institute
- Latest Research Reports
- Opinion Leaders
Secondary Research
- Annual Reports
- White Paper
- Latest Press Release
- Industry Association
- Paid Database
- Investor Presentations

Step 4 - Data Triangulation
Involves using different sources of information in order to increase the validity of a study
These sources are likely to be stakeholders in a program - participants, other researchers, program staff, other community members, and so on.
Then we put all data in single framework & apply various statistical tools to find out the dynamic on the market.
During the analysis stage, feedback from the stakeholder groups would be compared to determine areas of agreement as well as areas of divergence
