

Key Insights
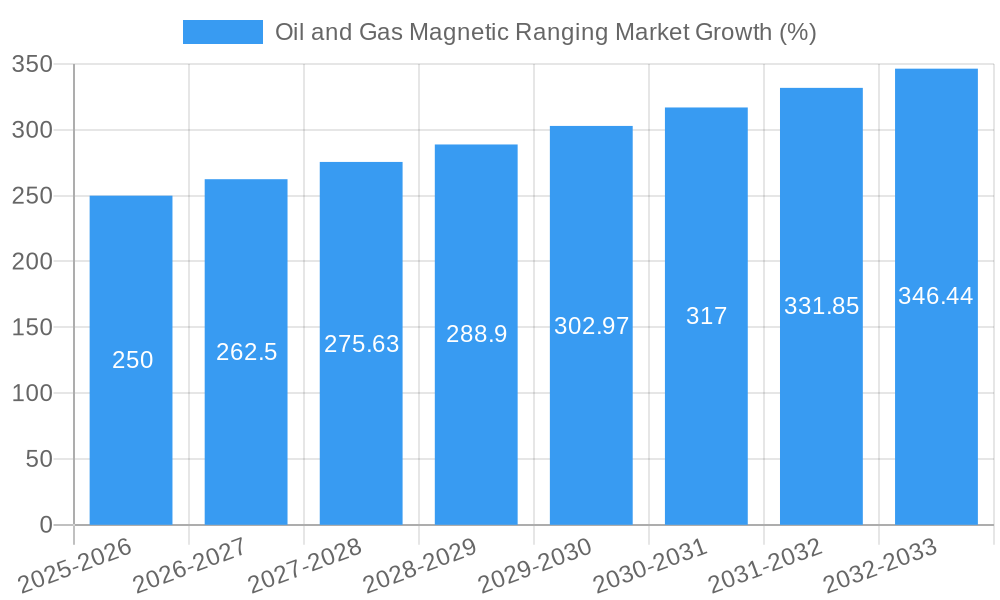
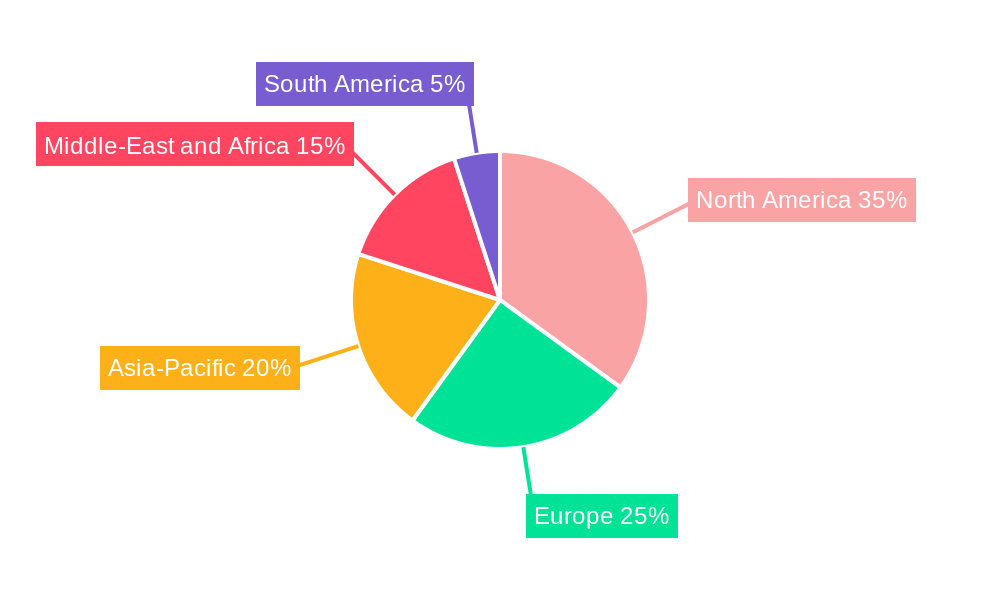
The Oil and Gas Magnetic Ranging Market is experiencing robust growth, driven by increasing demand for efficient and precise well placement and directional drilling technologies. The market's Compound Annual Growth Rate (CAGR) exceeding 5% signifies a consistently expanding market size. This growth is fueled by several key factors: the ongoing exploration and production of oil and gas reserves in challenging environments, the need for improved safety and efficiency in drilling operations, and the increasing adoption of advanced technologies like horizontal drilling and hydraulic fracturing. The market is segmented by location of deployment (offshore and onshore) and geography (North America, Europe, Asia-Pacific, Middle East & Africa, and South America). North America currently holds a significant market share, driven by robust exploration activities and established infrastructure. However, the Asia-Pacific region is projected to witness the fastest growth in the forecast period, due to rising energy demands and significant investments in oil and gas exploration and production. While the market faces certain restraints, such as fluctuating oil and gas prices and stringent regulatory requirements, technological advancements and the continuous need for precise well placement are expected to offset these challenges. The major players in the market are actively engaged in research and development, focusing on enhancing the accuracy, efficiency, and cost-effectiveness of magnetic ranging systems. This competitive landscape is further driving innovation and market expansion.
The market's segmentation offers diverse opportunities. The offshore segment is projected to experience notable growth, driven by increasing deepwater exploration and production projects. Technological innovations in magnetic ranging systems are further enhancing their utility in challenging offshore environments. Within geographical segments, regions like the Middle East and Africa, characterized by significant oil and gas reserves, present substantial growth potential. The continued exploration and development of unconventional resources, such as shale gas, are also expected to drive demand for advanced magnetic ranging systems. Over the forecast period, strategic partnerships, mergers, and acquisitions are likely to reshape the market landscape, leading to further consolidation among key players and facilitating technological advancements.

Unlock Growth Opportunities in the Booming Oil and Gas Magnetic Ranging Market: A Comprehensive Report (2019-2033)
This in-depth report provides a comprehensive analysis of the Oil and Gas Magnetic Ranging Market, offering invaluable insights for stakeholders seeking to capitalize on its significant growth potential. With a detailed study period spanning 2019-2033 (Base Year: 2025, Estimated Year: 2025, Forecast Period: 2025-2033, Historical Period: 2019-2024), this report meticulously examines market dynamics, trends, and competitive landscapes, empowering informed decision-making. The market is projected to reach xx Million by 2033, exhibiting a robust CAGR of xx%.
Oil and Gas Magnetic Ranging Market Market Dynamics & Concentration
This section analyzes the competitive landscape, innovation drivers, and regulatory influences shaping the Oil and Gas Magnetic Ranging Market. We delve into market concentration, exploring the market share held by key players such as Bartington Instruments Ltd, Weatherford International plc, GMW Associates, Gunnar Energy Services, China Oilfield Services Limited, Halliburton Company, Prime Horizontal Group of Companies, and Scientific Drilling International Inc. The report also quantifies M&A activity within the sector, providing insights into deal counts and their impact on market consolidation. Innovation drivers, including advancements in sensor technology and data analytics, are thoroughly assessed. The impact of regulatory frameworks on market growth and product development is examined, considering variations across different geographical regions. Finally, the report explores the potential impact of substitute technologies and evolving end-user preferences on market dynamics.
- Market Concentration Analysis: xx% market share controlled by top 5 players (2024).
- M&A Activity: xx deals recorded between 2019 and 2024.
- Key Regulatory Factors: Analysis of key regulations impacting market growth in North America, Europe, and Asia-Pacific.
- Substitute Technologies: Evaluation of competing technologies and their potential market impact.
Oil and Gas Magnetic Ranging Market Industry Trends & Analysis
This section provides a detailed examination of the key trends driving the Oil and Gas Magnetic Ranging Market’s growth trajectory. We analyze factors such as increasing demand for enhanced drilling accuracy, technological advancements leading to improved sensor capabilities and data processing, evolving consumer preferences towards cost-effective and efficient solutions, and the competitive dynamics among key market participants. The report quantifies market growth using CAGR and market penetration rates, providing a clear picture of market evolution and future prospects. Furthermore, we examine the impact of technological disruptions such as the rise of automation and AI in the oil and gas sector on the adoption of magnetic ranging technologies.
Leading Markets & Segments in Oil and Gas Magnetic Ranging Market
This section identifies the dominant regions and segments within the Oil and Gas Magnetic Ranging Market. We analyze market performance across North America, Europe, Asia-Pacific, the Middle East and Africa, and South America, highlighting the key drivers behind regional dominance. The analysis distinguishes between onshore and offshore deployments, assessing the unique characteristics and growth potential of each segment.
Dominant Region: North America (2024)
- Key Drivers for North America:
- Robust oil and gas exploration and production activities.
- Significant investments in technological advancements.
- Presence of major market players and robust supply chains.
Dominant Segment: Onshore (2024)
- Key Drivers for Onshore Deployment:
- Easier accessibility compared to offshore operations.
- Higher concentration of oil and gas wells.
- Lower operational costs compared to offshore.
Detailed analysis of each region and segment follows, providing granular insights into market dynamics.
Oil and Gas Magnetic Ranging Market Product Developments
Recent product innovations have focused on enhancing accuracy, reliability, and efficiency. Miniaturization of sensors, integration with advanced data analytics platforms, and the development of robust, durable systems for harsh environments are key trends. These improvements translate to improved drilling precision, reduced operational costs, and enhanced safety protocols, thereby increasing market attractiveness across various applications within the oil and gas industry.
Key Drivers of Oil and Gas Magnetic Ranging Market Growth
The Oil and Gas Magnetic Ranging Market is experiencing robust growth driven by several key factors. The increasing demand for precise well placement to optimize extraction, coupled with technological advancements resulting in higher accuracy and reliability of magnetic ranging systems, are significant contributors. Stringent government regulations promoting safety and environmental protection are also driving adoption. Furthermore, the continuous exploration and development of new oil and gas reserves are fueling demand for efficient and effective drilling technologies.
Challenges in the Oil and Gas Magnetic Ranging Market Market
Despite significant growth potential, challenges remain. These include the high initial investment costs associated with implementing magnetic ranging systems, potential interference from electromagnetic fields, and the need for skilled personnel for system operation and maintenance. These factors can impact adoption rates, particularly in smaller or less-developed regions.
Emerging Opportunities in Oil and Gas Magnetic Ranging Market
Several emerging opportunities exist for market expansion. The integration of advanced data analytics and artificial intelligence (AI) holds significant potential to improve the accuracy and efficiency of magnetic ranging systems. Strategic partnerships between technology providers and oil and gas operators can accelerate adoption, leading to streamlined workflows and optimized operations. Moreover, expanding into new geographical markets with significant oil and gas exploration activities presents further avenues for growth.
Leading Players in the Oil and Gas Magnetic Ranging Market Sector
- Bartington Instruments Ltd
- Weatherford International plc
- GMW Associates
- Gunnar Energy Services
- China Oilfield Services Limited
- Halliburton Company
- Prime Horizontal Group of Companies
- Scientific Drilling International Inc
Key Milestones in Oil and Gas Magnetic Ranging Market Industry
- 2020: Introduction of a new high-precision magnetic ranging system by Bartington Instruments Ltd.
- 2022: Acquisition of a smaller magnetic ranging technology company by Halliburton Company.
- 2023: Launch of a cloud-based data analytics platform for magnetic ranging data by a major service provider (xx).
Strategic Outlook for Oil and Gas Magnetic Ranging Market Market
The Oil and Gas Magnetic Ranging Market is poised for continued expansion, driven by ongoing technological innovation, increasing demand for precise drilling solutions, and expanding exploration activities globally. Strategic partnerships and investments in research and development will be crucial for sustained growth. Companies focusing on the development of integrated, automated solutions will be well-positioned to capitalize on future opportunities.
Oil and Gas Magnetic Ranging Market Segmentation
-
1. Location of Deployment
- 1.1. Offshore
- 1.2. Onshore
-
2. Geogrpahy
- 2.1. North America
- 2.2. Europe
- 2.3. Asia-Pacific
- 2.4. Middle-East and Africa
- 2.5. South America
Oil and Gas Magnetic Ranging Market Segmentation By Geography
-
1. North America
- 1.1. United States
- 1.2. Canada
- 1.3. Mexico
-
2. South America
- 2.1. Brazil
- 2.2. Argentina
- 2.3. Rest of South America
-
3. Europe
- 3.1. United Kingdom
- 3.2. Germany
- 3.3. France
- 3.4. Italy
- 3.5. Spain
- 3.6. Russia
- 3.7. Benelux
- 3.8. Nordics
- 3.9. Rest of Europe
-
4. Middle East & Africa
- 4.1. Turkey
- 4.2. Israel
- 4.3. GCC
- 4.4. North Africa
- 4.5. South Africa
- 4.6. Rest of Middle East & Africa
-
5. Asia Pacific
- 5.1. China
- 5.2. India
- 5.3. Japan
- 5.4. South Korea
- 5.5. ASEAN
- 5.6. Oceania
- 5.7. Rest of Asia Pacific
Oil and Gas Magnetic Ranging Market REPORT HIGHLIGHTS
| Aspects | Details |
|---|---|
| Study Period | 2019-2033 |
| Base Year | 2024 |
| Estimated Year | 2025 |
| Forecast Period | 2025-2033 |
| Historical Period | 2019-2024 |
| Growth Rate | CAGR of > 5.00% from 2019-2033 |
| Segmentation |
|
Table of Contents
- 1. Introduction
- 1.1. Research Scope
- 1.2. Market Segmentation
- 1.3. Research Methodology
- 1.4. Definitions and Assumptions
- 2. Executive Summary
- 2.1. Introduction
- 3. Market Dynamics
- 3.1. Introduction
- 3.2. Market Drivers
- 3.2.1. 4.; Increasing Production from Unconventional Sources4.; Growing Energy Demand in the Region
- 3.3. Market Restrains
- 3.3.1. 4.; Environmental Concerns
- 3.4. Market Trends
- 3.4.1. Onshore Segment to Dominate the Demand
- 4. Market Factor Analysis
- 4.1. Porters Five Forces
- 4.2. Supply/Value Chain
- 4.3. PESTEL analysis
- 4.4. Market Entropy
- 4.5. Patent/Trademark Analysis
- 5. Global Oil and Gas Magnetic Ranging Market Analysis, Insights and Forecast, 2019-2031
- 5.1. Market Analysis, Insights and Forecast - by Location of Deployment
- 5.1.1. Offshore
- 5.1.2. Onshore
- 5.2. Market Analysis, Insights and Forecast - by Geogrpahy
- 5.2.1. North America
- 5.2.2. Europe
- 5.2.3. Asia-Pacific
- 5.2.4. Middle-East and Africa
- 5.2.5. South America
- 5.3. Market Analysis, Insights and Forecast - by Region
- 5.3.1. North America
- 5.3.2. South America
- 5.3.3. Europe
- 5.3.4. Middle East & Africa
- 5.3.5. Asia Pacific
- 5.1. Market Analysis, Insights and Forecast - by Location of Deployment
- 6. North America Oil and Gas Magnetic Ranging Market Analysis, Insights and Forecast, 2019-2031
- 6.1. Market Analysis, Insights and Forecast - by Location of Deployment
- 6.1.1. Offshore
- 6.1.2. Onshore
- 6.2. Market Analysis, Insights and Forecast - by Geogrpahy
- 6.2.1. North America
- 6.2.2. Europe
- 6.2.3. Asia-Pacific
- 6.2.4. Middle-East and Africa
- 6.2.5. South America
- 6.1. Market Analysis, Insights and Forecast - by Location of Deployment
- 7. South America Oil and Gas Magnetic Ranging Market Analysis, Insights and Forecast, 2019-2031
- 7.1. Market Analysis, Insights and Forecast - by Location of Deployment
- 7.1.1. Offshore
- 7.1.2. Onshore
- 7.2. Market Analysis, Insights and Forecast - by Geogrpahy
- 7.2.1. North America
- 7.2.2. Europe
- 7.2.3. Asia-Pacific
- 7.2.4. Middle-East and Africa
- 7.2.5. South America
- 7.1. Market Analysis, Insights and Forecast - by Location of Deployment
- 8. Europe Oil and Gas Magnetic Ranging Market Analysis, Insights and Forecast, 2019-2031
- 8.1. Market Analysis, Insights and Forecast - by Location of Deployment
- 8.1.1. Offshore
- 8.1.2. Onshore
- 8.2. Market Analysis, Insights and Forecast - by Geogrpahy
- 8.2.1. North America
- 8.2.2. Europe
- 8.2.3. Asia-Pacific
- 8.2.4. Middle-East and Africa
- 8.2.5. South America
- 8.1. Market Analysis, Insights and Forecast - by Location of Deployment
- 9. Middle East & Africa Oil and Gas Magnetic Ranging Market Analysis, Insights and Forecast, 2019-2031
- 9.1. Market Analysis, Insights and Forecast - by Location of Deployment
- 9.1.1. Offshore
- 9.1.2. Onshore
- 9.2. Market Analysis, Insights and Forecast - by Geogrpahy
- 9.2.1. North America
- 9.2.2. Europe
- 9.2.3. Asia-Pacific
- 9.2.4. Middle-East and Africa
- 9.2.5. South America
- 9.1. Market Analysis, Insights and Forecast - by Location of Deployment
- 10. Asia Pacific Oil and Gas Magnetic Ranging Market Analysis, Insights and Forecast, 2019-2031
- 10.1. Market Analysis, Insights and Forecast - by Location of Deployment
- 10.1.1. Offshore
- 10.1.2. Onshore
- 10.2. Market Analysis, Insights and Forecast - by Geogrpahy
- 10.2.1. North America
- 10.2.2. Europe
- 10.2.3. Asia-Pacific
- 10.2.4. Middle-East and Africa
- 10.2.5. South America
- 10.1. Market Analysis, Insights and Forecast - by Location of Deployment
- 11. North America Oil and Gas Magnetic Ranging Market Analysis, Insights and Forecast, 2019-2031
- 11.1. Market Analysis, Insights and Forecast - By Country/Sub-region
- 11.1.1 United States
- 11.1.2 Canada
- 11.1.3 Mexico
- 12. Europe Oil and Gas Magnetic Ranging Market Analysis, Insights and Forecast, 2019-2031
- 12.1. Market Analysis, Insights and Forecast - By Country/Sub-region
- 12.1.1 Germany
- 12.1.2 United Kingdom
- 12.1.3 France
- 12.1.4 Spain
- 12.1.5 Italy
- 12.1.6 Spain
- 12.1.7 Belgium
- 12.1.8 Netherland
- 12.1.9 Nordics
- 12.1.10 Rest of Europe
- 13. Asia Pacific Oil and Gas Magnetic Ranging Market Analysis, Insights and Forecast, 2019-2031
- 13.1. Market Analysis, Insights and Forecast - By Country/Sub-region
- 13.1.1 China
- 13.1.2 Japan
- 13.1.3 India
- 13.1.4 South Korea
- 13.1.5 Southeast Asia
- 13.1.6 Australia
- 13.1.7 Indonesia
- 13.1.8 Phillipes
- 13.1.9 Singapore
- 13.1.10 Thailandc
- 13.1.11 Rest of Asia Pacific
- 14. South America Oil and Gas Magnetic Ranging Market Analysis, Insights and Forecast, 2019-2031
- 14.1. Market Analysis, Insights and Forecast - By Country/Sub-region
- 14.1.1 Brazil
- 14.1.2 Argentina
- 14.1.3 Peru
- 14.1.4 Chile
- 14.1.5 Colombia
- 14.1.6 Ecuador
- 14.1.7 Venezuela
- 14.1.8 Rest of South America
- 15. MEA Oil and Gas Magnetic Ranging Market Analysis, Insights and Forecast, 2019-2031
- 15.1. Market Analysis, Insights and Forecast - By Country/Sub-region
- 15.1.1 United Arab Emirates
- 15.1.2 Saudi Arabia
- 15.1.3 South Africa
- 15.1.4 Rest of Middle East and Africa
- 16. Competitive Analysis
- 16.1. Global Market Share Analysis 2024
- 16.2. Company Profiles
- 16.2.1 Bartington Instruments Ltd
- 16.2.1.1. Overview
- 16.2.1.2. Products
- 16.2.1.3. SWOT Analysis
- 16.2.1.4. Recent Developments
- 16.2.1.5. Financials (Based on Availability)
- 16.2.2 Weatherford International plc
- 16.2.2.1. Overview
- 16.2.2.2. Products
- 16.2.2.3. SWOT Analysis
- 16.2.2.4. Recent Developments
- 16.2.2.5. Financials (Based on Availability)
- 16.2.3 GMW Associates
- 16.2.3.1. Overview
- 16.2.3.2. Products
- 16.2.3.3. SWOT Analysis
- 16.2.3.4. Recent Developments
- 16.2.3.5. Financials (Based on Availability)
- 16.2.4 Gunnar Energy Services
- 16.2.4.1. Overview
- 16.2.4.2. Products
- 16.2.4.3. SWOT Analysis
- 16.2.4.4. Recent Developments
- 16.2.4.5. Financials (Based on Availability)
- 16.2.5 China Oilfield Services Limited
- 16.2.5.1. Overview
- 16.2.5.2. Products
- 16.2.5.3. SWOT Analysis
- 16.2.5.4. Recent Developments
- 16.2.5.5. Financials (Based on Availability)
- 16.2.6 Halliburton Company
- 16.2.6.1. Overview
- 16.2.6.2. Products
- 16.2.6.3. SWOT Analysis
- 16.2.6.4. Recent Developments
- 16.2.6.5. Financials (Based on Availability)
- 16.2.7 Prime Horizontal Group of Companies
- 16.2.7.1. Overview
- 16.2.7.2. Products
- 16.2.7.3. SWOT Analysis
- 16.2.7.4. Recent Developments
- 16.2.7.5. Financials (Based on Availability)
- 16.2.8 Scientific Drilling International Inc
- 16.2.8.1. Overview
- 16.2.8.2. Products
- 16.2.8.3. SWOT Analysis
- 16.2.8.4. Recent Developments
- 16.2.8.5. Financials (Based on Availability)
- 16.2.1 Bartington Instruments Ltd
List of Figures
- Figure 1: Global Oil and Gas Magnetic Ranging Market Revenue Breakdown (Million, %) by Region 2024 & 2032
- Figure 2: North America Oil and Gas Magnetic Ranging Market Revenue (Million), by Country 2024 & 2032
- Figure 3: North America Oil and Gas Magnetic Ranging Market Revenue Share (%), by Country 2024 & 2032
- Figure 4: Europe Oil and Gas Magnetic Ranging Market Revenue (Million), by Country 2024 & 2032
- Figure 5: Europe Oil and Gas Magnetic Ranging Market Revenue Share (%), by Country 2024 & 2032
- Figure 6: Asia Pacific Oil and Gas Magnetic Ranging Market Revenue (Million), by Country 2024 & 2032
- Figure 7: Asia Pacific Oil and Gas Magnetic Ranging Market Revenue Share (%), by Country 2024 & 2032
- Figure 8: South America Oil and Gas Magnetic Ranging Market Revenue (Million), by Country 2024 & 2032
- Figure 9: South America Oil and Gas Magnetic Ranging Market Revenue Share (%), by Country 2024 & 2032
- Figure 10: MEA Oil and Gas Magnetic Ranging Market Revenue (Million), by Country 2024 & 2032
- Figure 11: MEA Oil and Gas Magnetic Ranging Market Revenue Share (%), by Country 2024 & 2032
- Figure 12: North America Oil and Gas Magnetic Ranging Market Revenue (Million), by Location of Deployment 2024 & 2032
- Figure 13: North America Oil and Gas Magnetic Ranging Market Revenue Share (%), by Location of Deployment 2024 & 2032
- Figure 14: North America Oil and Gas Magnetic Ranging Market Revenue (Million), by Geogrpahy 2024 & 2032
- Figure 15: North America Oil and Gas Magnetic Ranging Market Revenue Share (%), by Geogrpahy 2024 & 2032
- Figure 16: North America Oil and Gas Magnetic Ranging Market Revenue (Million), by Country 2024 & 2032
- Figure 17: North America Oil and Gas Magnetic Ranging Market Revenue Share (%), by Country 2024 & 2032
- Figure 18: South America Oil and Gas Magnetic Ranging Market Revenue (Million), by Location of Deployment 2024 & 2032
- Figure 19: South America Oil and Gas Magnetic Ranging Market Revenue Share (%), by Location of Deployment 2024 & 2032
- Figure 20: South America Oil and Gas Magnetic Ranging Market Revenue (Million), by Geogrpahy 2024 & 2032
- Figure 21: South America Oil and Gas Magnetic Ranging Market Revenue Share (%), by Geogrpahy 2024 & 2032
- Figure 22: South America Oil and Gas Magnetic Ranging Market Revenue (Million), by Country 2024 & 2032
- Figure 23: South America Oil and Gas Magnetic Ranging Market Revenue Share (%), by Country 2024 & 2032
- Figure 24: Europe Oil and Gas Magnetic Ranging Market Revenue (Million), by Location of Deployment 2024 & 2032
- Figure 25: Europe Oil and Gas Magnetic Ranging Market Revenue Share (%), by Location of Deployment 2024 & 2032
- Figure 26: Europe Oil and Gas Magnetic Ranging Market Revenue (Million), by Geogrpahy 2024 & 2032
- Figure 27: Europe Oil and Gas Magnetic Ranging Market Revenue Share (%), by Geogrpahy 2024 & 2032
- Figure 28: Europe Oil and Gas Magnetic Ranging Market Revenue (Million), by Country 2024 & 2032
- Figure 29: Europe Oil and Gas Magnetic Ranging Market Revenue Share (%), by Country 2024 & 2032
- Figure 30: Middle East & Africa Oil and Gas Magnetic Ranging Market Revenue (Million), by Location of Deployment 2024 & 2032
- Figure 31: Middle East & Africa Oil and Gas Magnetic Ranging Market Revenue Share (%), by Location of Deployment 2024 & 2032
- Figure 32: Middle East & Africa Oil and Gas Magnetic Ranging Market Revenue (Million), by Geogrpahy 2024 & 2032
- Figure 33: Middle East & Africa Oil and Gas Magnetic Ranging Market Revenue Share (%), by Geogrpahy 2024 & 2032
- Figure 34: Middle East & Africa Oil and Gas Magnetic Ranging Market Revenue (Million), by Country 2024 & 2032
- Figure 35: Middle East & Africa Oil and Gas Magnetic Ranging Market Revenue Share (%), by Country 2024 & 2032
- Figure 36: Asia Pacific Oil and Gas Magnetic Ranging Market Revenue (Million), by Location of Deployment 2024 & 2032
- Figure 37: Asia Pacific Oil and Gas Magnetic Ranging Market Revenue Share (%), by Location of Deployment 2024 & 2032
- Figure 38: Asia Pacific Oil and Gas Magnetic Ranging Market Revenue (Million), by Geogrpahy 2024 & 2032
- Figure 39: Asia Pacific Oil and Gas Magnetic Ranging Market Revenue Share (%), by Geogrpahy 2024 & 2032
- Figure 40: Asia Pacific Oil and Gas Magnetic Ranging Market Revenue (Million), by Country 2024 & 2032
- Figure 41: Asia Pacific Oil and Gas Magnetic Ranging Market Revenue Share (%), by Country 2024 & 2032
List of Tables
- Table 1: Global Oil and Gas Magnetic Ranging Market Revenue Million Forecast, by Region 2019 & 2032
- Table 2: Global Oil and Gas Magnetic Ranging Market Revenue Million Forecast, by Location of Deployment 2019 & 2032
- Table 3: Global Oil and Gas Magnetic Ranging Market Revenue Million Forecast, by Geogrpahy 2019 & 2032
- Table 4: Global Oil and Gas Magnetic Ranging Market Revenue Million Forecast, by Region 2019 & 2032
- Table 5: Global Oil and Gas Magnetic Ranging Market Revenue Million Forecast, by Country 2019 & 2032
- Table 6: United States Oil and Gas Magnetic Ranging Market Revenue (Million) Forecast, by Application 2019 & 2032
- Table 7: Canada Oil and Gas Magnetic Ranging Market Revenue (Million) Forecast, by Application 2019 & 2032
- Table 8: Mexico Oil and Gas Magnetic Ranging Market Revenue (Million) Forecast, by Application 2019 & 2032
- Table 9: Global Oil and Gas Magnetic Ranging Market Revenue Million Forecast, by Country 2019 & 2032
- Table 10: Germany Oil and Gas Magnetic Ranging Market Revenue (Million) Forecast, by Application 2019 & 2032
- Table 11: United Kingdom Oil and Gas Magnetic Ranging Market Revenue (Million) Forecast, by Application 2019 & 2032
- Table 12: France Oil and Gas Magnetic Ranging Market Revenue (Million) Forecast, by Application 2019 & 2032
- Table 13: Spain Oil and Gas Magnetic Ranging Market Revenue (Million) Forecast, by Application 2019 & 2032
- Table 14: Italy Oil and Gas Magnetic Ranging Market Revenue (Million) Forecast, by Application 2019 & 2032
- Table 15: Spain Oil and Gas Magnetic Ranging Market Revenue (Million) Forecast, by Application 2019 & 2032
- Table 16: Belgium Oil and Gas Magnetic Ranging Market Revenue (Million) Forecast, by Application 2019 & 2032
- Table 17: Netherland Oil and Gas Magnetic Ranging Market Revenue (Million) Forecast, by Application 2019 & 2032
- Table 18: Nordics Oil and Gas Magnetic Ranging Market Revenue (Million) Forecast, by Application 2019 & 2032
- Table 19: Rest of Europe Oil and Gas Magnetic Ranging Market Revenue (Million) Forecast, by Application 2019 & 2032
- Table 20: Global Oil and Gas Magnetic Ranging Market Revenue Million Forecast, by Country 2019 & 2032
- Table 21: China Oil and Gas Magnetic Ranging Market Revenue (Million) Forecast, by Application 2019 & 2032
- Table 22: Japan Oil and Gas Magnetic Ranging Market Revenue (Million) Forecast, by Application 2019 & 2032
- Table 23: India Oil and Gas Magnetic Ranging Market Revenue (Million) Forecast, by Application 2019 & 2032
- Table 24: South Korea Oil and Gas Magnetic Ranging Market Revenue (Million) Forecast, by Application 2019 & 2032
- Table 25: Southeast Asia Oil and Gas Magnetic Ranging Market Revenue (Million) Forecast, by Application 2019 & 2032
- Table 26: Australia Oil and Gas Magnetic Ranging Market Revenue (Million) Forecast, by Application 2019 & 2032
- Table 27: Indonesia Oil and Gas Magnetic Ranging Market Revenue (Million) Forecast, by Application 2019 & 2032
- Table 28: Phillipes Oil and Gas Magnetic Ranging Market Revenue (Million) Forecast, by Application 2019 & 2032
- Table 29: Singapore Oil and Gas Magnetic Ranging Market Revenue (Million) Forecast, by Application 2019 & 2032
- Table 30: Thailandc Oil and Gas Magnetic Ranging Market Revenue (Million) Forecast, by Application 2019 & 2032
- Table 31: Rest of Asia Pacific Oil and Gas Magnetic Ranging Market Revenue (Million) Forecast, by Application 2019 & 2032
- Table 32: Global Oil and Gas Magnetic Ranging Market Revenue Million Forecast, by Country 2019 & 2032
- Table 33: Brazil Oil and Gas Magnetic Ranging Market Revenue (Million) Forecast, by Application 2019 & 2032
- Table 34: Argentina Oil and Gas Magnetic Ranging Market Revenue (Million) Forecast, by Application 2019 & 2032
- Table 35: Peru Oil and Gas Magnetic Ranging Market Revenue (Million) Forecast, by Application 2019 & 2032
- Table 36: Chile Oil and Gas Magnetic Ranging Market Revenue (Million) Forecast, by Application 2019 & 2032
- Table 37: Colombia Oil and Gas Magnetic Ranging Market Revenue (Million) Forecast, by Application 2019 & 2032
- Table 38: Ecuador Oil and Gas Magnetic Ranging Market Revenue (Million) Forecast, by Application 2019 & 2032
- Table 39: Venezuela Oil and Gas Magnetic Ranging Market Revenue (Million) Forecast, by Application 2019 & 2032
- Table 40: Rest of South America Oil and Gas Magnetic Ranging Market Revenue (Million) Forecast, by Application 2019 & 2032
- Table 41: Global Oil and Gas Magnetic Ranging Market Revenue Million Forecast, by Country 2019 & 2032
- Table 42: United Arab Emirates Oil and Gas Magnetic Ranging Market Revenue (Million) Forecast, by Application 2019 & 2032
- Table 43: Saudi Arabia Oil and Gas Magnetic Ranging Market Revenue (Million) Forecast, by Application 2019 & 2032
- Table 44: South Africa Oil and Gas Magnetic Ranging Market Revenue (Million) Forecast, by Application 2019 & 2032
- Table 45: Rest of Middle East and Africa Oil and Gas Magnetic Ranging Market Revenue (Million) Forecast, by Application 2019 & 2032
- Table 46: Global Oil and Gas Magnetic Ranging Market Revenue Million Forecast, by Location of Deployment 2019 & 2032
- Table 47: Global Oil and Gas Magnetic Ranging Market Revenue Million Forecast, by Geogrpahy 2019 & 2032
- Table 48: Global Oil and Gas Magnetic Ranging Market Revenue Million Forecast, by Country 2019 & 2032
- Table 49: United States Oil and Gas Magnetic Ranging Market Revenue (Million) Forecast, by Application 2019 & 2032
- Table 50: Canada Oil and Gas Magnetic Ranging Market Revenue (Million) Forecast, by Application 2019 & 2032
- Table 51: Mexico Oil and Gas Magnetic Ranging Market Revenue (Million) Forecast, by Application 2019 & 2032
- Table 52: Global Oil and Gas Magnetic Ranging Market Revenue Million Forecast, by Location of Deployment 2019 & 2032
- Table 53: Global Oil and Gas Magnetic Ranging Market Revenue Million Forecast, by Geogrpahy 2019 & 2032
- Table 54: Global Oil and Gas Magnetic Ranging Market Revenue Million Forecast, by Country 2019 & 2032
- Table 55: Brazil Oil and Gas Magnetic Ranging Market Revenue (Million) Forecast, by Application 2019 & 2032
- Table 56: Argentina Oil and Gas Magnetic Ranging Market Revenue (Million) Forecast, by Application 2019 & 2032
- Table 57: Rest of South America Oil and Gas Magnetic Ranging Market Revenue (Million) Forecast, by Application 2019 & 2032
- Table 58: Global Oil and Gas Magnetic Ranging Market Revenue Million Forecast, by Location of Deployment 2019 & 2032
- Table 59: Global Oil and Gas Magnetic Ranging Market Revenue Million Forecast, by Geogrpahy 2019 & 2032
- Table 60: Global Oil and Gas Magnetic Ranging Market Revenue Million Forecast, by Country 2019 & 2032
- Table 61: United Kingdom Oil and Gas Magnetic Ranging Market Revenue (Million) Forecast, by Application 2019 & 2032
- Table 62: Germany Oil and Gas Magnetic Ranging Market Revenue (Million) Forecast, by Application 2019 & 2032
- Table 63: France Oil and Gas Magnetic Ranging Market Revenue (Million) Forecast, by Application 2019 & 2032
- Table 64: Italy Oil and Gas Magnetic Ranging Market Revenue (Million) Forecast, by Application 2019 & 2032
- Table 65: Spain Oil and Gas Magnetic Ranging Market Revenue (Million) Forecast, by Application 2019 & 2032
- Table 66: Russia Oil and Gas Magnetic Ranging Market Revenue (Million) Forecast, by Application 2019 & 2032
- Table 67: Benelux Oil and Gas Magnetic Ranging Market Revenue (Million) Forecast, by Application 2019 & 2032
- Table 68: Nordics Oil and Gas Magnetic Ranging Market Revenue (Million) Forecast, by Application 2019 & 2032
- Table 69: Rest of Europe Oil and Gas Magnetic Ranging Market Revenue (Million) Forecast, by Application 2019 & 2032
- Table 70: Global Oil and Gas Magnetic Ranging Market Revenue Million Forecast, by Location of Deployment 2019 & 2032
- Table 71: Global Oil and Gas Magnetic Ranging Market Revenue Million Forecast, by Geogrpahy 2019 & 2032
- Table 72: Global Oil and Gas Magnetic Ranging Market Revenue Million Forecast, by Country 2019 & 2032
- Table 73: Turkey Oil and Gas Magnetic Ranging Market Revenue (Million) Forecast, by Application 2019 & 2032
- Table 74: Israel Oil and Gas Magnetic Ranging Market Revenue (Million) Forecast, by Application 2019 & 2032
- Table 75: GCC Oil and Gas Magnetic Ranging Market Revenue (Million) Forecast, by Application 2019 & 2032
- Table 76: North Africa Oil and Gas Magnetic Ranging Market Revenue (Million) Forecast, by Application 2019 & 2032
- Table 77: South Africa Oil and Gas Magnetic Ranging Market Revenue (Million) Forecast, by Application 2019 & 2032
- Table 78: Rest of Middle East & Africa Oil and Gas Magnetic Ranging Market Revenue (Million) Forecast, by Application 2019 & 2032
- Table 79: Global Oil and Gas Magnetic Ranging Market Revenue Million Forecast, by Location of Deployment 2019 & 2032
- Table 80: Global Oil and Gas Magnetic Ranging Market Revenue Million Forecast, by Geogrpahy 2019 & 2032
- Table 81: Global Oil and Gas Magnetic Ranging Market Revenue Million Forecast, by Country 2019 & 2032
- Table 82: China Oil and Gas Magnetic Ranging Market Revenue (Million) Forecast, by Application 2019 & 2032
- Table 83: India Oil and Gas Magnetic Ranging Market Revenue (Million) Forecast, by Application 2019 & 2032
- Table 84: Japan Oil and Gas Magnetic Ranging Market Revenue (Million) Forecast, by Application 2019 & 2032
- Table 85: South Korea Oil and Gas Magnetic Ranging Market Revenue (Million) Forecast, by Application 2019 & 2032
- Table 86: ASEAN Oil and Gas Magnetic Ranging Market Revenue (Million) Forecast, by Application 2019 & 2032
- Table 87: Oceania Oil and Gas Magnetic Ranging Market Revenue (Million) Forecast, by Application 2019 & 2032
- Table 88: Rest of Asia Pacific Oil and Gas Magnetic Ranging Market Revenue (Million) Forecast, by Application 2019 & 2032
Frequently Asked Questions
1. What is the projected Compound Annual Growth Rate (CAGR) of the Oil and Gas Magnetic Ranging Market?
The projected CAGR is approximately > 5.00%.
2. Which companies are prominent players in the Oil and Gas Magnetic Ranging Market?
Key companies in the market include Bartington Instruments Ltd, Weatherford International plc, GMW Associates, Gunnar Energy Services, China Oilfield Services Limited, Halliburton Company, Prime Horizontal Group of Companies, Scientific Drilling International Inc.
3. What are the main segments of the Oil and Gas Magnetic Ranging Market?
The market segments include Location of Deployment, Geogrpahy.
4. Can you provide details about the market size?
The market size is estimated to be USD XX Million as of 2022.
5. What are some drivers contributing to market growth?
4.; Increasing Production from Unconventional Sources4.; Growing Energy Demand in the Region.
6. What are the notable trends driving market growth?
Onshore Segment to Dominate the Demand.
7. Are there any restraints impacting market growth?
4.; Environmental Concerns.
8. Can you provide examples of recent developments in the market?
N/A
9. What pricing options are available for accessing the report?
Pricing options include single-user, multi-user, and enterprise licenses priced at USD 4750, USD 5250, and USD 8750 respectively.
10. Is the market size provided in terms of value or volume?
The market size is provided in terms of value, measured in Million.
11. Are there any specific market keywords associated with the report?
Yes, the market keyword associated with the report is "Oil and Gas Magnetic Ranging Market," which aids in identifying and referencing the specific market segment covered.
12. How do I determine which pricing option suits my needs best?
The pricing options vary based on user requirements and access needs. Individual users may opt for single-user licenses, while businesses requiring broader access may choose multi-user or enterprise licenses for cost-effective access to the report.
13. Are there any additional resources or data provided in the Oil and Gas Magnetic Ranging Market report?
While the report offers comprehensive insights, it's advisable to review the specific contents or supplementary materials provided to ascertain if additional resources or data are available.
14. How can I stay updated on further developments or reports in the Oil and Gas Magnetic Ranging Market?
To stay informed about further developments, trends, and reports in the Oil and Gas Magnetic Ranging Market, consider subscribing to industry newsletters, following relevant companies and organizations, or regularly checking reputable industry news sources and publications.
Methodology
Step 1 - Identification of Relevant Samples Size from Population Database


Step 2 - Approaches for Defining Global Market Size (Value, Volume* & Price*)

Note*: In applicable scenarios
Step 3 - Data Sources
Primary Research
- Web Analytics
- Survey Reports
- Research Institute
- Latest Research Reports
- Opinion Leaders
Secondary Research
- Annual Reports
- White Paper
- Latest Press Release
- Industry Association
- Paid Database
- Investor Presentations

Step 4 - Data Triangulation
Involves using different sources of information in order to increase the validity of a study
These sources are likely to be stakeholders in a program - participants, other researchers, program staff, other community members, and so on.
Then we put all data in single framework & apply various statistical tools to find out the dynamic on the market.
During the analysis stage, feedback from the stakeholder groups would be compared to determine areas of agreement as well as areas of divergence
