

Key Insights
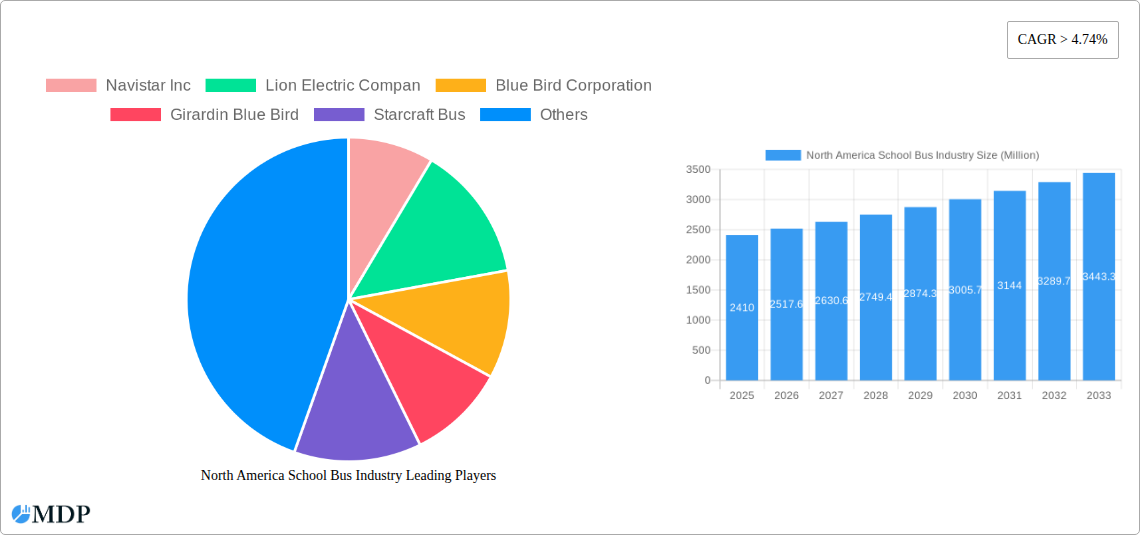
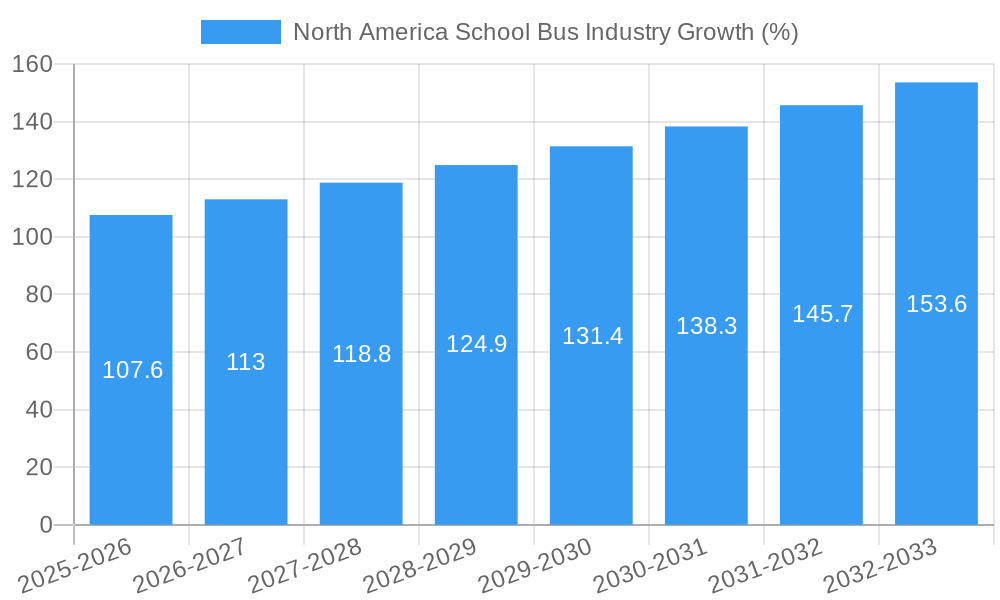
The North America school bus industry, valued at $2.41 billion in 2025, is poised for robust growth, exhibiting a compound annual growth rate (CAGR) exceeding 4.74% from 2025 to 2033. This expansion is fueled by several key drivers. Increasing student enrollment, particularly in rapidly developing regions within the US and Canada, necessitates a larger fleet of school buses. Furthermore, stringent government regulations mandating enhanced safety features and reduced emissions are driving the adoption of newer, more technologically advanced vehicles. The shift towards electric and hybrid powertrains is a prominent trend, driven by environmental concerns and potential long-term cost savings despite higher initial investment. However, the industry faces certain challenges. The fluctuating prices of raw materials, particularly steel and aluminum, impact manufacturing costs. Supply chain disruptions, exacerbated by global events, can also lead to production delays and increased prices. Competition among established players like Navistar Inc., Lion Electric Co., Blue Bird Corporation, and Daimler AG (Thomas Built Buses) is intense, placing pressure on profit margins. Segmentation within the market reveals a preference towards Type C and Type D buses, catering to varying student capacities and route requirements. The industry's growth will likely be concentrated in the US, which holds the largest market share in North America, given its extensive school system and higher student population.
The market segmentation by powertrain (Internal Combustion Engine (ICE), Electric) and bus type (Type C, Type D, Other) presents varied growth trajectories. The ICE segment, currently dominant, is expected to experience slower growth compared to the rapidly expanding electric segment. This shift is largely driven by government incentives promoting electric vehicle adoption and growing awareness of environmental sustainability. Within bus types, Type C and Type D buses will continue to be the most significant segments, though the "Other" category might see growth due to niche market demands for smaller or specialized buses. Regional variations in growth will reflect differences in funding priorities and adoption rates of electric vehicles across the US, Canada, and Mexico. Ongoing technological advancements in battery technology and charging infrastructure will significantly influence the growth of the electric school bus segment in the coming years. Addressing the challenges related to supply chain resilience and raw material costs will be crucial for sustained industry growth.
North America School Bus Industry Market Report: 2019-2033
This comprehensive report provides an in-depth analysis of the North America school bus industry, offering invaluable insights for stakeholders, investors, and industry professionals. The report covers market dynamics, trends, leading players, and future growth opportunities, using data from 2019 to 2024 (historical period) and projecting to 2033 (forecast period), with 2025 as the base year and estimated year. Expect detailed breakdowns of key segments including powertrain (IC Engine, Electric) and bus types (Type C, Type D, Other). The market size is expected to reach xx Million by 2033.
North America School Bus Industry Market Dynamics & Concentration
The North American school bus market is characterized by a moderately concentrated landscape, with key players holding significant market shares. Market concentration is influenced by factors such as economies of scale, technological advancements, and the increasing importance of electrification. The industry has witnessed several mergers and acquisitions (M&A) in recent years, further shaping its competitive structure. Over the study period (2019-2024), the average number of M&A deals per year was approximately xx. The leading companies, including Navistar Inc., Lion Electric Co., Blue Bird Corporation, and Daimler AG (Thomas Built Buses), hold a combined market share of approximately xx%, showcasing the industry's consolidated nature.
Innovation is a key driver, fueled by the demand for safer, more efficient, and environmentally friendly vehicles. Stringent government regulations regarding emissions and safety standards are significantly influencing industry dynamics, particularly driving the adoption of electric buses. The presence of substitute transportation options, such as private vehicles and ride-sharing services, also impacts market growth. However, the continued need for large-scale student transportation and government mandates favoring electrification mitigate these challenges.
North America School Bus Industry Industry Trends & Analysis
The North American school bus industry exhibits a dynamic growth trajectory, driven by several factors. The increasing number of school-aged children, coupled with government initiatives promoting school safety and environmental sustainability, are key market growth drivers. The market has experienced a Compound Annual Growth Rate (CAGR) of xx% during the historical period (2019-2024), and it is projected to maintain a CAGR of xx% during the forecast period (2025-2033). This growth is further amplified by the substantial investments in electric vehicle (EV) technology and infrastructure, particularly for school buses. Market penetration of electric school buses is increasing rapidly, driven by environmental concerns, government incentives, and the decreasing cost of battery technology. Competitive dynamics are intensifying as manufacturers focus on innovation and expand their product portfolios to cater to evolving market preferences. Technological disruption, primarily driven by electrification and advanced safety features, presents new opportunities for existing and emerging players.
Leading Markets & Segments in North America School Bus Industry
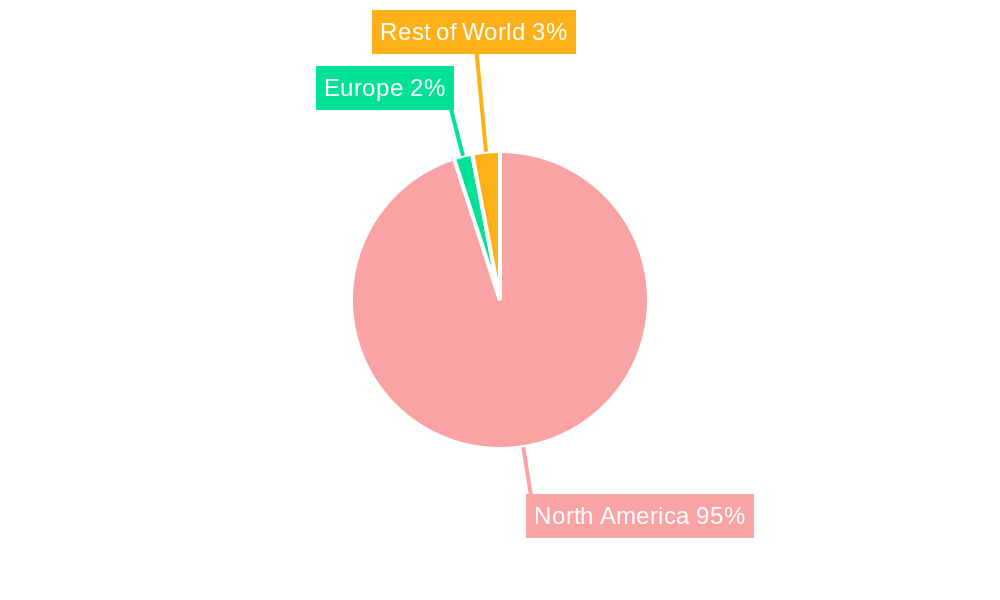
Dominant Region: The market is largely driven by the United States, accounting for xx% of the total market value in 2025. This dominance stems from the large number of school-aged children and considerable government funding for school transportation. California and other states with stringent emission regulations are showing exceptionally high adoption of electric school buses.
Dominant Bus Type: Type C buses are the most dominant segment, comprising xx% of the market in 2025. Their popularity arises from their versatility and suitability for a wide range of student transportation needs. Type D buses hold a significant share as well, particularly in areas with larger student populations.
Dominant Powertrain: While IC Engine buses still constitute a significant share of the market (xx% in 2025), the electric powertrain segment is witnessing substantial growth, driven by government incentives and sustainability concerns. The segment is expected to reach xx Million by 2033.
Key drivers contributing to regional dominance include supportive economic policies, substantial investment in school infrastructure, and robust government funding for school transportation. The increasing adoption of electric buses in specific regions is attributed to policies that incentivize electric vehicle adoption.
North America School Bus Industry Product Developments
The school bus industry is witnessing significant product innovation. The shift towards electric powertrains is a prominent trend, with manufacturers focusing on developing longer-range, efficient electric buses. Manufacturers are also incorporating advanced safety features such as collision avoidance systems, cameras, and enhanced seatbelts. These innovations focus on enhancing safety, reducing operational costs, and improving environmental performance. The market fit for these enhanced products is high, driven by the increasing demand for safety and sustainability.
Key Drivers of North America School Bus Industry Growth
Several factors are driving growth in the North American school bus industry. Technological advancements, especially in electric vehicle technology and safety features, are leading to the adoption of modern, efficient school buses. Government regulations promoting emission reduction and increased safety are compelling manufacturers to innovate and adopt greener technologies. Economic factors such as increased funding for school transportation and government incentives for electric buses are also boosting growth.
Challenges in the North America School Bus Industry Market
The industry faces challenges such as the high upfront cost of electric buses, the limited availability of charging infrastructure, and potential supply chain disruptions impacting production. Regulatory hurdles related to the adoption and integration of new technologies can delay market penetration. Intense competition from established and emerging players adds pressure on pricing and profitability, leading to a potential decrease in market share for some players if they don't innovate quickly enough. These challenges have a quantifiable impact, potentially slowing the overall market growth in the short term. For instance, supply chain disruptions in 2022-2023 led to a xx% decrease in production for certain manufacturers.
Emerging Opportunities in North America School Bus Industry
The long-term growth prospects of the North American school bus industry are positive. Continued advancements in battery technology and the expansion of charging infrastructure will drive the adoption of electric buses. Strategic partnerships between manufacturers and fleet operators will facilitate the efficient deployment of electric school bus fleets. Expansion into new markets and international growth opportunities for North American manufacturers can further enhance growth.
Leading Players in the North America School Bus Industry Sector
- Navistar Inc.
- Lion Electric Co.
- Blue Bird Corporation
- Girardin Blue Bird
- Starcraft Bus
- Trans Tech
- Collins Bus Corporation
- Daimler AG (Thomas Built Buses)
Key Milestones in North America School Bus Industry Industry
- March 2022: Thomas Built Buses and Highland Electric Fleets expand their partnership to accelerate electric school bus adoption.
- October 2022: Thomas Built Buses delivers its 200th electric school bus to Monroe County Public Schools.
- November 2022: Lion Electric Co. produces its first zero-emission LionC school bus in its Joliet, Illinois factory.
- November 2023: Lion Electric receives a provisional purchase order for 50 all-electric school buses from Highland Electric Fleets.
- October 2023: Blue Bird Corporation delivers its 1,500th electric school bus and inaugurates its EV Build-up Center in Georgia.
These milestones demonstrate the rapid pace of electrification and technological advancement within the North American school bus industry.
Strategic Outlook for North America School Bus Industry Market
The future of the North American school bus industry is promising. The continued shift towards electric vehicles, driven by technological breakthroughs, environmental concerns, and government support, will significantly shape market growth. Strategic partnerships, innovative financing models, and expansion into new markets will present substantial opportunities for industry players. The market's long-term potential lies in sustainable and technologically advanced school transportation solutions.
North America School Bus Industry Segmentation
-
1. Powertrain
- 1.1. IC Engine
- 1.2. Electric
-
2. Bus Type
- 2.1. Type C
- 2.2. Type D
- 2.3. Other Types
-
3. Geography
- 3.1. United States
- 3.2. Canada
- 3.3. Rest of North America
North America School Bus Industry Segmentation By Geography
- 1. United States
- 2. Canada
- 3. Rest of North America
North America School Bus Industry REPORT HIGHLIGHTS
| Aspects | Details |
|---|---|
| Study Period | 2019-2033 |
| Base Year | 2024 |
| Estimated Year | 2025 |
| Forecast Period | 2025-2033 |
| Historical Period | 2019-2024 |
| Growth Rate | CAGR of > 4.74% from 2019-2033 |
| Segmentation |
|
Table of Contents
- 1. Introduction
- 1.1. Research Scope
- 1.2. Market Segmentation
- 1.3. Research Methodology
- 1.4. Definitions and Assumptions
- 2. Executive Summary
- 2.1. Introduction
- 3. Market Dynamics
- 3.1. Introduction
- 3.2. Market Drivers
- 3.2.1. Increasing Demand For Electric School Buses
- 3.3. Market Restrains
- 3.3.1. Uncertainty of The Global Pandemic
- 3.4. Market Trends
- 3.4.1. The Industry’s Shift Toward the Adoption of Electric School Buses
- 4. Market Factor Analysis
- 4.1. Porters Five Forces
- 4.2. Supply/Value Chain
- 4.3. PESTEL analysis
- 4.4. Market Entropy
- 4.5. Patent/Trademark Analysis
- 5. North America School Bus Industry Analysis, Insights and Forecast, 2019-2031
- 5.1. Market Analysis, Insights and Forecast - by Powertrain
- 5.1.1. IC Engine
- 5.1.2. Electric
- 5.2. Market Analysis, Insights and Forecast - by Bus Type
- 5.2.1. Type C
- 5.2.2. Type D
- 5.2.3. Other Types
- 5.3. Market Analysis, Insights and Forecast - by Geography
- 5.3.1. United States
- 5.3.2. Canada
- 5.3.3. Rest of North America
- 5.4. Market Analysis, Insights and Forecast - by Region
- 5.4.1. United States
- 5.4.2. Canada
- 5.4.3. Rest of North America
- 5.1. Market Analysis, Insights and Forecast - by Powertrain
- 6. United States North America School Bus Industry Analysis, Insights and Forecast, 2019-2031
- 6.1. Market Analysis, Insights and Forecast - by Powertrain
- 6.1.1. IC Engine
- 6.1.2. Electric
- 6.2. Market Analysis, Insights and Forecast - by Bus Type
- 6.2.1. Type C
- 6.2.2. Type D
- 6.2.3. Other Types
- 6.3. Market Analysis, Insights and Forecast - by Geography
- 6.3.1. United States
- 6.3.2. Canada
- 6.3.3. Rest of North America
- 6.1. Market Analysis, Insights and Forecast - by Powertrain
- 7. Canada North America School Bus Industry Analysis, Insights and Forecast, 2019-2031
- 7.1. Market Analysis, Insights and Forecast - by Powertrain
- 7.1.1. IC Engine
- 7.1.2. Electric
- 7.2. Market Analysis, Insights and Forecast - by Bus Type
- 7.2.1. Type C
- 7.2.2. Type D
- 7.2.3. Other Types
- 7.3. Market Analysis, Insights and Forecast - by Geography
- 7.3.1. United States
- 7.3.2. Canada
- 7.3.3. Rest of North America
- 7.1. Market Analysis, Insights and Forecast - by Powertrain
- 8. Rest of North America North America School Bus Industry Analysis, Insights and Forecast, 2019-2031
- 8.1. Market Analysis, Insights and Forecast - by Powertrain
- 8.1.1. IC Engine
- 8.1.2. Electric
- 8.2. Market Analysis, Insights and Forecast - by Bus Type
- 8.2.1. Type C
- 8.2.2. Type D
- 8.2.3. Other Types
- 8.3. Market Analysis, Insights and Forecast - by Geography
- 8.3.1. United States
- 8.3.2. Canada
- 8.3.3. Rest of North America
- 8.1. Market Analysis, Insights and Forecast - by Powertrain
- 9. United States North America School Bus Industry Analysis, Insights and Forecast, 2019-2031
- 10. Canada North America School Bus Industry Analysis, Insights and Forecast, 2019-2031
- 11. Mexico North America School Bus Industry Analysis, Insights and Forecast, 2019-2031
- 12. Rest of North America North America School Bus Industry Analysis, Insights and Forecast, 2019-2031
- 13. Competitive Analysis
- 13.1. Market Share Analysis 2024
- 13.2. Company Profiles
- 13.2.1 Navistar Inc
- 13.2.1.1. Overview
- 13.2.1.2. Products
- 13.2.1.3. SWOT Analysis
- 13.2.1.4. Recent Developments
- 13.2.1.5. Financials (Based on Availability)
- 13.2.2 Lion Electric Compan
- 13.2.2.1. Overview
- 13.2.2.2. Products
- 13.2.2.3. SWOT Analysis
- 13.2.2.4. Recent Developments
- 13.2.2.5. Financials (Based on Availability)
- 13.2.3 Blue Bird Corporation
- 13.2.3.1. Overview
- 13.2.3.2. Products
- 13.2.3.3. SWOT Analysis
- 13.2.3.4. Recent Developments
- 13.2.3.5. Financials (Based on Availability)
- 13.2.4 Girardin Blue Bird
- 13.2.4.1. Overview
- 13.2.4.2. Products
- 13.2.4.3. SWOT Analysis
- 13.2.4.4. Recent Developments
- 13.2.4.5. Financials (Based on Availability)
- 13.2.5 Starcraft Bus
- 13.2.5.1. Overview
- 13.2.5.2. Products
- 13.2.5.3. SWOT Analysis
- 13.2.5.4. Recent Developments
- 13.2.5.5. Financials (Based on Availability)
- 13.2.6 Trans Tech
- 13.2.6.1. Overview
- 13.2.6.2. Products
- 13.2.6.3. SWOT Analysis
- 13.2.6.4. Recent Developments
- 13.2.6.5. Financials (Based on Availability)
- 13.2.7 Collins Bus Corporation
- 13.2.7.1. Overview
- 13.2.7.2. Products
- 13.2.7.3. SWOT Analysis
- 13.2.7.4. Recent Developments
- 13.2.7.5. Financials (Based on Availability)
- 13.2.8 Daimler AG (Thomas Built Buses)
- 13.2.8.1. Overview
- 13.2.8.2. Products
- 13.2.8.3. SWOT Analysis
- 13.2.8.4. Recent Developments
- 13.2.8.5. Financials (Based on Availability)
- 13.2.1 Navistar Inc
List of Figures
- Figure 1: North America School Bus Industry Revenue Breakdown (Million, %) by Product 2024 & 2032
- Figure 2: North America School Bus Industry Share (%) by Company 2024
List of Tables
- Table 1: North America School Bus Industry Revenue Million Forecast, by Region 2019 & 2032
- Table 2: North America School Bus Industry Revenue Million Forecast, by Powertrain 2019 & 2032
- Table 3: North America School Bus Industry Revenue Million Forecast, by Bus Type 2019 & 2032
- Table 4: North America School Bus Industry Revenue Million Forecast, by Geography 2019 & 2032
- Table 5: North America School Bus Industry Revenue Million Forecast, by Region 2019 & 2032
- Table 6: North America School Bus Industry Revenue Million Forecast, by Country 2019 & 2032
- Table 7: United States North America School Bus Industry Revenue (Million) Forecast, by Application 2019 & 2032
- Table 8: Canada North America School Bus Industry Revenue (Million) Forecast, by Application 2019 & 2032
- Table 9: Mexico North America School Bus Industry Revenue (Million) Forecast, by Application 2019 & 2032
- Table 10: Rest of North America North America School Bus Industry Revenue (Million) Forecast, by Application 2019 & 2032
- Table 11: North America School Bus Industry Revenue Million Forecast, by Powertrain 2019 & 2032
- Table 12: North America School Bus Industry Revenue Million Forecast, by Bus Type 2019 & 2032
- Table 13: North America School Bus Industry Revenue Million Forecast, by Geography 2019 & 2032
- Table 14: North America School Bus Industry Revenue Million Forecast, by Country 2019 & 2032
- Table 15: North America School Bus Industry Revenue Million Forecast, by Powertrain 2019 & 2032
- Table 16: North America School Bus Industry Revenue Million Forecast, by Bus Type 2019 & 2032
- Table 17: North America School Bus Industry Revenue Million Forecast, by Geography 2019 & 2032
- Table 18: North America School Bus Industry Revenue Million Forecast, by Country 2019 & 2032
- Table 19: North America School Bus Industry Revenue Million Forecast, by Powertrain 2019 & 2032
- Table 20: North America School Bus Industry Revenue Million Forecast, by Bus Type 2019 & 2032
- Table 21: North America School Bus Industry Revenue Million Forecast, by Geography 2019 & 2032
- Table 22: North America School Bus Industry Revenue Million Forecast, by Country 2019 & 2032
Frequently Asked Questions
1. What is the projected Compound Annual Growth Rate (CAGR) of the North America School Bus Industry?
The projected CAGR is approximately > 4.74%.
2. Which companies are prominent players in the North America School Bus Industry?
Key companies in the market include Navistar Inc, Lion Electric Compan, Blue Bird Corporation, Girardin Blue Bird, Starcraft Bus, Trans Tech, Collins Bus Corporation, Daimler AG (Thomas Built Buses).
3. What are the main segments of the North America School Bus Industry?
The market segments include Powertrain, Bus Type, Geography.
4. Can you provide details about the market size?
The market size is estimated to be USD 2.41 Million as of 2022.
5. What are some drivers contributing to market growth?
Increasing Demand For Electric School Buses.
6. What are the notable trends driving market growth?
The Industry’s Shift Toward the Adoption of Electric School Buses.
7. Are there any restraints impacting market growth?
Uncertainty of The Global Pandemic.
8. Can you provide examples of recent developments in the market?
October 2023: Blue Bird achieved a milestone by delivering its 1,500th electric, zero-emission school bus to Modesto City Schools in California. Recently, the company marked the inauguration of its Electric Vehicle (EV) Build-up Center in Georgia, aiming to boost its long-term production capacity to 5,000 electric school buses annually. This expansion underscores Blue Bird's commitment to advancing zero-emission school buses.
9. What pricing options are available for accessing the report?
Pricing options include single-user, multi-user, and enterprise licenses priced at USD 4750, USD 5250, and USD 8750 respectively.
10. Is the market size provided in terms of value or volume?
The market size is provided in terms of value, measured in Million.
11. Are there any specific market keywords associated with the report?
Yes, the market keyword associated with the report is "North America School Bus Industry," which aids in identifying and referencing the specific market segment covered.
12. How do I determine which pricing option suits my needs best?
The pricing options vary based on user requirements and access needs. Individual users may opt for single-user licenses, while businesses requiring broader access may choose multi-user or enterprise licenses for cost-effective access to the report.
13. Are there any additional resources or data provided in the North America School Bus Industry report?
While the report offers comprehensive insights, it's advisable to review the specific contents or supplementary materials provided to ascertain if additional resources or data are available.
14. How can I stay updated on further developments or reports in the North America School Bus Industry?
To stay informed about further developments, trends, and reports in the North America School Bus Industry, consider subscribing to industry newsletters, following relevant companies and organizations, or regularly checking reputable industry news sources and publications.
Methodology
Step 1 - Identification of Relevant Samples Size from Population Database


Step 2 - Approaches for Defining Global Market Size (Value, Volume* & Price*)

Note*: In applicable scenarios
Step 3 - Data Sources
Primary Research
- Web Analytics
- Survey Reports
- Research Institute
- Latest Research Reports
- Opinion Leaders
Secondary Research
- Annual Reports
- White Paper
- Latest Press Release
- Industry Association
- Paid Database
- Investor Presentations

Step 4 - Data Triangulation
Involves using different sources of information in order to increase the validity of a study
These sources are likely to be stakeholders in a program - participants, other researchers, program staff, other community members, and so on.
Then we put all data in single framework & apply various statistical tools to find out the dynamic on the market.
During the analysis stage, feedback from the stakeholder groups would be compared to determine areas of agreement as well as areas of divergence
