

Key Insights
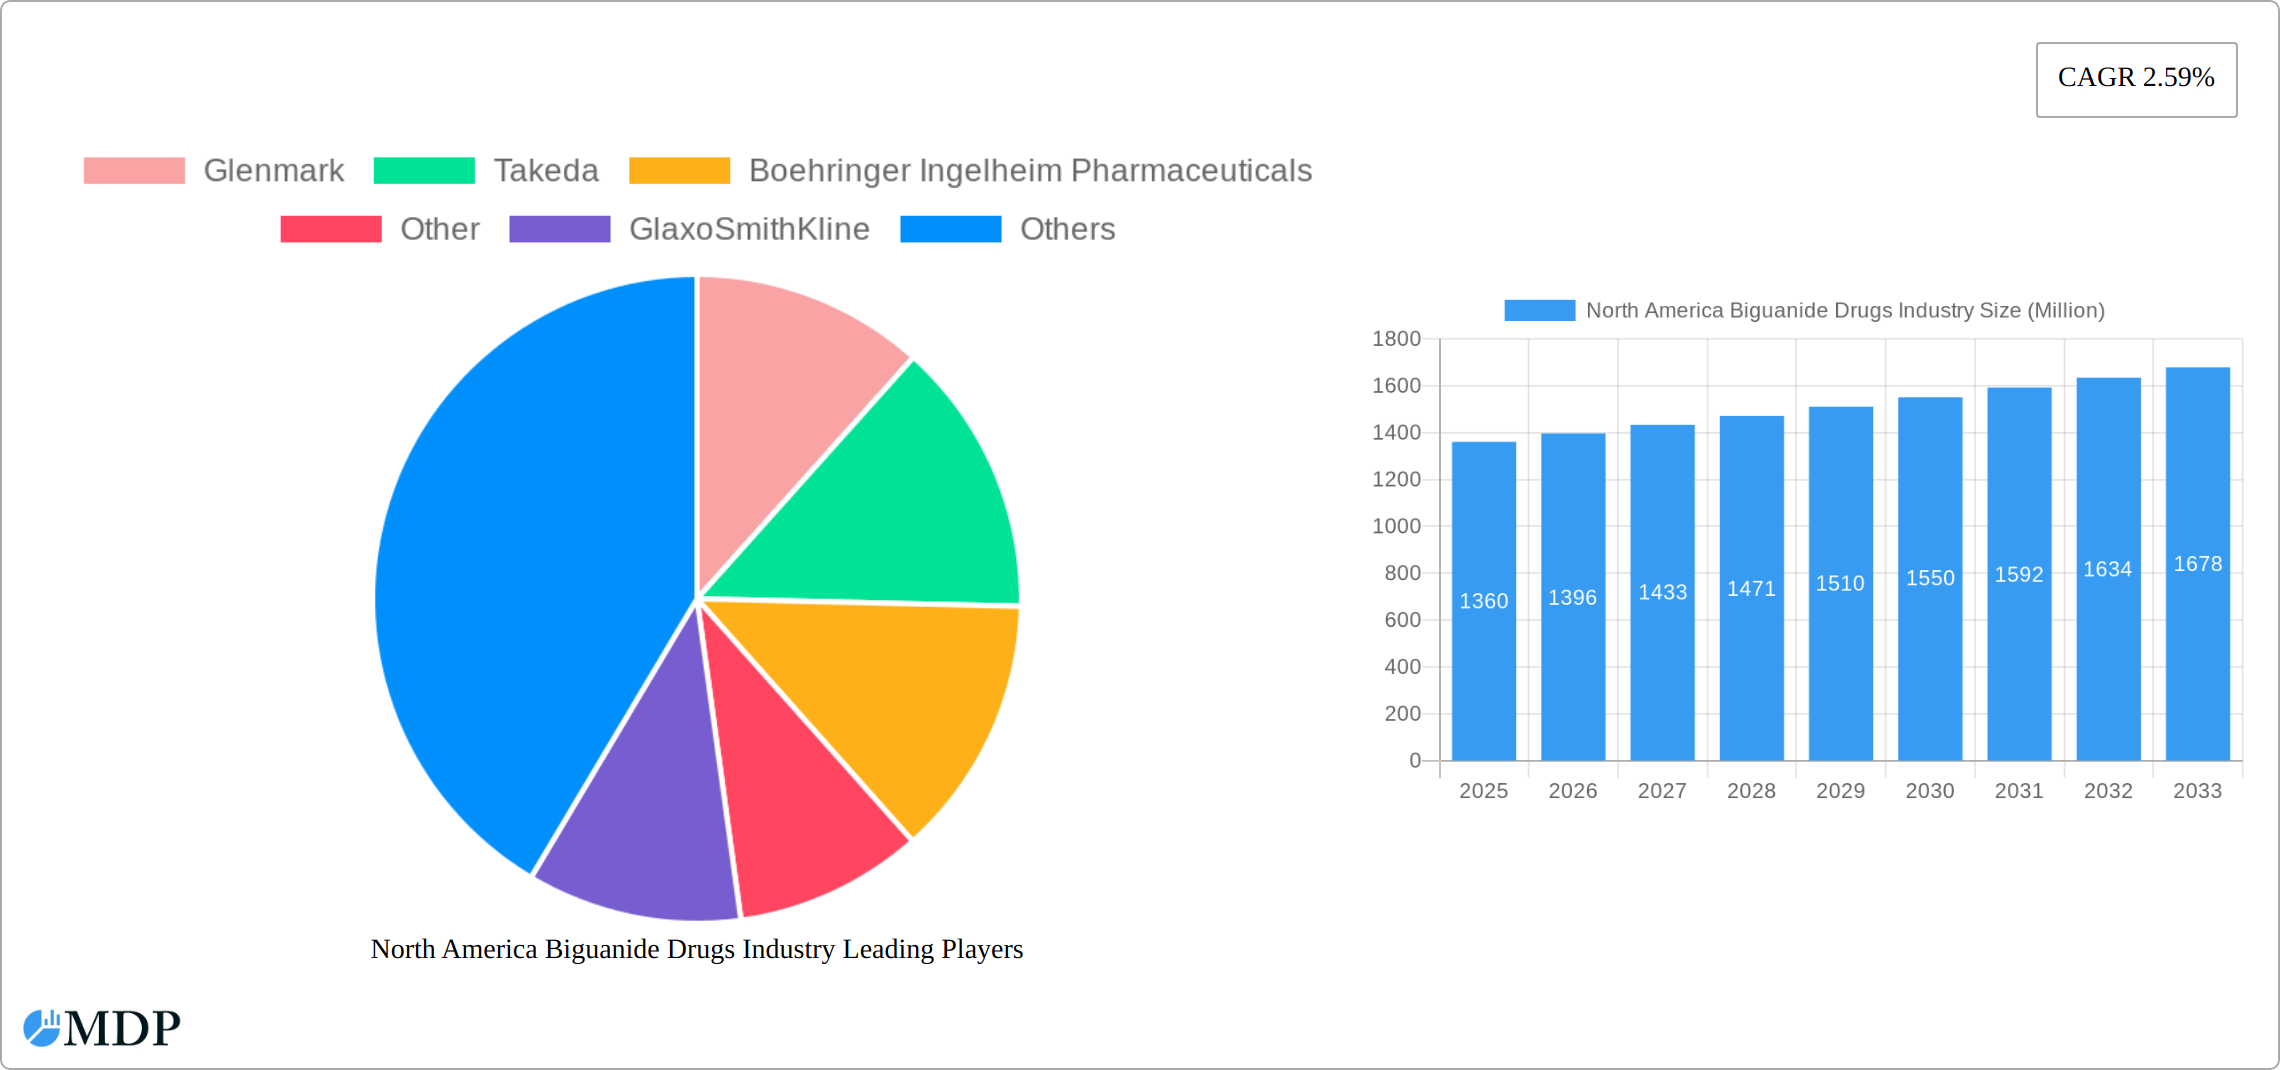
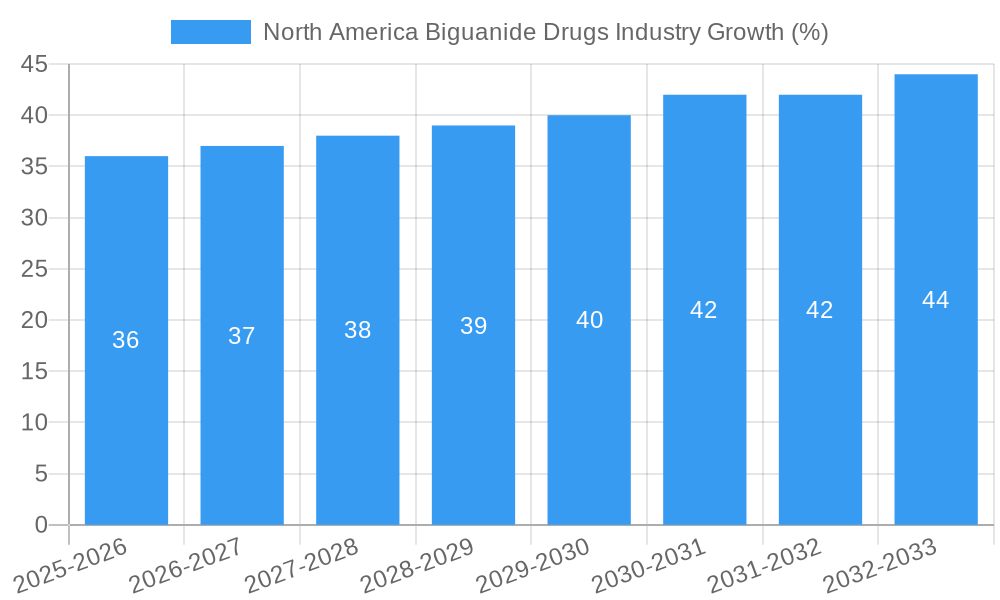
The North American biguanide drugs market, valued at $1.36 billion in 2025, is projected to experience steady growth, driven primarily by the increasing prevalence of type 2 diabetes and gestational diabetes. A compound annual growth rate (CAGR) of 2.59% from 2025 to 2033 indicates a consistent, albeit moderate, expansion. This growth is fueled by several factors, including the rising diabetic population, particularly among older adults, increased awareness of diabetes management, and the continued efficacy of biguanides as a first-line treatment option for many patients. However, the market faces challenges. The potential for gastrointestinal side effects associated with biguanide use, coupled with the emergence of newer diabetes medications with different mechanisms of action, could act as restraints on market expansion. The segment breakdown shows a higher demand for metformin compared to buformin and phenformin, reflecting metformin's established efficacy and broader acceptance. The application-wise division shows a larger market share for type 2 diabetes treatment, given its higher prevalence compared to gestational diabetes. The competitive landscape includes major pharmaceutical companies like Sanofi, Merck, and GlaxoSmithKline, along with other significant players, indicating a consolidated but dynamic market. Regional analysis, specifically focusing on the United States, Canada, and Mexico, within the North America segment would further highlight regional variations in market penetration and growth potential.
The growth trajectory of the North American biguanide drugs market will depend heavily on the introduction of new formulations that mitigate side effects, advancements in targeted therapies, and ongoing public health initiatives aimed at diabetes prevention and management. Furthermore, pricing pressures, regulatory changes, and the competitive landscape will all play significant roles in shaping the market's future. The continued focus on patient education and improved access to healthcare in underserved communities could contribute positively to market growth. Conversely, the development and market penetration of alternative diabetes treatments might exert downward pressure on market expansion. A detailed analysis of individual product segments and regional variations within North America will provide further clarity on specific growth opportunities and challenges.
North America Biguanide Drugs Industry: Market Analysis & Forecast 2019-2033
This comprehensive report provides an in-depth analysis of the North America Biguanide Drugs industry, offering actionable insights for stakeholders across the value chain. Covering the period 2019-2033, with a focus on 2025, this report unveils market dynamics, competitive landscapes, and future growth opportunities. The study includes detailed segmentation by product type (Metformin, Buformin, Phenformin) and application (Type 2 Diabetes, Gestational Diabetes), analyzing key players like Glenmark, Takeda, Boehringer Ingelheim Pharmaceuticals, GlaxoSmithKline, Sanofi, Merck, Zydus Cadila, and Bristol-Myers Squibb, alongside a comprehensive assessment of the "Other" segment.
North America Biguanide Drugs Industry Market Dynamics & Concentration
The North American biguanide drugs market is characterized by a moderately concentrated landscape, with a few major players holding significant market share. Market concentration is influenced by factors such as brand recognition, established distribution networks, and extensive R&D capabilities. Innovation is a key driver, with companies continuously striving to develop improved formulations and combination therapies to enhance efficacy and reduce side effects. Stringent regulatory frameworks, primarily governed by the FDA, influence product approvals and market entry. Generic competition exerts significant pressure, impacting pricing and profitability. Substitutes include other antidiabetic drugs like sulfonylureas, DPP-4 inhibitors, and SGLT2 inhibitors. End-user trends, including increasing prevalence of type 2 diabetes and a growing preference for oral medications, are driving market growth. M&A activities have been relatively low in recent years, with xx deals recorded between 2019 and 2024. Market share distribution among the top five players is estimated to be approximately 70% in 2025.
- Market Share: Top 5 players - 70% (2025 estimate)
- M&A Deal Count: xx (2019-2024)
- Key Innovation Drivers: Improved formulations, combination therapies
- Regulatory Landscape: Stringent FDA regulations
North America Biguanide Drugs Industry Industry Trends & Analysis
The North America biguanide drugs market exhibits a robust growth trajectory, driven primarily by the rising prevalence of type 2 diabetes. The market experienced a CAGR of xx% during the historical period (2019-2024) and is projected to maintain a CAGR of xx% during the forecast period (2025-2033). This growth is further fueled by increased healthcare expenditure, growing awareness about diabetes management, and expanding access to healthcare services. Technological advancements in drug delivery systems and personalized medicine are reshaping the market landscape. The market penetration of biguanide drugs remains high for Type 2 diabetes, but there's potential for growth in gestational diabetes treatment. Competitive dynamics are characterized by both price competition from generics and innovation-driven competition from branded drugs with enhanced efficacy or reduced side effects. Market penetration for Metformin remains significantly higher than other biguanide drugs.
Leading Markets & Segments in North America Biguanide Drugs Industry
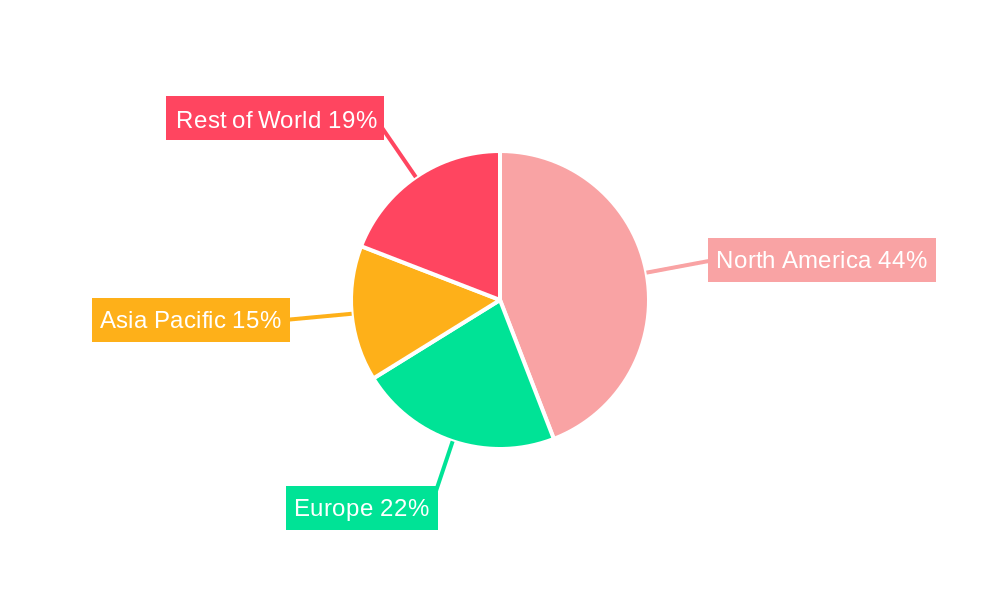
The United States dominates the North American biguanide drugs market, accounting for the largest share of total revenue. This dominance stems from several factors:
- High Prevalence of Type 2 Diabetes: The US has one of the highest rates of type 2 diabetes globally.
- Robust Healthcare Infrastructure: Extensive healthcare facilities and accessibility to medication contribute to high market demand.
- High Healthcare Expenditure: Significant investment in healthcare allows for greater access to pharmaceuticals.
- Strong Pharmaceutical Industry: Presence of numerous pharmaceutical companies and robust clinical trial infrastructure.
Within product types, Metformin overwhelmingly dominates, owing to its established efficacy, safety profile, and cost-effectiveness. Type 2 Diabetes represents the largest application segment, reflecting the significantly higher prevalence of this condition compared to gestational diabetes.
North America Biguanide Drugs Industry Product Developments
Recent years have witnessed a focus on improving existing metformin formulations, including extended-release versions to improve tolerability and reduce gastrointestinal side effects. Combination therapies, pairing metformin with other antidiabetic agents like SGLT2 inhibitors and DPP-4 inhibitors, are gaining traction, offering enhanced glycemic control. These developments reflect ongoing efforts to improve patient outcomes and address unmet needs within the diabetes management landscape. The focus is on targeted delivery systems to enhance efficacy and minimize side effects.
Key Drivers of North America Biguanide Drugs Industry Growth
The North American biguanide drugs market growth is propelled by several key factors:
- Rising Prevalence of Type 2 Diabetes: The escalating incidence of type 2 diabetes is a primary driver, creating a substantial demand for effective treatment options.
- Growing Geriatric Population: The aging population increases the vulnerability to diabetes, further boosting market demand.
- Technological Advancements: Innovations in drug delivery and formulation enhance efficacy and patient compliance.
- Favorable Regulatory Environment: Supportive regulatory frameworks facilitate product development and market entry.
Challenges in the North America Biguanide Drugs Industry Market
The market faces several challenges:
- Generic Competition: The availability of generic metformin exerts downward pressure on pricing.
- Stringent Regulatory Approvals: The rigorous FDA approval process adds to development costs and timelines.
- Side Effects: Gastrointestinal side effects associated with metformin can limit patient compliance.
- High Research and Development Costs: Significant investment is required for the development of new formulations and combination therapies.
Emerging Opportunities in North America Biguanide Drugs Industry
Significant growth opportunities exist in:
- Developing Novel Drug Delivery Systems: Targeted delivery systems can improve efficacy and reduce side effects.
- Expanding into Combination Therapies: Combining metformin with other antidiabetic agents can offer superior glycemic control.
- Personalized Medicine: Tailoring treatment regimens based on individual patient characteristics can optimize outcomes.
- Focus on Gestational Diabetes: Increased awareness and improved treatment approaches for gestational diabetes represent an untapped market segment.
Leading Players in the North America Biguanide Drugs Industry Sector
- Glenmark
- Takeda
- Boehringer Ingelheim Pharmaceuticals
- Other
- GlaxoSmithKline
- Sanofi
- Merck
- Zydus Cadila
- Bristol-Myers Squibb
Key Milestones in North America Biguanide Drugs Industry Industry
- July 2022: Zydus Lifesciences received final USFDA approval for Empagliflozin and Metformin Hydrochloride tablets, expanding treatment options for type 2 diabetes and reducing cardiovascular risk.
- February 2023: Zydus Lifesciences received tentative USFDA approval for Invokamet tablets (canagliflozin and metformin hydrochloride combination), offering an improved approach to glycemic control in type 2 diabetes.
Strategic Outlook for North America Biguanide Drugs Industry Market
The North America biguanide drugs market is poised for sustained growth, driven by the escalating prevalence of diabetes, innovative product development, and strategic partnerships to expand market reach. Companies focusing on improving existing formulations, developing novel combination therapies, and leveraging personalized medicine approaches are well-positioned to capitalize on emerging opportunities. Furthermore, exploring new avenues for treatment in related indications and expanding into underpenetrated markets will be crucial for future success.
North America Biguanide Drugs Industry Segmentation
-
1. Product Type
- 1.1. Metformin
- 1.2. Buformin
- 1.3. Phenformin
-
2. Application
- 2.1. Type 2 Diabetes
- 2.2. Gestational Diabetes
North America Biguanide Drugs Industry Segmentation By Geography
- 1. United States
- 2. Canada
- 3. Mexico
- 4. Rest of North America
North America Biguanide Drugs Industry REPORT HIGHLIGHTS
| Aspects | Details |
|---|---|
| Study Period | 2019-2033 |
| Base Year | 2024 |
| Estimated Year | 2025 |
| Forecast Period | 2025-2033 |
| Historical Period | 2019-2024 |
| Growth Rate | CAGR of 2.59% from 2019-2033 |
| Segmentation |
|
Table of Contents
- 1. Introduction
- 1.1. Research Scope
- 1.2. Market Segmentation
- 1.3. Research Methodology
- 1.4. Definitions and Assumptions
- 2. Executive Summary
- 2.1. Introduction
- 3. Market Dynamics
- 3.1. Introduction
- 3.2. Market Drivers
- 3.2.1. Advancement in the Technology of Chromatography Instruments; Significance of Chromatography Based Studies in Drug Approval
- 3.3. Market Restrains
- 3.3.1. Rising Price of Equipment
- 3.4. Market Trends
- 3.4.1. Rising diabetes prevalence
- 4. Market Factor Analysis
- 4.1. Porters Five Forces
- 4.2. Supply/Value Chain
- 4.3. PESTEL analysis
- 4.4. Market Entropy
- 4.5. Patent/Trademark Analysis
- 5. North America Biguanide Drugs Industry Analysis, Insights and Forecast, 2019-2031
- 5.1. Market Analysis, Insights and Forecast - by Product Type
- 5.1.1. Metformin
- 5.1.2. Buformin
- 5.1.3. Phenformin
- 5.2. Market Analysis, Insights and Forecast - by Application
- 5.2.1. Type 2 Diabetes
- 5.2.2. Gestational Diabetes
- 5.3. Market Analysis, Insights and Forecast - by Region
- 5.3.1. United States
- 5.3.2. Canada
- 5.3.3. Mexico
- 5.3.4. Rest of North America
- 5.1. Market Analysis, Insights and Forecast - by Product Type
- 6. United States North America Biguanide Drugs Industry Analysis, Insights and Forecast, 2019-2031
- 6.1. Market Analysis, Insights and Forecast - by Product Type
- 6.1.1. Metformin
- 6.1.2. Buformin
- 6.1.3. Phenformin
- 6.2. Market Analysis, Insights and Forecast - by Application
- 6.2.1. Type 2 Diabetes
- 6.2.2. Gestational Diabetes
- 6.1. Market Analysis, Insights and Forecast - by Product Type
- 7. Canada North America Biguanide Drugs Industry Analysis, Insights and Forecast, 2019-2031
- 7.1. Market Analysis, Insights and Forecast - by Product Type
- 7.1.1. Metformin
- 7.1.2. Buformin
- 7.1.3. Phenformin
- 7.2. Market Analysis, Insights and Forecast - by Application
- 7.2.1. Type 2 Diabetes
- 7.2.2. Gestational Diabetes
- 7.1. Market Analysis, Insights and Forecast - by Product Type
- 8. Mexico North America Biguanide Drugs Industry Analysis, Insights and Forecast, 2019-2031
- 8.1. Market Analysis, Insights and Forecast - by Product Type
- 8.1.1. Metformin
- 8.1.2. Buformin
- 8.1.3. Phenformin
- 8.2. Market Analysis, Insights and Forecast - by Application
- 8.2.1. Type 2 Diabetes
- 8.2.2. Gestational Diabetes
- 8.1. Market Analysis, Insights and Forecast - by Product Type
- 9. Rest of North America North America Biguanide Drugs Industry Analysis, Insights and Forecast, 2019-2031
- 9.1. Market Analysis, Insights and Forecast - by Product Type
- 9.1.1. Metformin
- 9.1.2. Buformin
- 9.1.3. Phenformin
- 9.2. Market Analysis, Insights and Forecast - by Application
- 9.2.1. Type 2 Diabetes
- 9.2.2. Gestational Diabetes
- 9.1. Market Analysis, Insights and Forecast - by Product Type
- 10. United States North America Biguanide Drugs Industry Analysis, Insights and Forecast, 2019-2031
- 11. Canada North America Biguanide Drugs Industry Analysis, Insights and Forecast, 2019-2031
- 12. Mexico North America Biguanide Drugs Industry Analysis, Insights and Forecast, 2019-2031
- 13. Rest of North America North America Biguanide Drugs Industry Analysis, Insights and Forecast, 2019-2031
- 14. Competitive Analysis
- 14.1. Market Share Analysis 2024
- 14.2. Company Profiles
- 14.2.1 Glenmark
- 14.2.1.1. Overview
- 14.2.1.2. Products
- 14.2.1.3. SWOT Analysis
- 14.2.1.4. Recent Developments
- 14.2.1.5. Financials (Based on Availability)
- 14.2.2 Takeda
- 14.2.2.1. Overview
- 14.2.2.2. Products
- 14.2.2.3. SWOT Analysis
- 14.2.2.4. Recent Developments
- 14.2.2.5. Financials (Based on Availability)
- 14.2.3 Boehringer Ingelheim Pharmaceuticals
- 14.2.3.1. Overview
- 14.2.3.2. Products
- 14.2.3.3. SWOT Analysis
- 14.2.3.4. Recent Developments
- 14.2.3.5. Financials (Based on Availability)
- 14.2.4 Other
- 14.2.4.1. Overview
- 14.2.4.2. Products
- 14.2.4.3. SWOT Analysis
- 14.2.4.4. Recent Developments
- 14.2.4.5. Financials (Based on Availability)
- 14.2.5 GlaxoSmithKline
- 14.2.5.1. Overview
- 14.2.5.2. Products
- 14.2.5.3. SWOT Analysis
- 14.2.5.4. Recent Developments
- 14.2.5.5. Financials (Based on Availability)
- 14.2.6 Sanofi
- 14.2.6.1. Overview
- 14.2.6.2. Products
- 14.2.6.3. SWOT Analysis
- 14.2.6.4. Recent Developments
- 14.2.6.5. Financials (Based on Availability)
- 14.2.7 Merck
- 14.2.7.1. Overview
- 14.2.7.2. Products
- 14.2.7.3. SWOT Analysis
- 14.2.7.4. Recent Developments
- 14.2.7.5. Financials (Based on Availability)
- 14.2.8 Zydus Cadila
- 14.2.8.1. Overview
- 14.2.8.2. Products
- 14.2.8.3. SWOT Analysis
- 14.2.8.4. Recent Developments
- 14.2.8.5. Financials (Based on Availability)
- 14.2.9 Bristol-Myers Squibb
- 14.2.9.1. Overview
- 14.2.9.2. Products
- 14.2.9.3. SWOT Analysis
- 14.2.9.4. Recent Developments
- 14.2.9.5. Financials (Based on Availability)
- 14.2.1 Glenmark
List of Figures
- Figure 1: North America Biguanide Drugs Industry Revenue Breakdown (Million, %) by Product 2024 & 2032
- Figure 2: North America Biguanide Drugs Industry Share (%) by Company 2024
List of Tables
- Table 1: North America Biguanide Drugs Industry Revenue Million Forecast, by Region 2019 & 2032
- Table 2: North America Biguanide Drugs Industry Volume K Unit Forecast, by Region 2019 & 2032
- Table 3: North America Biguanide Drugs Industry Revenue Million Forecast, by Product Type 2019 & 2032
- Table 4: North America Biguanide Drugs Industry Volume K Unit Forecast, by Product Type 2019 & 2032
- Table 5: North America Biguanide Drugs Industry Revenue Million Forecast, by Application 2019 & 2032
- Table 6: North America Biguanide Drugs Industry Volume K Unit Forecast, by Application 2019 & 2032
- Table 7: North America Biguanide Drugs Industry Revenue Million Forecast, by Region 2019 & 2032
- Table 8: North America Biguanide Drugs Industry Volume K Unit Forecast, by Region 2019 & 2032
- Table 9: North America Biguanide Drugs Industry Revenue Million Forecast, by Country 2019 & 2032
- Table 10: North America Biguanide Drugs Industry Volume K Unit Forecast, by Country 2019 & 2032
- Table 11: United States North America Biguanide Drugs Industry Revenue (Million) Forecast, by Application 2019 & 2032
- Table 12: United States North America Biguanide Drugs Industry Volume (K Unit) Forecast, by Application 2019 & 2032
- Table 13: Canada North America Biguanide Drugs Industry Revenue (Million) Forecast, by Application 2019 & 2032
- Table 14: Canada North America Biguanide Drugs Industry Volume (K Unit) Forecast, by Application 2019 & 2032
- Table 15: Mexico North America Biguanide Drugs Industry Revenue (Million) Forecast, by Application 2019 & 2032
- Table 16: Mexico North America Biguanide Drugs Industry Volume (K Unit) Forecast, by Application 2019 & 2032
- Table 17: Rest of North America North America Biguanide Drugs Industry Revenue (Million) Forecast, by Application 2019 & 2032
- Table 18: Rest of North America North America Biguanide Drugs Industry Volume (K Unit) Forecast, by Application 2019 & 2032
- Table 19: North America Biguanide Drugs Industry Revenue Million Forecast, by Product Type 2019 & 2032
- Table 20: North America Biguanide Drugs Industry Volume K Unit Forecast, by Product Type 2019 & 2032
- Table 21: North America Biguanide Drugs Industry Revenue Million Forecast, by Application 2019 & 2032
- Table 22: North America Biguanide Drugs Industry Volume K Unit Forecast, by Application 2019 & 2032
- Table 23: North America Biguanide Drugs Industry Revenue Million Forecast, by Country 2019 & 2032
- Table 24: North America Biguanide Drugs Industry Volume K Unit Forecast, by Country 2019 & 2032
- Table 25: North America Biguanide Drugs Industry Revenue Million Forecast, by Product Type 2019 & 2032
- Table 26: North America Biguanide Drugs Industry Volume K Unit Forecast, by Product Type 2019 & 2032
- Table 27: North America Biguanide Drugs Industry Revenue Million Forecast, by Application 2019 & 2032
- Table 28: North America Biguanide Drugs Industry Volume K Unit Forecast, by Application 2019 & 2032
- Table 29: North America Biguanide Drugs Industry Revenue Million Forecast, by Country 2019 & 2032
- Table 30: North America Biguanide Drugs Industry Volume K Unit Forecast, by Country 2019 & 2032
- Table 31: North America Biguanide Drugs Industry Revenue Million Forecast, by Product Type 2019 & 2032
- Table 32: North America Biguanide Drugs Industry Volume K Unit Forecast, by Product Type 2019 & 2032
- Table 33: North America Biguanide Drugs Industry Revenue Million Forecast, by Application 2019 & 2032
- Table 34: North America Biguanide Drugs Industry Volume K Unit Forecast, by Application 2019 & 2032
- Table 35: North America Biguanide Drugs Industry Revenue Million Forecast, by Country 2019 & 2032
- Table 36: North America Biguanide Drugs Industry Volume K Unit Forecast, by Country 2019 & 2032
- Table 37: North America Biguanide Drugs Industry Revenue Million Forecast, by Product Type 2019 & 2032
- Table 38: North America Biguanide Drugs Industry Volume K Unit Forecast, by Product Type 2019 & 2032
- Table 39: North America Biguanide Drugs Industry Revenue Million Forecast, by Application 2019 & 2032
- Table 40: North America Biguanide Drugs Industry Volume K Unit Forecast, by Application 2019 & 2032
- Table 41: North America Biguanide Drugs Industry Revenue Million Forecast, by Country 2019 & 2032
- Table 42: North America Biguanide Drugs Industry Volume K Unit Forecast, by Country 2019 & 2032
Frequently Asked Questions
1. What is the projected Compound Annual Growth Rate (CAGR) of the North America Biguanide Drugs Industry?
The projected CAGR is approximately 2.59%.
2. Which companies are prominent players in the North America Biguanide Drugs Industry?
Key companies in the market include Glenmark, Takeda, Boehringer Ingelheim Pharmaceuticals, Other, GlaxoSmithKline, Sanofi, Merck, Zydus Cadila, Bristol-Myers Squibb.
3. What are the main segments of the North America Biguanide Drugs Industry?
The market segments include Product Type , Application .
4. Can you provide details about the market size?
The market size is estimated to be USD 1.36 Million as of 2022.
5. What are some drivers contributing to market growth?
Advancement in the Technology of Chromatography Instruments; Significance of Chromatography Based Studies in Drug Approval.
6. What are the notable trends driving market growth?
Rising diabetes prevalence.
7. Are there any restraints impacting market growth?
Rising Price of Equipment.
8. Can you provide examples of recent developments in the market?
February 2023: Zydus Lifesciences Limited received tentative approval from the USFDA for Invokamet tablets (canagliflozin and metformin hydrochloride combination). Canagliflozin and metformin combination products are indicated as an adjunct to diet and exercise. It is to improve glycemic control in adults with type 2 diabetes mellitus who are not adequately controlled on a regimen containing metformin or canagliflozin. It is also used in patients already treated with canagliflozin and metformin.
9. What pricing options are available for accessing the report?
Pricing options include single-user, multi-user, and enterprise licenses priced at USD 4750, USD 5250, and USD 8750 respectively.
10. Is the market size provided in terms of value or volume?
The market size is provided in terms of value, measured in Million and volume, measured in K Unit.
11. Are there any specific market keywords associated with the report?
Yes, the market keyword associated with the report is "North America Biguanide Drugs Industry," which aids in identifying and referencing the specific market segment covered.
12. How do I determine which pricing option suits my needs best?
The pricing options vary based on user requirements and access needs. Individual users may opt for single-user licenses, while businesses requiring broader access may choose multi-user or enterprise licenses for cost-effective access to the report.
13. Are there any additional resources or data provided in the North America Biguanide Drugs Industry report?
While the report offers comprehensive insights, it's advisable to review the specific contents or supplementary materials provided to ascertain if additional resources or data are available.
14. How can I stay updated on further developments or reports in the North America Biguanide Drugs Industry?
To stay informed about further developments, trends, and reports in the North America Biguanide Drugs Industry, consider subscribing to industry newsletters, following relevant companies and organizations, or regularly checking reputable industry news sources and publications.
Methodology
Step 1 - Identification of Relevant Samples Size from Population Database


Step 2 - Approaches for Defining Global Market Size (Value, Volume* & Price*)

Note*: In applicable scenarios
Step 3 - Data Sources
Primary Research
- Web Analytics
- Survey Reports
- Research Institute
- Latest Research Reports
- Opinion Leaders
Secondary Research
- Annual Reports
- White Paper
- Latest Press Release
- Industry Association
- Paid Database
- Investor Presentations

Step 4 - Data Triangulation
Involves using different sources of information in order to increase the validity of a study
These sources are likely to be stakeholders in a program - participants, other researchers, program staff, other community members, and so on.
Then we put all data in single framework & apply various statistical tools to find out the dynamic on the market.
During the analysis stage, feedback from the stakeholder groups would be compared to determine areas of agreement as well as areas of divergence
