

Key Insights
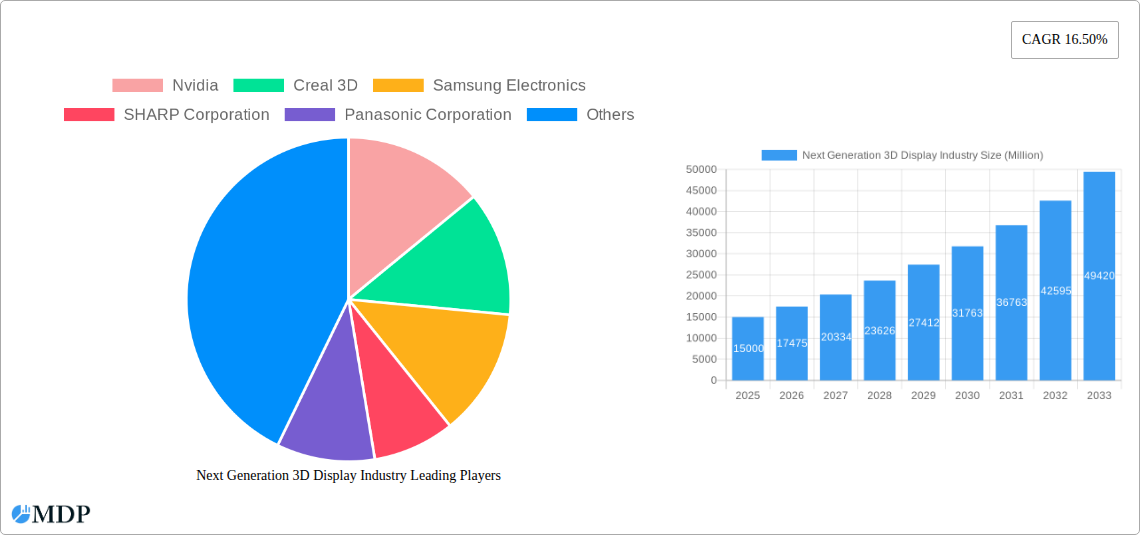
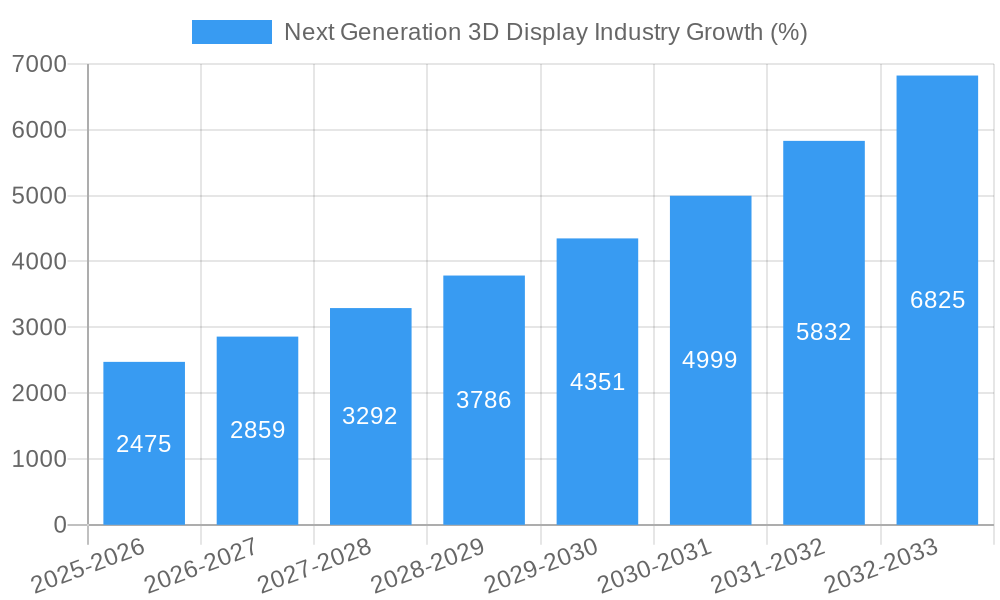
The next-generation 3D display market is experiencing robust growth, projected to reach a significant market size by 2033. A Compound Annual Growth Rate (CAGR) of 16.50% from 2025 to 2033 indicates a substantial expansion driven by several key factors. Advancements in display technologies like OLED, micro-displays, and DLP RPTV are enabling more immersive and realistic 3D experiences, fueling demand across various sectors. The increasing adoption of 3D displays in consumer electronics, particularly in high-end televisions and gaming devices, is a major driver. Furthermore, the automotive and transportation industries are integrating 3D displays into advanced driver-assistance systems (ADAS) and infotainment systems, boosting market growth. The medical sector utilizes 3D displays for surgical planning and training, while aerospace and defense leverage them for simulation and visualization. Though the initial high cost of some 3D display technologies may act as a restraint, ongoing technological improvements and economies of scale are gradually making them more accessible. The market segmentation reveals strong growth across various product types, including head-mounted displays (HMDs) and volumetric displays, each catering to specific application needs. Competition among key players like Nvidia, Samsung, and others is driving innovation and pushing technological boundaries, ultimately benefiting consumers and various industry verticals.
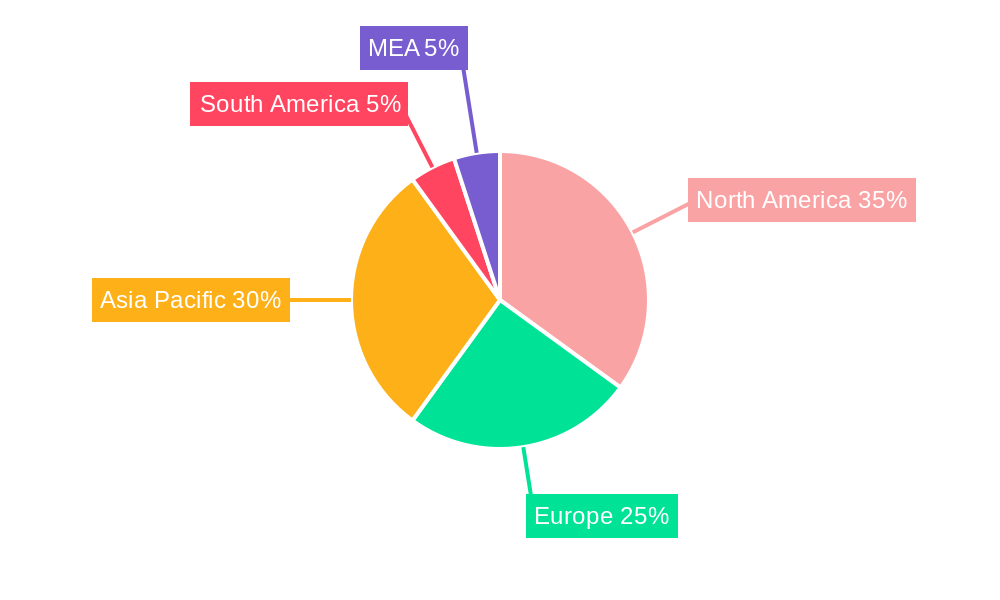
The geographical distribution of market share reflects the strong technological advancement and consumer adoption in North America and Asia Pacific. These regions are expected to maintain a dominant position, driven by early adoption of new technologies and a higher concentration of major players. However, other regions like Europe and the Asia Pacific (excluding China, Japan, South Korea) are anticipated to witness significant growth due to rising disposable incomes and increasing demand for advanced entertainment and technological solutions. This suggests a geographically diversified market with strong growth potential across multiple regions. The ongoing research and development efforts focused on improving resolution, brightness, and reducing the cost and power consumption of 3D displays are further expected to contribute to the market's expansion. The increasing convergence of 3D display technologies with artificial intelligence (AI) and virtual reality (VR) further enhances the potential for future innovations and market expansion.
Next Generation 3D Display Industry: A Comprehensive Market Report (2019-2033)
This comprehensive report provides an in-depth analysis of the next-generation 3D display industry, projecting a market value of xx Million by 2033. We delve into market dynamics, technological advancements, key players, and future growth opportunities, offering actionable insights for stakeholders across the value chain. The report covers the period 2019-2033, with a base year of 2025 and a forecast period of 2025-2033. This detailed analysis considers various segments including 3D Holographic Displays, Head Mounted Displays (HMDs), and Volumetric Displays, across diverse technologies like OLED, LCD, and LED, and end-user industries such as Consumer Electronics and Automotive.
Next Generation 3D Display Industry Market Dynamics & Concentration
The next-generation 3D display market is characterized by intense competition and rapid innovation. Market concentration is moderate, with several key players holding significant shares, but a fragmented landscape of smaller companies also driving innovation. The market share of the top 5 players is estimated at xx%, while the remaining xx% is distributed amongst numerous smaller companies. Innovation drivers include advancements in display technologies (e.g., micro-LED, holographic displays), increasing demand for immersive experiences (e.g., gaming, virtual reality), and the growing adoption of 3D displays in various sectors. Regulatory frameworks, while currently not overly restrictive, are evolving and may impact the market in the future. Product substitutes, such as traditional 2D displays, continue to compete, though the allure of immersive 3D experiences is gradually pushing market share toward 3D displays. End-user trends reveal strong growth in sectors such as consumer electronics, automotive, and medical. M&A activity has been significant, with approximately xx deals recorded in the last 5 years, primarily focused on acquiring technological expertise and expanding market reach.
Next Generation 3D Display Industry Industry Trends & Analysis
The next-generation 3D display market is experiencing robust growth, driven by several key factors. The Compound Annual Growth Rate (CAGR) from 2025 to 2033 is projected to be xx%, indicating strong market expansion. Technological disruptions, particularly in areas such as micro-LED and holographic displays, are significantly impacting market dynamics, leading to improved image quality, reduced costs, and wider adoption across various applications. Consumer preferences are shifting towards more immersive and realistic 3D experiences, fueling demand for advanced display technologies. Market penetration for 3D displays is gradually increasing, with xx% penetration in consumer electronics and xx% in the automotive sector by 2033. Competitive dynamics are intense, with companies focusing on product differentiation, technological innovation, and strategic partnerships to gain a competitive edge. The rising adoption of AR/VR technology, advancements in eye-tracking, and the increasing use of AI in display enhancement are significant contributors to market growth.
Leading Markets & Segments in Next Generation 3D Display Industry
The consumer electronics segment currently dominates the next-generation 3D display market, followed closely by automotive and transportation. Within product segments, Head Mounted Displays (HMDs) hold the largest market share, driven by the growing popularity of virtual and augmented reality applications. Geographically, North America and Asia-Pacific are the leading markets, fueled by high consumer demand and significant technological advancements.
- Key Drivers for North America: Strong consumer spending, advanced technological infrastructure, and a high adoption rate of new technologies.
- Key Drivers for Asia-Pacific: Rapid economic growth, a large consumer base, and a burgeoning manufacturing sector supporting the industry.
- Dominance Analysis: The dominance of HMDs within the product segment is primarily due to their affordability, portability, and compatibility with various applications. North America and Asia-Pacific's lead is based on established technological ecosystems, strong consumer demand and substantial investment in research & development. The automotive sector is rapidly gaining traction, driven by the incorporation of 3D displays in advanced driver-assistance systems (ADAS).
Next Generation 3D Display Industry Product Developments
Recent product innovations include AI-enhanced 3D displays offering compatibility with various existing content formats and display technologies (e.g., Metavista 3D's announcement). Glasses-free 3D displays, utilizing eye-tracking technology, are enhancing viewing experiences (as showcased by LG Electronics at CES 2023). These developments are improving market fit by addressing user needs for high-quality, immersive experiences and wider accessibility. Technological trends lean towards higher resolutions, improved brightness, and reduced power consumption.
Key Drivers of Next Generation 3D Display Industry Growth
Several factors are driving the growth of the next-generation 3D display industry. Technological advancements, particularly in micro-LED, OLED, and holographic technologies, are leading to higher-quality and more efficient displays. The increasing demand for immersive experiences in gaming, virtual reality (VR), and augmented reality (AR) applications fuels significant market growth. Economic factors such as rising disposable incomes, particularly in developing economies, contribute to increased consumer spending on advanced electronics. Supportive government policies and regulatory frameworks that encourage technological innovation further boost market growth.
Challenges in the Next Generation 3D Display Industry Market
The industry faces challenges such as high manufacturing costs, especially for advanced technologies like holographic displays. Supply chain disruptions and competition from established players can impact production and profitability. Regulatory hurdles in specific regions concerning emissions and energy efficiency are also factors. The market faces price competition from established 2D displays, and high initial investment cost for some of the technology.
Emerging Opportunities in Next Generation 3D Display Industry
The long-term growth potential of the next-generation 3D display market is significant. Technological breakthroughs in areas such as holographic displays and micro-LED will revolutionize the industry. Strategic partnerships between display manufacturers and content creators can drive market expansion. Expanding into new markets and applications, such as healthcare and industrial automation, can unlock new revenue streams.
Leading Players in the Next Generation 3D Display Industry Sector
- Nvidia
- Creal 3D
- Samsung Electronics
- SHARP Corporation
- Panasonic Corporation
- Continental AG
- Avegant Corp
- Robert Bosch GmbH
- Fovi 3D
- Coretronic Corporation
- Avalon Holographics Inc
- LG Electronics
- AU Optronics Corp
Key Milestones in Next Generation 3D Display Industry Industry
- April 2023: Metavista 3D announces AI-enhanced 3D displays compatible with various content formats and technologies, expanding applications to the metaverse, gaming, and video conferencing.
- January 2023: LG Electronics showcases glasses-free 3D display panels at CES 2023, utilizing eye-tracking technology for enhanced 3D effects.
Strategic Outlook for Next Generation 3D Display Industry Market
The next-generation 3D display market holds immense potential for growth. Strategic investments in research and development of advanced technologies like holographic displays and micro-LED are crucial for securing a competitive advantage. Focusing on user experience and creating diverse applications across various sectors are also vital for market expansion. Strategic partnerships and acquisitions will play a key role in shaping the future of this dynamic industry. The market is poised for substantial growth, driven by technological innovation, increasing demand, and the expansion into new markets.
Next Generation 3D Display Industry Segmentation
-
1. Product
- 1.1. 3D Holographic Display
- 1.2. Head Mounted Displays (HMD)
- 1.3. Static Volume Displays
- 1.4. Stereoscopy
- 1.5. Swept Volume Displays
- 1.6. Volumetric Displays
-
2. Technology
- 2.1. Digital
- 2.2. Light Emitting Diode (LED)
- 2.3. Organic Light Emitting Diode (OLED)
- 2.4. Plasma Display Panel (PDP)
- 2.5. Liquid Crystal Display (LCD)
-
3. Access Method
- 3.1. Micro Display
- 3.2. Conventional/Screen Based Display
-
4. End User Industry
- 4.1. Consumer Electronics
- 4.2. Automotive and Transportation
- 4.3. Medical
- 4.4. Aerospace & Defense
- 4.5. Industrial
- 4.6. Others
Next Generation 3D Display Industry Segmentation By Geography
- 1. North America
- 2. Europe
- 3. Asia
- 4. Australia and New Zealand
- 5. Latin America
- 6. Middle East and Africa
Next Generation 3D Display Industry REPORT HIGHLIGHTS
| Aspects | Details |
|---|---|
| Study Period | 2019-2033 |
| Base Year | 2024 |
| Estimated Year | 2025 |
| Forecast Period | 2025-2033 |
| Historical Period | 2019-2024 |
| Growth Rate | CAGR of 16.50% from 2019-2033 |
| Segmentation |
|
Table of Contents
- 1. Introduction
- 1.1. Research Scope
- 1.2. Market Segmentation
- 1.3. Research Methodology
- 1.4. Definitions and Assumptions
- 2. Executive Summary
- 2.1. Introduction
- 3. Market Dynamics
- 3.1. Introduction
- 3.2. Market Drivers
- 3.2.1. Increasing Growth of Automotive and Consumer Electronics Market; Rising Adoption of Digital Photo Frames and Head-mount Displays
- 3.3. Market Restrains
- 3.3.1. Lack of 3D Content Development; Cost-Intensive 3D Displays
- 3.4. Market Trends
- 3.4.1. Consumer Electronics to Provide Growth Opportunities
- 4. Market Factor Analysis
- 4.1. Porters Five Forces
- 4.2. Supply/Value Chain
- 4.3. PESTEL analysis
- 4.4. Market Entropy
- 4.5. Patent/Trademark Analysis
- 5. Global Next Generation 3D Display Industry Analysis, Insights and Forecast, 2019-2031
- 5.1. Market Analysis, Insights and Forecast - by Product
- 5.1.1. 3D Holographic Display
- 5.1.2. Head Mounted Displays (HMD)
- 5.1.3. Static Volume Displays
- 5.1.4. Stereoscopy
- 5.1.5. Swept Volume Displays
- 5.1.6. Volumetric Displays
- 5.2. Market Analysis, Insights and Forecast - by Technology
- 5.2.1. Digital
- 5.2.2. Light Emitting Diode (LED)
- 5.2.3. Organic Light Emitting Diode (OLED)
- 5.2.4. Plasma Display Panel (PDP)
- 5.2.5. Liquid Crystal Display (LCD)
- 5.3. Market Analysis, Insights and Forecast - by Access Method
- 5.3.1. Micro Display
- 5.3.2. Conventional/Screen Based Display
- 5.4. Market Analysis, Insights and Forecast - by End User Industry
- 5.4.1. Consumer Electronics
- 5.4.2. Automotive and Transportation
- 5.4.3. Medical
- 5.4.4. Aerospace & Defense
- 5.4.5. Industrial
- 5.4.6. Others
- 5.5. Market Analysis, Insights and Forecast - by Region
- 5.5.1. North America
- 5.5.2. Europe
- 5.5.3. Asia
- 5.5.4. Australia and New Zealand
- 5.5.5. Latin America
- 5.5.6. Middle East and Africa
- 5.1. Market Analysis, Insights and Forecast - by Product
- 6. North America Next Generation 3D Display Industry Analysis, Insights and Forecast, 2019-2031
- 6.1. Market Analysis, Insights and Forecast - by Product
- 6.1.1. 3D Holographic Display
- 6.1.2. Head Mounted Displays (HMD)
- 6.1.3. Static Volume Displays
- 6.1.4. Stereoscopy
- 6.1.5. Swept Volume Displays
- 6.1.6. Volumetric Displays
- 6.2. Market Analysis, Insights and Forecast - by Technology
- 6.2.1. Digital
- 6.2.2. Light Emitting Diode (LED)
- 6.2.3. Organic Light Emitting Diode (OLED)
- 6.2.4. Plasma Display Panel (PDP)
- 6.2.5. Liquid Crystal Display (LCD)
- 6.3. Market Analysis, Insights and Forecast - by Access Method
- 6.3.1. Micro Display
- 6.3.2. Conventional/Screen Based Display
- 6.4. Market Analysis, Insights and Forecast - by End User Industry
- 6.4.1. Consumer Electronics
- 6.4.2. Automotive and Transportation
- 6.4.3. Medical
- 6.4.4. Aerospace & Defense
- 6.4.5. Industrial
- 6.4.6. Others
- 6.1. Market Analysis, Insights and Forecast - by Product
- 7. Europe Next Generation 3D Display Industry Analysis, Insights and Forecast, 2019-2031
- 7.1. Market Analysis, Insights and Forecast - by Product
- 7.1.1. 3D Holographic Display
- 7.1.2. Head Mounted Displays (HMD)
- 7.1.3. Static Volume Displays
- 7.1.4. Stereoscopy
- 7.1.5. Swept Volume Displays
- 7.1.6. Volumetric Displays
- 7.2. Market Analysis, Insights and Forecast - by Technology
- 7.2.1. Digital
- 7.2.2. Light Emitting Diode (LED)
- 7.2.3. Organic Light Emitting Diode (OLED)
- 7.2.4. Plasma Display Panel (PDP)
- 7.2.5. Liquid Crystal Display (LCD)
- 7.3. Market Analysis, Insights and Forecast - by Access Method
- 7.3.1. Micro Display
- 7.3.2. Conventional/Screen Based Display
- 7.4. Market Analysis, Insights and Forecast - by End User Industry
- 7.4.1. Consumer Electronics
- 7.4.2. Automotive and Transportation
- 7.4.3. Medical
- 7.4.4. Aerospace & Defense
- 7.4.5. Industrial
- 7.4.6. Others
- 7.1. Market Analysis, Insights and Forecast - by Product
- 8. Asia Next Generation 3D Display Industry Analysis, Insights and Forecast, 2019-2031
- 8.1. Market Analysis, Insights and Forecast - by Product
- 8.1.1. 3D Holographic Display
- 8.1.2. Head Mounted Displays (HMD)
- 8.1.3. Static Volume Displays
- 8.1.4. Stereoscopy
- 8.1.5. Swept Volume Displays
- 8.1.6. Volumetric Displays
- 8.2. Market Analysis, Insights and Forecast - by Technology
- 8.2.1. Digital
- 8.2.2. Light Emitting Diode (LED)
- 8.2.3. Organic Light Emitting Diode (OLED)
- 8.2.4. Plasma Display Panel (PDP)
- 8.2.5. Liquid Crystal Display (LCD)
- 8.3. Market Analysis, Insights and Forecast - by Access Method
- 8.3.1. Micro Display
- 8.3.2. Conventional/Screen Based Display
- 8.4. Market Analysis, Insights and Forecast - by End User Industry
- 8.4.1. Consumer Electronics
- 8.4.2. Automotive and Transportation
- 8.4.3. Medical
- 8.4.4. Aerospace & Defense
- 8.4.5. Industrial
- 8.4.6. Others
- 8.1. Market Analysis, Insights and Forecast - by Product
- 9. Australia and New Zealand Next Generation 3D Display Industry Analysis, Insights and Forecast, 2019-2031
- 9.1. Market Analysis, Insights and Forecast - by Product
- 9.1.1. 3D Holographic Display
- 9.1.2. Head Mounted Displays (HMD)
- 9.1.3. Static Volume Displays
- 9.1.4. Stereoscopy
- 9.1.5. Swept Volume Displays
- 9.1.6. Volumetric Displays
- 9.2. Market Analysis, Insights and Forecast - by Technology
- 9.2.1. Digital
- 9.2.2. Light Emitting Diode (LED)
- 9.2.3. Organic Light Emitting Diode (OLED)
- 9.2.4. Plasma Display Panel (PDP)
- 9.2.5. Liquid Crystal Display (LCD)
- 9.3. Market Analysis, Insights and Forecast - by Access Method
- 9.3.1. Micro Display
- 9.3.2. Conventional/Screen Based Display
- 9.4. Market Analysis, Insights and Forecast - by End User Industry
- 9.4.1. Consumer Electronics
- 9.4.2. Automotive and Transportation
- 9.4.3. Medical
- 9.4.4. Aerospace & Defense
- 9.4.5. Industrial
- 9.4.6. Others
- 9.1. Market Analysis, Insights and Forecast - by Product
- 10. Latin America Next Generation 3D Display Industry Analysis, Insights and Forecast, 2019-2031
- 10.1. Market Analysis, Insights and Forecast - by Product
- 10.1.1. 3D Holographic Display
- 10.1.2. Head Mounted Displays (HMD)
- 10.1.3. Static Volume Displays
- 10.1.4. Stereoscopy
- 10.1.5. Swept Volume Displays
- 10.1.6. Volumetric Displays
- 10.2. Market Analysis, Insights and Forecast - by Technology
- 10.2.1. Digital
- 10.2.2. Light Emitting Diode (LED)
- 10.2.3. Organic Light Emitting Diode (OLED)
- 10.2.4. Plasma Display Panel (PDP)
- 10.2.5. Liquid Crystal Display (LCD)
- 10.3. Market Analysis, Insights and Forecast - by Access Method
- 10.3.1. Micro Display
- 10.3.2. Conventional/Screen Based Display
- 10.4. Market Analysis, Insights and Forecast - by End User Industry
- 10.4.1. Consumer Electronics
- 10.4.2. Automotive and Transportation
- 10.4.3. Medical
- 10.4.4. Aerospace & Defense
- 10.4.5. Industrial
- 10.4.6. Others
- 10.1. Market Analysis, Insights and Forecast - by Product
- 11. Middle East and Africa Next Generation 3D Display Industry Analysis, Insights and Forecast, 2019-2031
- 11.1. Market Analysis, Insights and Forecast - by Product
- 11.1.1. 3D Holographic Display
- 11.1.2. Head Mounted Displays (HMD)
- 11.1.3. Static Volume Displays
- 11.1.4. Stereoscopy
- 11.1.5. Swept Volume Displays
- 11.1.6. Volumetric Displays
- 11.2. Market Analysis, Insights and Forecast - by Technology
- 11.2.1. Digital
- 11.2.2. Light Emitting Diode (LED)
- 11.2.3. Organic Light Emitting Diode (OLED)
- 11.2.4. Plasma Display Panel (PDP)
- 11.2.5. Liquid Crystal Display (LCD)
- 11.3. Market Analysis, Insights and Forecast - by Access Method
- 11.3.1. Micro Display
- 11.3.2. Conventional/Screen Based Display
- 11.4. Market Analysis, Insights and Forecast - by End User Industry
- 11.4.1. Consumer Electronics
- 11.4.2. Automotive and Transportation
- 11.4.3. Medical
- 11.4.4. Aerospace & Defense
- 11.4.5. Industrial
- 11.4.6. Others
- 11.1. Market Analysis, Insights and Forecast - by Product
- 12. North America Next Generation 3D Display Industry Analysis, Insights and Forecast, 2019-2031
- 12.1. Market Analysis, Insights and Forecast - By Country/Sub-region
- 12.1.1 United States
- 12.1.2 Canada
- 12.1.3 Mexico
- 13. Europe Next Generation 3D Display Industry Analysis, Insights and Forecast, 2019-2031
- 13.1. Market Analysis, Insights and Forecast - By Country/Sub-region
- 13.1.1 Germany
- 13.1.2 United Kingdom
- 13.1.3 France
- 13.1.4 Spain
- 13.1.5 Italy
- 13.1.6 Spain
- 13.1.7 Belgium
- 13.1.8 Netherland
- 13.1.9 Nordics
- 13.1.10 Rest of Europe
- 14. Asia Pacific Next Generation 3D Display Industry Analysis, Insights and Forecast, 2019-2031
- 14.1. Market Analysis, Insights and Forecast - By Country/Sub-region
- 14.1.1 China
- 14.1.2 Japan
- 14.1.3 India
- 14.1.4 South Korea
- 14.1.5 Southeast Asia
- 14.1.6 Australia
- 14.1.7 Indonesia
- 14.1.8 Phillipes
- 14.1.9 Singapore
- 14.1.10 Thailandc
- 14.1.11 Rest of Asia Pacific
- 15. South America Next Generation 3D Display Industry Analysis, Insights and Forecast, 2019-2031
- 15.1. Market Analysis, Insights and Forecast - By Country/Sub-region
- 15.1.1 Brazil
- 15.1.2 Argentina
- 15.1.3 Peru
- 15.1.4 Chile
- 15.1.5 Colombia
- 15.1.6 Ecuador
- 15.1.7 Venezuela
- 15.1.8 Rest of South America
- 16. North America Next Generation 3D Display Industry Analysis, Insights and Forecast, 2019-2031
- 16.1. Market Analysis, Insights and Forecast - By Country/Sub-region
- 16.1.1 United States
- 16.1.2 Canada
- 16.1.3 Mexico
- 17. MEA Next Generation 3D Display Industry Analysis, Insights and Forecast, 2019-2031
- 17.1. Market Analysis, Insights and Forecast - By Country/Sub-region
- 17.1.1 United Arab Emirates
- 17.1.2 Saudi Arabia
- 17.1.3 South Africa
- 17.1.4 Rest of Middle East and Africa
- 18. Competitive Analysis
- 18.1. Global Market Share Analysis 2024
- 18.2. Company Profiles
- 18.2.1 Nvidia
- 18.2.1.1. Overview
- 18.2.1.2. Products
- 18.2.1.3. SWOT Analysis
- 18.2.1.4. Recent Developments
- 18.2.1.5. Financials (Based on Availability)
- 18.2.2 Creal 3D
- 18.2.2.1. Overview
- 18.2.2.2. Products
- 18.2.2.3. SWOT Analysis
- 18.2.2.4. Recent Developments
- 18.2.2.5. Financials (Based on Availability)
- 18.2.3 Samsung Electronics
- 18.2.3.1. Overview
- 18.2.3.2. Products
- 18.2.3.3. SWOT Analysis
- 18.2.3.4. Recent Developments
- 18.2.3.5. Financials (Based on Availability)
- 18.2.4 SHARP Corporation
- 18.2.4.1. Overview
- 18.2.4.2. Products
- 18.2.4.3. SWOT Analysis
- 18.2.4.4. Recent Developments
- 18.2.4.5. Financials (Based on Availability)
- 18.2.5 Panasonic Corporation
- 18.2.5.1. Overview
- 18.2.5.2. Products
- 18.2.5.3. SWOT Analysis
- 18.2.5.4. Recent Developments
- 18.2.5.5. Financials (Based on Availability)
- 18.2.6 Google
- 18.2.6.1. Overview
- 18.2.6.2. Products
- 18.2.6.3. SWOT Analysis
- 18.2.6.4. Recent Developments
- 18.2.6.5. Financials (Based on Availability)
- 18.2.7 Continental AG
- 18.2.7.1. Overview
- 18.2.7.2. Products
- 18.2.7.3. SWOT Analysis
- 18.2.7.4. Recent Developments
- 18.2.7.5. Financials (Based on Availability)
- 18.2.8 Avegant Corp
- 18.2.8.1. Overview
- 18.2.8.2. Products
- 18.2.8.3. SWOT Analysis
- 18.2.8.4. Recent Developments
- 18.2.8.5. Financials (Based on Availability)
- 18.2.9 Robert Bosch GmbH
- 18.2.9.1. Overview
- 18.2.9.2. Products
- 18.2.9.3. SWOT Analysis
- 18.2.9.4. Recent Developments
- 18.2.9.5. Financials (Based on Availability)
- 18.2.10 Fovi 3D
- 18.2.10.1. Overview
- 18.2.10.2. Products
- 18.2.10.3. SWOT Analysis
- 18.2.10.4. Recent Developments
- 18.2.10.5. Financials (Based on Availability)
- 18.2.11 Coretronic Corporation
- 18.2.11.1. Overview
- 18.2.11.2. Products
- 18.2.11.3. SWOT Analysis
- 18.2.11.4. Recent Developments
- 18.2.11.5. Financials (Based on Availability)
- 18.2.12 Avalon Holographics Inc
- 18.2.12.1. Overview
- 18.2.12.2. Products
- 18.2.12.3. SWOT Analysis
- 18.2.12.4. Recent Developments
- 18.2.12.5. Financials (Based on Availability)
- 18.2.13 LG Electronics
- 18.2.13.1. Overview
- 18.2.13.2. Products
- 18.2.13.3. SWOT Analysis
- 18.2.13.4. Recent Developments
- 18.2.13.5. Financials (Based on Availability)
- 18.2.14 AU Optronics Corp
- 18.2.14.1. Overview
- 18.2.14.2. Products
- 18.2.14.3. SWOT Analysis
- 18.2.14.4. Recent Developments
- 18.2.14.5. Financials (Based on Availability)
- 18.2.1 Nvidia
List of Figures
- Figure 1: Global Next Generation 3D Display Industry Revenue Breakdown (Million, %) by Region 2024 & 2032
- Figure 2: Global Next Generation 3D Display Industry Volume Breakdown (K Unit, %) by Region 2024 & 2032
- Figure 3: North America Next Generation 3D Display Industry Revenue (Million), by Country 2024 & 2032
- Figure 4: North America Next Generation 3D Display Industry Volume (K Unit), by Country 2024 & 2032
- Figure 5: North America Next Generation 3D Display Industry Revenue Share (%), by Country 2024 & 2032
- Figure 6: North America Next Generation 3D Display Industry Volume Share (%), by Country 2024 & 2032
- Figure 7: Europe Next Generation 3D Display Industry Revenue (Million), by Country 2024 & 2032
- Figure 8: Europe Next Generation 3D Display Industry Volume (K Unit), by Country 2024 & 2032
- Figure 9: Europe Next Generation 3D Display Industry Revenue Share (%), by Country 2024 & 2032
- Figure 10: Europe Next Generation 3D Display Industry Volume Share (%), by Country 2024 & 2032
- Figure 11: Asia Pacific Next Generation 3D Display Industry Revenue (Million), by Country 2024 & 2032
- Figure 12: Asia Pacific Next Generation 3D Display Industry Volume (K Unit), by Country 2024 & 2032
- Figure 13: Asia Pacific Next Generation 3D Display Industry Revenue Share (%), by Country 2024 & 2032
- Figure 14: Asia Pacific Next Generation 3D Display Industry Volume Share (%), by Country 2024 & 2032
- Figure 15: South America Next Generation 3D Display Industry Revenue (Million), by Country 2024 & 2032
- Figure 16: South America Next Generation 3D Display Industry Volume (K Unit), by Country 2024 & 2032
- Figure 17: South America Next Generation 3D Display Industry Revenue Share (%), by Country 2024 & 2032
- Figure 18: South America Next Generation 3D Display Industry Volume Share (%), by Country 2024 & 2032
- Figure 19: North America Next Generation 3D Display Industry Revenue (Million), by Country 2024 & 2032
- Figure 20: North America Next Generation 3D Display Industry Volume (K Unit), by Country 2024 & 2032
- Figure 21: North America Next Generation 3D Display Industry Revenue Share (%), by Country 2024 & 2032
- Figure 22: North America Next Generation 3D Display Industry Volume Share (%), by Country 2024 & 2032
- Figure 23: MEA Next Generation 3D Display Industry Revenue (Million), by Country 2024 & 2032
- Figure 24: MEA Next Generation 3D Display Industry Volume (K Unit), by Country 2024 & 2032
- Figure 25: MEA Next Generation 3D Display Industry Revenue Share (%), by Country 2024 & 2032
- Figure 26: MEA Next Generation 3D Display Industry Volume Share (%), by Country 2024 & 2032
- Figure 27: North America Next Generation 3D Display Industry Revenue (Million), by Product 2024 & 2032
- Figure 28: North America Next Generation 3D Display Industry Volume (K Unit), by Product 2024 & 2032
- Figure 29: North America Next Generation 3D Display Industry Revenue Share (%), by Product 2024 & 2032
- Figure 30: North America Next Generation 3D Display Industry Volume Share (%), by Product 2024 & 2032
- Figure 31: North America Next Generation 3D Display Industry Revenue (Million), by Technology 2024 & 2032
- Figure 32: North America Next Generation 3D Display Industry Volume (K Unit), by Technology 2024 & 2032
- Figure 33: North America Next Generation 3D Display Industry Revenue Share (%), by Technology 2024 & 2032
- Figure 34: North America Next Generation 3D Display Industry Volume Share (%), by Technology 2024 & 2032
- Figure 35: North America Next Generation 3D Display Industry Revenue (Million), by Access Method 2024 & 2032
- Figure 36: North America Next Generation 3D Display Industry Volume (K Unit), by Access Method 2024 & 2032
- Figure 37: North America Next Generation 3D Display Industry Revenue Share (%), by Access Method 2024 & 2032
- Figure 38: North America Next Generation 3D Display Industry Volume Share (%), by Access Method 2024 & 2032
- Figure 39: North America Next Generation 3D Display Industry Revenue (Million), by End User Industry 2024 & 2032
- Figure 40: North America Next Generation 3D Display Industry Volume (K Unit), by End User Industry 2024 & 2032
- Figure 41: North America Next Generation 3D Display Industry Revenue Share (%), by End User Industry 2024 & 2032
- Figure 42: North America Next Generation 3D Display Industry Volume Share (%), by End User Industry 2024 & 2032
- Figure 43: North America Next Generation 3D Display Industry Revenue (Million), by Country 2024 & 2032
- Figure 44: North America Next Generation 3D Display Industry Volume (K Unit), by Country 2024 & 2032
- Figure 45: North America Next Generation 3D Display Industry Revenue Share (%), by Country 2024 & 2032
- Figure 46: North America Next Generation 3D Display Industry Volume Share (%), by Country 2024 & 2032
- Figure 47: Europe Next Generation 3D Display Industry Revenue (Million), by Product 2024 & 2032
- Figure 48: Europe Next Generation 3D Display Industry Volume (K Unit), by Product 2024 & 2032
- Figure 49: Europe Next Generation 3D Display Industry Revenue Share (%), by Product 2024 & 2032
- Figure 50: Europe Next Generation 3D Display Industry Volume Share (%), by Product 2024 & 2032
- Figure 51: Europe Next Generation 3D Display Industry Revenue (Million), by Technology 2024 & 2032
- Figure 52: Europe Next Generation 3D Display Industry Volume (K Unit), by Technology 2024 & 2032
- Figure 53: Europe Next Generation 3D Display Industry Revenue Share (%), by Technology 2024 & 2032
- Figure 54: Europe Next Generation 3D Display Industry Volume Share (%), by Technology 2024 & 2032
- Figure 55: Europe Next Generation 3D Display Industry Revenue (Million), by Access Method 2024 & 2032
- Figure 56: Europe Next Generation 3D Display Industry Volume (K Unit), by Access Method 2024 & 2032
- Figure 57: Europe Next Generation 3D Display Industry Revenue Share (%), by Access Method 2024 & 2032
- Figure 58: Europe Next Generation 3D Display Industry Volume Share (%), by Access Method 2024 & 2032
- Figure 59: Europe Next Generation 3D Display Industry Revenue (Million), by End User Industry 2024 & 2032
- Figure 60: Europe Next Generation 3D Display Industry Volume (K Unit), by End User Industry 2024 & 2032
- Figure 61: Europe Next Generation 3D Display Industry Revenue Share (%), by End User Industry 2024 & 2032
- Figure 62: Europe Next Generation 3D Display Industry Volume Share (%), by End User Industry 2024 & 2032
- Figure 63: Europe Next Generation 3D Display Industry Revenue (Million), by Country 2024 & 2032
- Figure 64: Europe Next Generation 3D Display Industry Volume (K Unit), by Country 2024 & 2032
- Figure 65: Europe Next Generation 3D Display Industry Revenue Share (%), by Country 2024 & 2032
- Figure 66: Europe Next Generation 3D Display Industry Volume Share (%), by Country 2024 & 2032
- Figure 67: Asia Next Generation 3D Display Industry Revenue (Million), by Product 2024 & 2032
- Figure 68: Asia Next Generation 3D Display Industry Volume (K Unit), by Product 2024 & 2032
- Figure 69: Asia Next Generation 3D Display Industry Revenue Share (%), by Product 2024 & 2032
- Figure 70: Asia Next Generation 3D Display Industry Volume Share (%), by Product 2024 & 2032
- Figure 71: Asia Next Generation 3D Display Industry Revenue (Million), by Technology 2024 & 2032
- Figure 72: Asia Next Generation 3D Display Industry Volume (K Unit), by Technology 2024 & 2032
- Figure 73: Asia Next Generation 3D Display Industry Revenue Share (%), by Technology 2024 & 2032
- Figure 74: Asia Next Generation 3D Display Industry Volume Share (%), by Technology 2024 & 2032
- Figure 75: Asia Next Generation 3D Display Industry Revenue (Million), by Access Method 2024 & 2032
- Figure 76: Asia Next Generation 3D Display Industry Volume (K Unit), by Access Method 2024 & 2032
- Figure 77: Asia Next Generation 3D Display Industry Revenue Share (%), by Access Method 2024 & 2032
- Figure 78: Asia Next Generation 3D Display Industry Volume Share (%), by Access Method 2024 & 2032
- Figure 79: Asia Next Generation 3D Display Industry Revenue (Million), by End User Industry 2024 & 2032
- Figure 80: Asia Next Generation 3D Display Industry Volume (K Unit), by End User Industry 2024 & 2032
- Figure 81: Asia Next Generation 3D Display Industry Revenue Share (%), by End User Industry 2024 & 2032
- Figure 82: Asia Next Generation 3D Display Industry Volume Share (%), by End User Industry 2024 & 2032
- Figure 83: Asia Next Generation 3D Display Industry Revenue (Million), by Country 2024 & 2032
- Figure 84: Asia Next Generation 3D Display Industry Volume (K Unit), by Country 2024 & 2032
- Figure 85: Asia Next Generation 3D Display Industry Revenue Share (%), by Country 2024 & 2032
- Figure 86: Asia Next Generation 3D Display Industry Volume Share (%), by Country 2024 & 2032
- Figure 87: Australia and New Zealand Next Generation 3D Display Industry Revenue (Million), by Product 2024 & 2032
- Figure 88: Australia and New Zealand Next Generation 3D Display Industry Volume (K Unit), by Product 2024 & 2032
- Figure 89: Australia and New Zealand Next Generation 3D Display Industry Revenue Share (%), by Product 2024 & 2032
- Figure 90: Australia and New Zealand Next Generation 3D Display Industry Volume Share (%), by Product 2024 & 2032
- Figure 91: Australia and New Zealand Next Generation 3D Display Industry Revenue (Million), by Technology 2024 & 2032
- Figure 92: Australia and New Zealand Next Generation 3D Display Industry Volume (K Unit), by Technology 2024 & 2032
- Figure 93: Australia and New Zealand Next Generation 3D Display Industry Revenue Share (%), by Technology 2024 & 2032
- Figure 94: Australia and New Zealand Next Generation 3D Display Industry Volume Share (%), by Technology 2024 & 2032
- Figure 95: Australia and New Zealand Next Generation 3D Display Industry Revenue (Million), by Access Method 2024 & 2032
- Figure 96: Australia and New Zealand Next Generation 3D Display Industry Volume (K Unit), by Access Method 2024 & 2032
- Figure 97: Australia and New Zealand Next Generation 3D Display Industry Revenue Share (%), by Access Method 2024 & 2032
- Figure 98: Australia and New Zealand Next Generation 3D Display Industry Volume Share (%), by Access Method 2024 & 2032
- Figure 99: Australia and New Zealand Next Generation 3D Display Industry Revenue (Million), by End User Industry 2024 & 2032
- Figure 100: Australia and New Zealand Next Generation 3D Display Industry Volume (K Unit), by End User Industry 2024 & 2032
- Figure 101: Australia and New Zealand Next Generation 3D Display Industry Revenue Share (%), by End User Industry 2024 & 2032
- Figure 102: Australia and New Zealand Next Generation 3D Display Industry Volume Share (%), by End User Industry 2024 & 2032
- Figure 103: Australia and New Zealand Next Generation 3D Display Industry Revenue (Million), by Country 2024 & 2032
- Figure 104: Australia and New Zealand Next Generation 3D Display Industry Volume (K Unit), by Country 2024 & 2032
- Figure 105: Australia and New Zealand Next Generation 3D Display Industry Revenue Share (%), by Country 2024 & 2032
- Figure 106: Australia and New Zealand Next Generation 3D Display Industry Volume Share (%), by Country 2024 & 2032
- Figure 107: Latin America Next Generation 3D Display Industry Revenue (Million), by Product 2024 & 2032
- Figure 108: Latin America Next Generation 3D Display Industry Volume (K Unit), by Product 2024 & 2032
- Figure 109: Latin America Next Generation 3D Display Industry Revenue Share (%), by Product 2024 & 2032
- Figure 110: Latin America Next Generation 3D Display Industry Volume Share (%), by Product 2024 & 2032
- Figure 111: Latin America Next Generation 3D Display Industry Revenue (Million), by Technology 2024 & 2032
- Figure 112: Latin America Next Generation 3D Display Industry Volume (K Unit), by Technology 2024 & 2032
- Figure 113: Latin America Next Generation 3D Display Industry Revenue Share (%), by Technology 2024 & 2032
- Figure 114: Latin America Next Generation 3D Display Industry Volume Share (%), by Technology 2024 & 2032
- Figure 115: Latin America Next Generation 3D Display Industry Revenue (Million), by Access Method 2024 & 2032
- Figure 116: Latin America Next Generation 3D Display Industry Volume (K Unit), by Access Method 2024 & 2032
- Figure 117: Latin America Next Generation 3D Display Industry Revenue Share (%), by Access Method 2024 & 2032
- Figure 118: Latin America Next Generation 3D Display Industry Volume Share (%), by Access Method 2024 & 2032
- Figure 119: Latin America Next Generation 3D Display Industry Revenue (Million), by End User Industry 2024 & 2032
- Figure 120: Latin America Next Generation 3D Display Industry Volume (K Unit), by End User Industry 2024 & 2032
- Figure 121: Latin America Next Generation 3D Display Industry Revenue Share (%), by End User Industry 2024 & 2032
- Figure 122: Latin America Next Generation 3D Display Industry Volume Share (%), by End User Industry 2024 & 2032
- Figure 123: Latin America Next Generation 3D Display Industry Revenue (Million), by Country 2024 & 2032
- Figure 124: Latin America Next Generation 3D Display Industry Volume (K Unit), by Country 2024 & 2032
- Figure 125: Latin America Next Generation 3D Display Industry Revenue Share (%), by Country 2024 & 2032
- Figure 126: Latin America Next Generation 3D Display Industry Volume Share (%), by Country 2024 & 2032
- Figure 127: Middle East and Africa Next Generation 3D Display Industry Revenue (Million), by Product 2024 & 2032
- Figure 128: Middle East and Africa Next Generation 3D Display Industry Volume (K Unit), by Product 2024 & 2032
- Figure 129: Middle East and Africa Next Generation 3D Display Industry Revenue Share (%), by Product 2024 & 2032
- Figure 130: Middle East and Africa Next Generation 3D Display Industry Volume Share (%), by Product 2024 & 2032
- Figure 131: Middle East and Africa Next Generation 3D Display Industry Revenue (Million), by Technology 2024 & 2032
- Figure 132: Middle East and Africa Next Generation 3D Display Industry Volume (K Unit), by Technology 2024 & 2032
- Figure 133: Middle East and Africa Next Generation 3D Display Industry Revenue Share (%), by Technology 2024 & 2032
- Figure 134: Middle East and Africa Next Generation 3D Display Industry Volume Share (%), by Technology 2024 & 2032
- Figure 135: Middle East and Africa Next Generation 3D Display Industry Revenue (Million), by Access Method 2024 & 2032
- Figure 136: Middle East and Africa Next Generation 3D Display Industry Volume (K Unit), by Access Method 2024 & 2032
- Figure 137: Middle East and Africa Next Generation 3D Display Industry Revenue Share (%), by Access Method 2024 & 2032
- Figure 138: Middle East and Africa Next Generation 3D Display Industry Volume Share (%), by Access Method 2024 & 2032
- Figure 139: Middle East and Africa Next Generation 3D Display Industry Revenue (Million), by End User Industry 2024 & 2032
- Figure 140: Middle East and Africa Next Generation 3D Display Industry Volume (K Unit), by End User Industry 2024 & 2032
- Figure 141: Middle East and Africa Next Generation 3D Display Industry Revenue Share (%), by End User Industry 2024 & 2032
- Figure 142: Middle East and Africa Next Generation 3D Display Industry Volume Share (%), by End User Industry 2024 & 2032
- Figure 143: Middle East and Africa Next Generation 3D Display Industry Revenue (Million), by Country 2024 & 2032
- Figure 144: Middle East and Africa Next Generation 3D Display Industry Volume (K Unit), by Country 2024 & 2032
- Figure 145: Middle East and Africa Next Generation 3D Display Industry Revenue Share (%), by Country 2024 & 2032
- Figure 146: Middle East and Africa Next Generation 3D Display Industry Volume Share (%), by Country 2024 & 2032
List of Tables
- Table 1: Global Next Generation 3D Display Industry Revenue Million Forecast, by Region 2019 & 2032
- Table 2: Global Next Generation 3D Display Industry Volume K Unit Forecast, by Region 2019 & 2032
- Table 3: Global Next Generation 3D Display Industry Revenue Million Forecast, by Product 2019 & 2032
- Table 4: Global Next Generation 3D Display Industry Volume K Unit Forecast, by Product 2019 & 2032
- Table 5: Global Next Generation 3D Display Industry Revenue Million Forecast, by Technology 2019 & 2032
- Table 6: Global Next Generation 3D Display Industry Volume K Unit Forecast, by Technology 2019 & 2032
- Table 7: Global Next Generation 3D Display Industry Revenue Million Forecast, by Access Method 2019 & 2032
- Table 8: Global Next Generation 3D Display Industry Volume K Unit Forecast, by Access Method 2019 & 2032
- Table 9: Global Next Generation 3D Display Industry Revenue Million Forecast, by End User Industry 2019 & 2032
- Table 10: Global Next Generation 3D Display Industry Volume K Unit Forecast, by End User Industry 2019 & 2032
- Table 11: Global Next Generation 3D Display Industry Revenue Million Forecast, by Region 2019 & 2032
- Table 12: Global Next Generation 3D Display Industry Volume K Unit Forecast, by Region 2019 & 2032
- Table 13: Global Next Generation 3D Display Industry Revenue Million Forecast, by Country 2019 & 2032
- Table 14: Global Next Generation 3D Display Industry Volume K Unit Forecast, by Country 2019 & 2032
- Table 15: United States Next Generation 3D Display Industry Revenue (Million) Forecast, by Application 2019 & 2032
- Table 16: United States Next Generation 3D Display Industry Volume (K Unit) Forecast, by Application 2019 & 2032
- Table 17: Canada Next Generation 3D Display Industry Revenue (Million) Forecast, by Application 2019 & 2032
- Table 18: Canada Next Generation 3D Display Industry Volume (K Unit) Forecast, by Application 2019 & 2032
- Table 19: Mexico Next Generation 3D Display Industry Revenue (Million) Forecast, by Application 2019 & 2032
- Table 20: Mexico Next Generation 3D Display Industry Volume (K Unit) Forecast, by Application 2019 & 2032
- Table 21: Global Next Generation 3D Display Industry Revenue Million Forecast, by Country 2019 & 2032
- Table 22: Global Next Generation 3D Display Industry Volume K Unit Forecast, by Country 2019 & 2032
- Table 23: Germany Next Generation 3D Display Industry Revenue (Million) Forecast, by Application 2019 & 2032
- Table 24: Germany Next Generation 3D Display Industry Volume (K Unit) Forecast, by Application 2019 & 2032
- Table 25: United Kingdom Next Generation 3D Display Industry Revenue (Million) Forecast, by Application 2019 & 2032
- Table 26: United Kingdom Next Generation 3D Display Industry Volume (K Unit) Forecast, by Application 2019 & 2032
- Table 27: France Next Generation 3D Display Industry Revenue (Million) Forecast, by Application 2019 & 2032
- Table 28: France Next Generation 3D Display Industry Volume (K Unit) Forecast, by Application 2019 & 2032
- Table 29: Spain Next Generation 3D Display Industry Revenue (Million) Forecast, by Application 2019 & 2032
- Table 30: Spain Next Generation 3D Display Industry Volume (K Unit) Forecast, by Application 2019 & 2032
- Table 31: Italy Next Generation 3D Display Industry Revenue (Million) Forecast, by Application 2019 & 2032
- Table 32: Italy Next Generation 3D Display Industry Volume (K Unit) Forecast, by Application 2019 & 2032
- Table 33: Spain Next Generation 3D Display Industry Revenue (Million) Forecast, by Application 2019 & 2032
- Table 34: Spain Next Generation 3D Display Industry Volume (K Unit) Forecast, by Application 2019 & 2032
- Table 35: Belgium Next Generation 3D Display Industry Revenue (Million) Forecast, by Application 2019 & 2032
- Table 36: Belgium Next Generation 3D Display Industry Volume (K Unit) Forecast, by Application 2019 & 2032
- Table 37: Netherland Next Generation 3D Display Industry Revenue (Million) Forecast, by Application 2019 & 2032
- Table 38: Netherland Next Generation 3D Display Industry Volume (K Unit) Forecast, by Application 2019 & 2032
- Table 39: Nordics Next Generation 3D Display Industry Revenue (Million) Forecast, by Application 2019 & 2032
- Table 40: Nordics Next Generation 3D Display Industry Volume (K Unit) Forecast, by Application 2019 & 2032
- Table 41: Rest of Europe Next Generation 3D Display Industry Revenue (Million) Forecast, by Application 2019 & 2032
- Table 42: Rest of Europe Next Generation 3D Display Industry Volume (K Unit) Forecast, by Application 2019 & 2032
- Table 43: Global Next Generation 3D Display Industry Revenue Million Forecast, by Country 2019 & 2032
- Table 44: Global Next Generation 3D Display Industry Volume K Unit Forecast, by Country 2019 & 2032
- Table 45: China Next Generation 3D Display Industry Revenue (Million) Forecast, by Application 2019 & 2032
- Table 46: China Next Generation 3D Display Industry Volume (K Unit) Forecast, by Application 2019 & 2032
- Table 47: Japan Next Generation 3D Display Industry Revenue (Million) Forecast, by Application 2019 & 2032
- Table 48: Japan Next Generation 3D Display Industry Volume (K Unit) Forecast, by Application 2019 & 2032
- Table 49: India Next Generation 3D Display Industry Revenue (Million) Forecast, by Application 2019 & 2032
- Table 50: India Next Generation 3D Display Industry Volume (K Unit) Forecast, by Application 2019 & 2032
- Table 51: South Korea Next Generation 3D Display Industry Revenue (Million) Forecast, by Application 2019 & 2032
- Table 52: South Korea Next Generation 3D Display Industry Volume (K Unit) Forecast, by Application 2019 & 2032
- Table 53: Southeast Asia Next Generation 3D Display Industry Revenue (Million) Forecast, by Application 2019 & 2032
- Table 54: Southeast Asia Next Generation 3D Display Industry Volume (K Unit) Forecast, by Application 2019 & 2032
- Table 55: Australia Next Generation 3D Display Industry Revenue (Million) Forecast, by Application 2019 & 2032
- Table 56: Australia Next Generation 3D Display Industry Volume (K Unit) Forecast, by Application 2019 & 2032
- Table 57: Indonesia Next Generation 3D Display Industry Revenue (Million) Forecast, by Application 2019 & 2032
- Table 58: Indonesia Next Generation 3D Display Industry Volume (K Unit) Forecast, by Application 2019 & 2032
- Table 59: Phillipes Next Generation 3D Display Industry Revenue (Million) Forecast, by Application 2019 & 2032
- Table 60: Phillipes Next Generation 3D Display Industry Volume (K Unit) Forecast, by Application 2019 & 2032
- Table 61: Singapore Next Generation 3D Display Industry Revenue (Million) Forecast, by Application 2019 & 2032
- Table 62: Singapore Next Generation 3D Display Industry Volume (K Unit) Forecast, by Application 2019 & 2032
- Table 63: Thailandc Next Generation 3D Display Industry Revenue (Million) Forecast, by Application 2019 & 2032
- Table 64: Thailandc Next Generation 3D Display Industry Volume (K Unit) Forecast, by Application 2019 & 2032
- Table 65: Rest of Asia Pacific Next Generation 3D Display Industry Revenue (Million) Forecast, by Application 2019 & 2032
- Table 66: Rest of Asia Pacific Next Generation 3D Display Industry Volume (K Unit) Forecast, by Application 2019 & 2032
- Table 67: Global Next Generation 3D Display Industry Revenue Million Forecast, by Country 2019 & 2032
- Table 68: Global Next Generation 3D Display Industry Volume K Unit Forecast, by Country 2019 & 2032
- Table 69: Brazil Next Generation 3D Display Industry Revenue (Million) Forecast, by Application 2019 & 2032
- Table 70: Brazil Next Generation 3D Display Industry Volume (K Unit) Forecast, by Application 2019 & 2032
- Table 71: Argentina Next Generation 3D Display Industry Revenue (Million) Forecast, by Application 2019 & 2032
- Table 72: Argentina Next Generation 3D Display Industry Volume (K Unit) Forecast, by Application 2019 & 2032
- Table 73: Peru Next Generation 3D Display Industry Revenue (Million) Forecast, by Application 2019 & 2032
- Table 74: Peru Next Generation 3D Display Industry Volume (K Unit) Forecast, by Application 2019 & 2032
- Table 75: Chile Next Generation 3D Display Industry Revenue (Million) Forecast, by Application 2019 & 2032
- Table 76: Chile Next Generation 3D Display Industry Volume (K Unit) Forecast, by Application 2019 & 2032
- Table 77: Colombia Next Generation 3D Display Industry Revenue (Million) Forecast, by Application 2019 & 2032
- Table 78: Colombia Next Generation 3D Display Industry Volume (K Unit) Forecast, by Application 2019 & 2032
- Table 79: Ecuador Next Generation 3D Display Industry Revenue (Million) Forecast, by Application 2019 & 2032
- Table 80: Ecuador Next Generation 3D Display Industry Volume (K Unit) Forecast, by Application 2019 & 2032
- Table 81: Venezuela Next Generation 3D Display Industry Revenue (Million) Forecast, by Application 2019 & 2032
- Table 82: Venezuela Next Generation 3D Display Industry Volume (K Unit) Forecast, by Application 2019 & 2032
- Table 83: Rest of South America Next Generation 3D Display Industry Revenue (Million) Forecast, by Application 2019 & 2032
- Table 84: Rest of South America Next Generation 3D Display Industry Volume (K Unit) Forecast, by Application 2019 & 2032
- Table 85: Global Next Generation 3D Display Industry Revenue Million Forecast, by Country 2019 & 2032
- Table 86: Global Next Generation 3D Display Industry Volume K Unit Forecast, by Country 2019 & 2032
- Table 87: United States Next Generation 3D Display Industry Revenue (Million) Forecast, by Application 2019 & 2032
- Table 88: United States Next Generation 3D Display Industry Volume (K Unit) Forecast, by Application 2019 & 2032
- Table 89: Canada Next Generation 3D Display Industry Revenue (Million) Forecast, by Application 2019 & 2032
- Table 90: Canada Next Generation 3D Display Industry Volume (K Unit) Forecast, by Application 2019 & 2032
- Table 91: Mexico Next Generation 3D Display Industry Revenue (Million) Forecast, by Application 2019 & 2032
- Table 92: Mexico Next Generation 3D Display Industry Volume (K Unit) Forecast, by Application 2019 & 2032
- Table 93: Global Next Generation 3D Display Industry Revenue Million Forecast, by Country 2019 & 2032
- Table 94: Global Next Generation 3D Display Industry Volume K Unit Forecast, by Country 2019 & 2032
- Table 95: United Arab Emirates Next Generation 3D Display Industry Revenue (Million) Forecast, by Application 2019 & 2032
- Table 96: United Arab Emirates Next Generation 3D Display Industry Volume (K Unit) Forecast, by Application 2019 & 2032
- Table 97: Saudi Arabia Next Generation 3D Display Industry Revenue (Million) Forecast, by Application 2019 & 2032
- Table 98: Saudi Arabia Next Generation 3D Display Industry Volume (K Unit) Forecast, by Application 2019 & 2032
- Table 99: South Africa Next Generation 3D Display Industry Revenue (Million) Forecast, by Application 2019 & 2032
- Table 100: South Africa Next Generation 3D Display Industry Volume (K Unit) Forecast, by Application 2019 & 2032
- Table 101: Rest of Middle East and Africa Next Generation 3D Display Industry Revenue (Million) Forecast, by Application 2019 & 2032
- Table 102: Rest of Middle East and Africa Next Generation 3D Display Industry Volume (K Unit) Forecast, by Application 2019 & 2032
- Table 103: Global Next Generation 3D Display Industry Revenue Million Forecast, by Product 2019 & 2032
- Table 104: Global Next Generation 3D Display Industry Volume K Unit Forecast, by Product 2019 & 2032
- Table 105: Global Next Generation 3D Display Industry Revenue Million Forecast, by Technology 2019 & 2032
- Table 106: Global Next Generation 3D Display Industry Volume K Unit Forecast, by Technology 2019 & 2032
- Table 107: Global Next Generation 3D Display Industry Revenue Million Forecast, by Access Method 2019 & 2032
- Table 108: Global Next Generation 3D Display Industry Volume K Unit Forecast, by Access Method 2019 & 2032
- Table 109: Global Next Generation 3D Display Industry Revenue Million Forecast, by End User Industry 2019 & 2032
- Table 110: Global Next Generation 3D Display Industry Volume K Unit Forecast, by End User Industry 2019 & 2032
- Table 111: Global Next Generation 3D Display Industry Revenue Million Forecast, by Country 2019 & 2032
- Table 112: Global Next Generation 3D Display Industry Volume K Unit Forecast, by Country 2019 & 2032
- Table 113: Global Next Generation 3D Display Industry Revenue Million Forecast, by Product 2019 & 2032
- Table 114: Global Next Generation 3D Display Industry Volume K Unit Forecast, by Product 2019 & 2032
- Table 115: Global Next Generation 3D Display Industry Revenue Million Forecast, by Technology 2019 & 2032
- Table 116: Global Next Generation 3D Display Industry Volume K Unit Forecast, by Technology 2019 & 2032
- Table 117: Global Next Generation 3D Display Industry Revenue Million Forecast, by Access Method 2019 & 2032
- Table 118: Global Next Generation 3D Display Industry Volume K Unit Forecast, by Access Method 2019 & 2032
- Table 119: Global Next Generation 3D Display Industry Revenue Million Forecast, by End User Industry 2019 & 2032
- Table 120: Global Next Generation 3D Display Industry Volume K Unit Forecast, by End User Industry 2019 & 2032
- Table 121: Global Next Generation 3D Display Industry Revenue Million Forecast, by Country 2019 & 2032
- Table 122: Global Next Generation 3D Display Industry Volume K Unit Forecast, by Country 2019 & 2032
- Table 123: Global Next Generation 3D Display Industry Revenue Million Forecast, by Product 2019 & 2032
- Table 124: Global Next Generation 3D Display Industry Volume K Unit Forecast, by Product 2019 & 2032
- Table 125: Global Next Generation 3D Display Industry Revenue Million Forecast, by Technology 2019 & 2032
- Table 126: Global Next Generation 3D Display Industry Volume K Unit Forecast, by Technology 2019 & 2032
- Table 127: Global Next Generation 3D Display Industry Revenue Million Forecast, by Access Method 2019 & 2032
- Table 128: Global Next Generation 3D Display Industry Volume K Unit Forecast, by Access Method 2019 & 2032
- Table 129: Global Next Generation 3D Display Industry Revenue Million Forecast, by End User Industry 2019 & 2032
- Table 130: Global Next Generation 3D Display Industry Volume K Unit Forecast, by End User Industry 2019 & 2032
- Table 131: Global Next Generation 3D Display Industry Revenue Million Forecast, by Country 2019 & 2032
- Table 132: Global Next Generation 3D Display Industry Volume K Unit Forecast, by Country 2019 & 2032
- Table 133: Global Next Generation 3D Display Industry Revenue Million Forecast, by Product 2019 & 2032
- Table 134: Global Next Generation 3D Display Industry Volume K Unit Forecast, by Product 2019 & 2032
- Table 135: Global Next Generation 3D Display Industry Revenue Million Forecast, by Technology 2019 & 2032
- Table 136: Global Next Generation 3D Display Industry Volume K Unit Forecast, by Technology 2019 & 2032
- Table 137: Global Next Generation 3D Display Industry Revenue Million Forecast, by Access Method 2019 & 2032
- Table 138: Global Next Generation 3D Display Industry Volume K Unit Forecast, by Access Method 2019 & 2032
- Table 139: Global Next Generation 3D Display Industry Revenue Million Forecast, by End User Industry 2019 & 2032
- Table 140: Global Next Generation 3D Display Industry Volume K Unit Forecast, by End User Industry 2019 & 2032
- Table 141: Global Next Generation 3D Display Industry Revenue Million Forecast, by Country 2019 & 2032
- Table 142: Global Next Generation 3D Display Industry Volume K Unit Forecast, by Country 2019 & 2032
- Table 143: Global Next Generation 3D Display Industry Revenue Million Forecast, by Product 2019 & 2032
- Table 144: Global Next Generation 3D Display Industry Volume K Unit Forecast, by Product 2019 & 2032
- Table 145: Global Next Generation 3D Display Industry Revenue Million Forecast, by Technology 2019 & 2032
- Table 146: Global Next Generation 3D Display Industry Volume K Unit Forecast, by Technology 2019 & 2032
- Table 147: Global Next Generation 3D Display Industry Revenue Million Forecast, by Access Method 2019 & 2032
- Table 148: Global Next Generation 3D Display Industry Volume K Unit Forecast, by Access Method 2019 & 2032
- Table 149: Global Next Generation 3D Display Industry Revenue Million Forecast, by End User Industry 2019 & 2032
- Table 150: Global Next Generation 3D Display Industry Volume K Unit Forecast, by End User Industry 2019 & 2032
- Table 151: Global Next Generation 3D Display Industry Revenue Million Forecast, by Country 2019 & 2032
- Table 152: Global Next Generation 3D Display Industry Volume K Unit Forecast, by Country 2019 & 2032
- Table 153: Global Next Generation 3D Display Industry Revenue Million Forecast, by Product 2019 & 2032
- Table 154: Global Next Generation 3D Display Industry Volume K Unit Forecast, by Product 2019 & 2032
- Table 155: Global Next Generation 3D Display Industry Revenue Million Forecast, by Technology 2019 & 2032
- Table 156: Global Next Generation 3D Display Industry Volume K Unit Forecast, by Technology 2019 & 2032
- Table 157: Global Next Generation 3D Display Industry Revenue Million Forecast, by Access Method 2019 & 2032
- Table 158: Global Next Generation 3D Display Industry Volume K Unit Forecast, by Access Method 2019 & 2032
- Table 159: Global Next Generation 3D Display Industry Revenue Million Forecast, by End User Industry 2019 & 2032
- Table 160: Global Next Generation 3D Display Industry Volume K Unit Forecast, by End User Industry 2019 & 2032
- Table 161: Global Next Generation 3D Display Industry Revenue Million Forecast, by Country 2019 & 2032
- Table 162: Global Next Generation 3D Display Industry Volume K Unit Forecast, by Country 2019 & 2032
Frequently Asked Questions
1. What is the projected Compound Annual Growth Rate (CAGR) of the Next Generation 3D Display Industry?
The projected CAGR is approximately 16.50%.
2. Which companies are prominent players in the Next Generation 3D Display Industry?
Key companies in the market include Nvidia, Creal 3D, Samsung Electronics, SHARP Corporation, Panasonic Corporation, Google, Continental AG, Avegant Corp, Robert Bosch GmbH, Fovi 3D, Coretronic Corporation, Avalon Holographics Inc, LG Electronics, AU Optronics Corp.
3. What are the main segments of the Next Generation 3D Display Industry?
The market segments include Product, Technology, Access Method, End User Industry.
4. Can you provide details about the market size?
The market size is estimated to be USD XX Million as of 2022.
5. What are some drivers contributing to market growth?
Increasing Growth of Automotive and Consumer Electronics Market; Rising Adoption of Digital Photo Frames and Head-mount Displays.
6. What are the notable trends driving market growth?
Consumer Electronics to Provide Growth Opportunities.
7. Are there any restraints impacting market growth?
Lack of 3D Content Development; Cost-Intensive 3D Displays.
8. Can you provide examples of recent developments in the market?
April 2023- Metavista 3D, a leading research and development company specializing in pseudo holographic display technologies, announced to introduce its groundbreaking AI-enhanced 3D display. These displays are compatible with all content formats and display technologies that are already in place, e.g. 2K, 4k, 8 k, L LCD or OLED. Display technology is also able to adapt to various applications, e.g. metaverse immersion and gaming, video conferencing or a Digital Mirror of an automobile.
9. What pricing options are available for accessing the report?
Pricing options include single-user, multi-user, and enterprise licenses priced at USD 4750, USD 5250, and USD 8750 respectively.
10. Is the market size provided in terms of value or volume?
The market size is provided in terms of value, measured in Million and volume, measured in K Unit.
11. Are there any specific market keywords associated with the report?
Yes, the market keyword associated with the report is "Next Generation 3D Display Industry," which aids in identifying and referencing the specific market segment covered.
12. How do I determine which pricing option suits my needs best?
The pricing options vary based on user requirements and access needs. Individual users may opt for single-user licenses, while businesses requiring broader access may choose multi-user or enterprise licenses for cost-effective access to the report.
13. Are there any additional resources or data provided in the Next Generation 3D Display Industry report?
While the report offers comprehensive insights, it's advisable to review the specific contents or supplementary materials provided to ascertain if additional resources or data are available.
14. How can I stay updated on further developments or reports in the Next Generation 3D Display Industry?
To stay informed about further developments, trends, and reports in the Next Generation 3D Display Industry, consider subscribing to industry newsletters, following relevant companies and organizations, or regularly checking reputable industry news sources and publications.
Methodology
Step 1 - Identification of Relevant Samples Size from Population Database


Step 2 - Approaches for Defining Global Market Size (Value, Volume* & Price*)

Note*: In applicable scenarios
Step 3 - Data Sources
Primary Research
- Web Analytics
- Survey Reports
- Research Institute
- Latest Research Reports
- Opinion Leaders
Secondary Research
- Annual Reports
- White Paper
- Latest Press Release
- Industry Association
- Paid Database
- Investor Presentations

Step 4 - Data Triangulation
Involves using different sources of information in order to increase the validity of a study
These sources are likely to be stakeholders in a program - participants, other researchers, program staff, other community members, and so on.
Then we put all data in single framework & apply various statistical tools to find out the dynamic on the market.
During the analysis stage, feedback from the stakeholder groups would be compared to determine areas of agreement as well as areas of divergence
