

Key Insights
The global Negative Dry Film Photoresist market is poised for significant expansion, driven by the burgeoning demand from the electronics industry, particularly in the fabrication of Printed Circuit Boards (PCBs) and semiconductor packaging. With an estimated market size of $1.5 billion in 2024, the industry is projected to witness a robust Compound Annual Growth Rate (CAGR) of 8.1% through 2033. This substantial growth is underpinned by the increasing complexity and miniaturization of electronic devices, which necessitates advanced photoresist technologies for precise pattern transfer. The expansion of the semiconductor industry, fueled by the relentless demand for high-performance chips in consumer electronics, automotive, and telecommunications, serves as a primary catalyst. Furthermore, the growing adoption of advanced packaging techniques, such as System-in-Package (SiP) and 3D packaging, which require highly accurate photolithography, will further propel market growth. Emerging applications in flexible electronics and advanced displays are also expected to contribute to this upward trajectory.
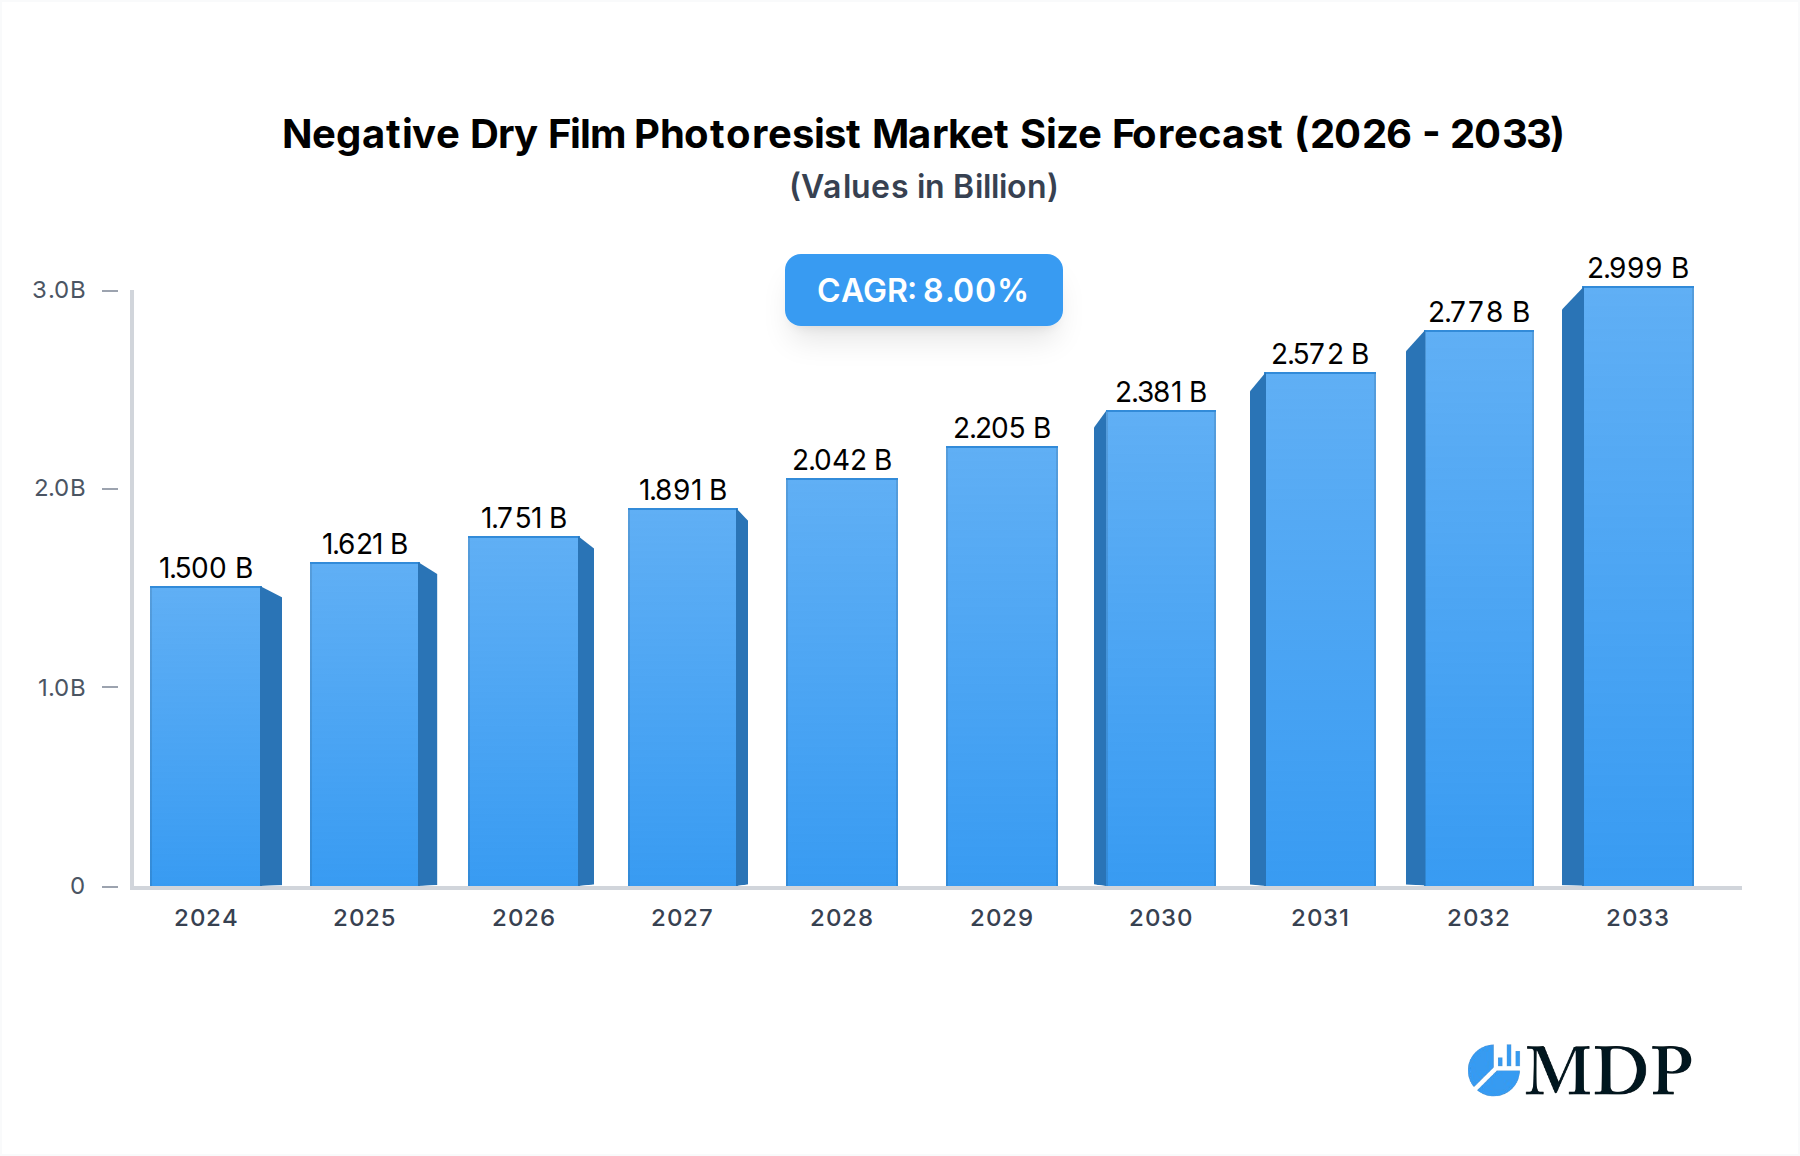
Negative Dry Film Photoresist Market Size (In Billion)
The market's growth is further shaped by key trends and the strategic initiatives of leading companies like DuPont, Dow, FUJIFILM, and Chang Chun Group. Innovations in negative stripping resistance and negative etching resistance photoresists are continuously enhancing resolution, sensitivity, and process efficiency, catering to the evolving needs of microelectronics manufacturing. While the market presents a promising outlook, certain restraints such as the high cost of advanced materials and the stringent environmental regulations associated with photoresist production and disposal could pose challenges. However, ongoing research and development efforts focused on developing eco-friendly and cost-effective solutions are expected to mitigate these concerns. Geographically, the Asia Pacific region, led by China, Japan, and South Korea, is anticipated to dominate the market due to its established electronics manufacturing ecosystem and significant investments in semiconductor production. North America and Europe are also expected to show steady growth, driven by technological advancements and the reshoring of manufacturing capabilities.

Negative Dry Film Photoresist Company Market Share
Unlocking the Future: A Comprehensive Report on the Negative Dry Film Photoresist Market (2019-2033)
This in-depth report provides a definitive analysis of the global Negative Dry Film Photoresist market, offering strategic insights for industry stakeholders. Spanning the study period from 2019 to 2033, with a base and estimated year of 2025 and a forecast period from 2025 to 2033, this analysis meticulously dissects market dynamics, trends, key players, and future opportunities. Our research leverages high-traffic keywords to ensure maximum search visibility for vital information on printed circuit boards (PCBs), semiconductor packaging, and advanced material applications. Discover market-driving innovations, regulatory landscapes, and competitive strategies that are shaping this critical sector of the electronics manufacturing ecosystem.
Negative Dry Film Photoresist Market Dynamics & Concentration
The global Negative Dry Film Photoresist market exhibits a moderate to high concentration, with leading players like DuPont, Dow, FUJIFILM, Chang Chun Group, Asahi Kasei, and AZ Electronic Materials holding significant market shares, estimated in the billions of dollars. Innovation is a primary driver, fueled by the relentless demand for smaller, more powerful, and energy-efficient electronic devices. Continuous advancements in photolithography technology, particularly for high-density interconnect (HDI) PCBs and advanced semiconductor packaging, necessitate improved photoresist performance, including higher resolution, better stripping resistance, and enhanced etching resistance. Regulatory frameworks, while generally supportive of technological progress, can introduce compliance costs related to environmental standards and material safety, impacting production processes and R&D investments. Product substitutes, such as liquid photoresists, exist but often fall short in terms of process simplicity and defect reduction for certain high-volume applications, thus reinforcing the dominance of dry film photoresists. End-user trends are strongly dictated by the burgeoning demand from the smartphone, automotive, and artificial intelligence (AI) sectors, all of which rely heavily on sophisticated PCB and semiconductor manufacturing. Mergers and acquisitions (M&A) activities, while not at an unprecedented peak, remain a strategic tool for key players to consolidate market share, acquire new technologies, and expand geographical reach. Estimated M&A deal counts are expected to be in the range of xx billion in the coming years, underscoring the strategic importance of consolidation.
Negative Dry Film Photoresist Industry Trends & Analysis
The Negative Dry Film Photoresist industry is poised for robust growth, driven by an ever-increasing demand for sophisticated electronic components across a multitude of applications. The market is experiencing a significant Compound Annual Growth Rate (CAGR) of approximately xx%, reflecting strong underlying economic and technological momentum. This growth is primarily propelled by the indispensable role of photoresists in the fabrication of printed circuit boards (PCBs) and the increasingly complex architectures in semiconductor packaging. As electronic devices shrink and their functionalities expand, the need for high-resolution patterning and precise circuitry becomes paramount. Negative dry film photoresists, with their inherent advantages in ease of handling, reduced waste, and superior adhesion on various substrates, are perfectly positioned to meet these evolving demands. Technological disruptions are a constant feature of this industry, with ongoing research and development focused on enhancing resolution capabilities to support the transition to sub-micron feature sizes in semiconductor manufacturing. Furthermore, innovations are targeting improved environmental profiles, with a growing emphasis on developing photoresists with reduced volatile organic compound (VOC) emissions and enhanced recyclability. Consumer preferences are indirectly shaping the market through their insatiable appetite for advanced electronic gadgets, from high-performance smartphones and wearable devices to sophisticated automotive electronics and cutting-edge virtual reality (VR) and augmented reality (AR) hardware. These end-user demands translate directly into higher volumes and more stringent quality requirements for PCB and semiconductor manufacturers, who in turn rely on superior photoresist materials. The competitive dynamics within the Negative Dry Film Photoresist sector are characterized by intense R&D investment, strategic partnerships between material suppliers and electronics manufacturers, and a continuous drive for cost optimization. Market penetration is steadily increasing as the adoption of advanced manufacturing techniques becomes more widespread globally, particularly in emerging economies. The market size is projected to reach several hundred billion dollars by the end of the forecast period, a testament to its critical importance in the modern technological landscape.
Leading Markets & Segments in Negative Dry Film Photoresist
The Printed Circuit Board (PCB) segment dominates the global Negative Dry Film Photoresist market, with an estimated market share exceeding xx billion. This dominance is primarily driven by the sheer volume of PCBs manufactured annually for a vast array of electronic devices, ranging from consumer electronics and telecommunications equipment to industrial automation and automotive systems. The increasing complexity of PCBs, including the widespread adoption of High-Density Interconnect (HDI) technology and multi-layer boards, necessitates the use of high-performance dry film photoresists capable of achieving fine line and space resolutions. Economic policies in key manufacturing hubs, such as East Asia, continue to foster significant growth in PCB production through favorable investment incentives and established supply chains. Infrastructure development, including the expansion of industrial parks and logistics networks, further supports the high throughput required for PCB fabrication.
Within the Application segment, the Semiconductor Packaging application is emerging as a significant growth driver, projected to reach xx billion by 2033. The miniaturization and increasing functionality of semiconductor devices are driving the demand for advanced packaging solutions, such as wafer-level packaging and 3D packaging. Negative dry film photoresists are crucial for creating the intricate interconnects and fine features required in these advanced packaging technologies. Technological advancements in wafer-level processing and the development of new semiconductor materials are directly influencing the demand for specialized photoresists with enhanced adhesion and resolution properties.
In terms of Types, Negative Stripping Resistance photoresists command a substantial market share, estimated at xx billion. This is attributed to their ability to withstand aggressive stripping processes during PCB manufacturing, minimizing the risk of damage to delicate circuitry and ensuring high yields. The demand for robust and reliable stripping processes is amplified by the increasing density and complexity of modern PCBs. Negative Etching Resistance photoresists also play a crucial role, particularly in applications where precise and high-fidelity etching is required for creating intricate circuit patterns. Their ability to maintain pattern integrity during the etching process makes them indispensable for high-end electronics.
Geographically, Asia-Pacific continues to be the leading market for Negative Dry Film Photoresists, with an estimated market size of xx billion. This is primarily due to the region's position as a global manufacturing hub for electronics, particularly in countries like China, South Korea, Taiwan, and Japan. The concentration of major PCB manufacturers and semiconductor fabrication plants in this region fuels the consistent demand for photoresist materials.
Negative Dry Film Photoresist Product Developments
Recent product developments in Negative Dry Film Photoresists are focused on enhancing resolution, improving stripping and etching resistance, and increasing process latitude for finer feature fabrication. Innovations include the development of photoresists with higher photosensitivity, enabling faster exposure times and increased throughput in manufacturing. Advanced formulations are also addressing environmental concerns by offering lower VOC content and improved reworkability. These developments are crucial for meeting the stringent demands of next-generation PCBs and semiconductor packaging, offering competitive advantages through increased yield, reduced defects, and enhanced performance in advanced electronic devices.
Key Drivers of Negative Dry Film Photoresist Growth
The growth of the Negative Dry Film Photoresist market is propelled by several key factors. Technologically, the continuous miniaturization of electronic components and the increasing complexity of integrated circuits necessitate photoresists with higher resolution capabilities to define finer patterns. Economically, the booming demand for advanced electronics in sectors like 5G, artificial intelligence, automotive, and IoT drives substantial investment in PCB and semiconductor manufacturing, directly increasing the consumption of photoresists. Regulatory factors, while sometimes posing challenges, also drive innovation towards more environmentally friendly and sustainable photoresist formulations.
Challenges in the Negative Dry Film Photoresist Market
Despite its robust growth, the Negative Dry Film Photoresist market faces several challenges. Regulatory hurdles, particularly those concerning environmental compliance and the use of certain chemicals, can increase production costs and necessitate costly reformulation efforts. Supply chain disruptions, as witnessed in recent global events, can impact the availability and pricing of raw materials, leading to production delays and increased operational expenses. Intense competitive pressures among established players and the emergence of new entrants can also lead to price erosion and pressure on profit margins, necessitating continuous innovation and cost optimization strategies to maintain market position.
Emerging Opportunities in Negative Dry Film Photoresist
Emerging opportunities in the Negative Dry Film Photoresist market are largely driven by technological breakthroughs and expanding application areas. The continued advancements in semiconductor technology, such as the push for smaller process nodes and advanced 3D integration, present significant opportunities for photoresist manufacturers to develop ultra-high-resolution materials. Strategic partnerships between photoresist suppliers and leading electronics manufacturers are crucial for co-developing customized solutions tailored to specific device requirements. Furthermore, market expansion into burgeoning sectors like electric vehicles (EVs) and advanced medical devices, which rely on sophisticated electronics, offers substantial growth potential.
Leading Players in the Negative Dry Film Photoresist Sector
- DuPont
- Dow
- FUJIFILM
- Chang Chun Group
- Asahi Kasei
- AZ Electronic Materials
Key Milestones in Negative Dry Film Photoresist Industry
- 2019: Introduction of new high-resolution negative dry film photoresists for advanced PCB applications.
- 2020: Increased focus on developing eco-friendly photoresist formulations with reduced VOCs.
- 2021: Significant investments in R&D by key players to address the needs of advanced semiconductor packaging.
- 2022: Emergence of new specialized photoresists for flexible PCB manufacturing.
- 2023: Enhanced focus on supply chain resilience and regional manufacturing capabilities.
Strategic Outlook for Negative Dry Film Photoresist Market
The strategic outlook for the Negative Dry Film Photoresist market remains highly positive, driven by an insatiable demand for increasingly sophisticated electronic devices. Future market potential lies in the continuous innovation of high-resolution and environmentally sustainable photoresist solutions to support advancements in semiconductor technology, 5G infrastructure, AI-driven computing, and the rapidly expanding automotive electronics sector. Strategic opportunities include forging deeper collaborations with end-users for bespoke material development, expanding manufacturing capacities in high-growth regions, and investing in advanced research to anticipate future technological requirements.
Negative Dry Film Photoresist Segmentation
-
1. Application
- 1.1. Printed Circuit Board
- 1.2. Semiconductor Packaging
- 1.3. Other
-
2. Types
- 2.1. Negative Stripping Resistance
- 2.2. Negative Etching Resistance
Negative Dry Film Photoresist Segmentation By Geography
-
1. North America
- 1.1. United States
- 1.2. Canada
- 1.3. Mexico
-
2. South America
- 2.1. Brazil
- 2.2. Argentina
- 2.3. Rest of South America
-
3. Europe
- 3.1. United Kingdom
- 3.2. Germany
- 3.3. France
- 3.4. Italy
- 3.5. Spain
- 3.6. Russia
- 3.7. Benelux
- 3.8. Nordics
- 3.9. Rest of Europe
-
4. Middle East & Africa
- 4.1. Turkey
- 4.2. Israel
- 4.3. GCC
- 4.4. North Africa
- 4.5. South Africa
- 4.6. Rest of Middle East & Africa
-
5. Asia Pacific
- 5.1. China
- 5.2. India
- 5.3. Japan
- 5.4. South Korea
- 5.5. ASEAN
- 5.6. Oceania
- 5.7. Rest of Asia Pacific
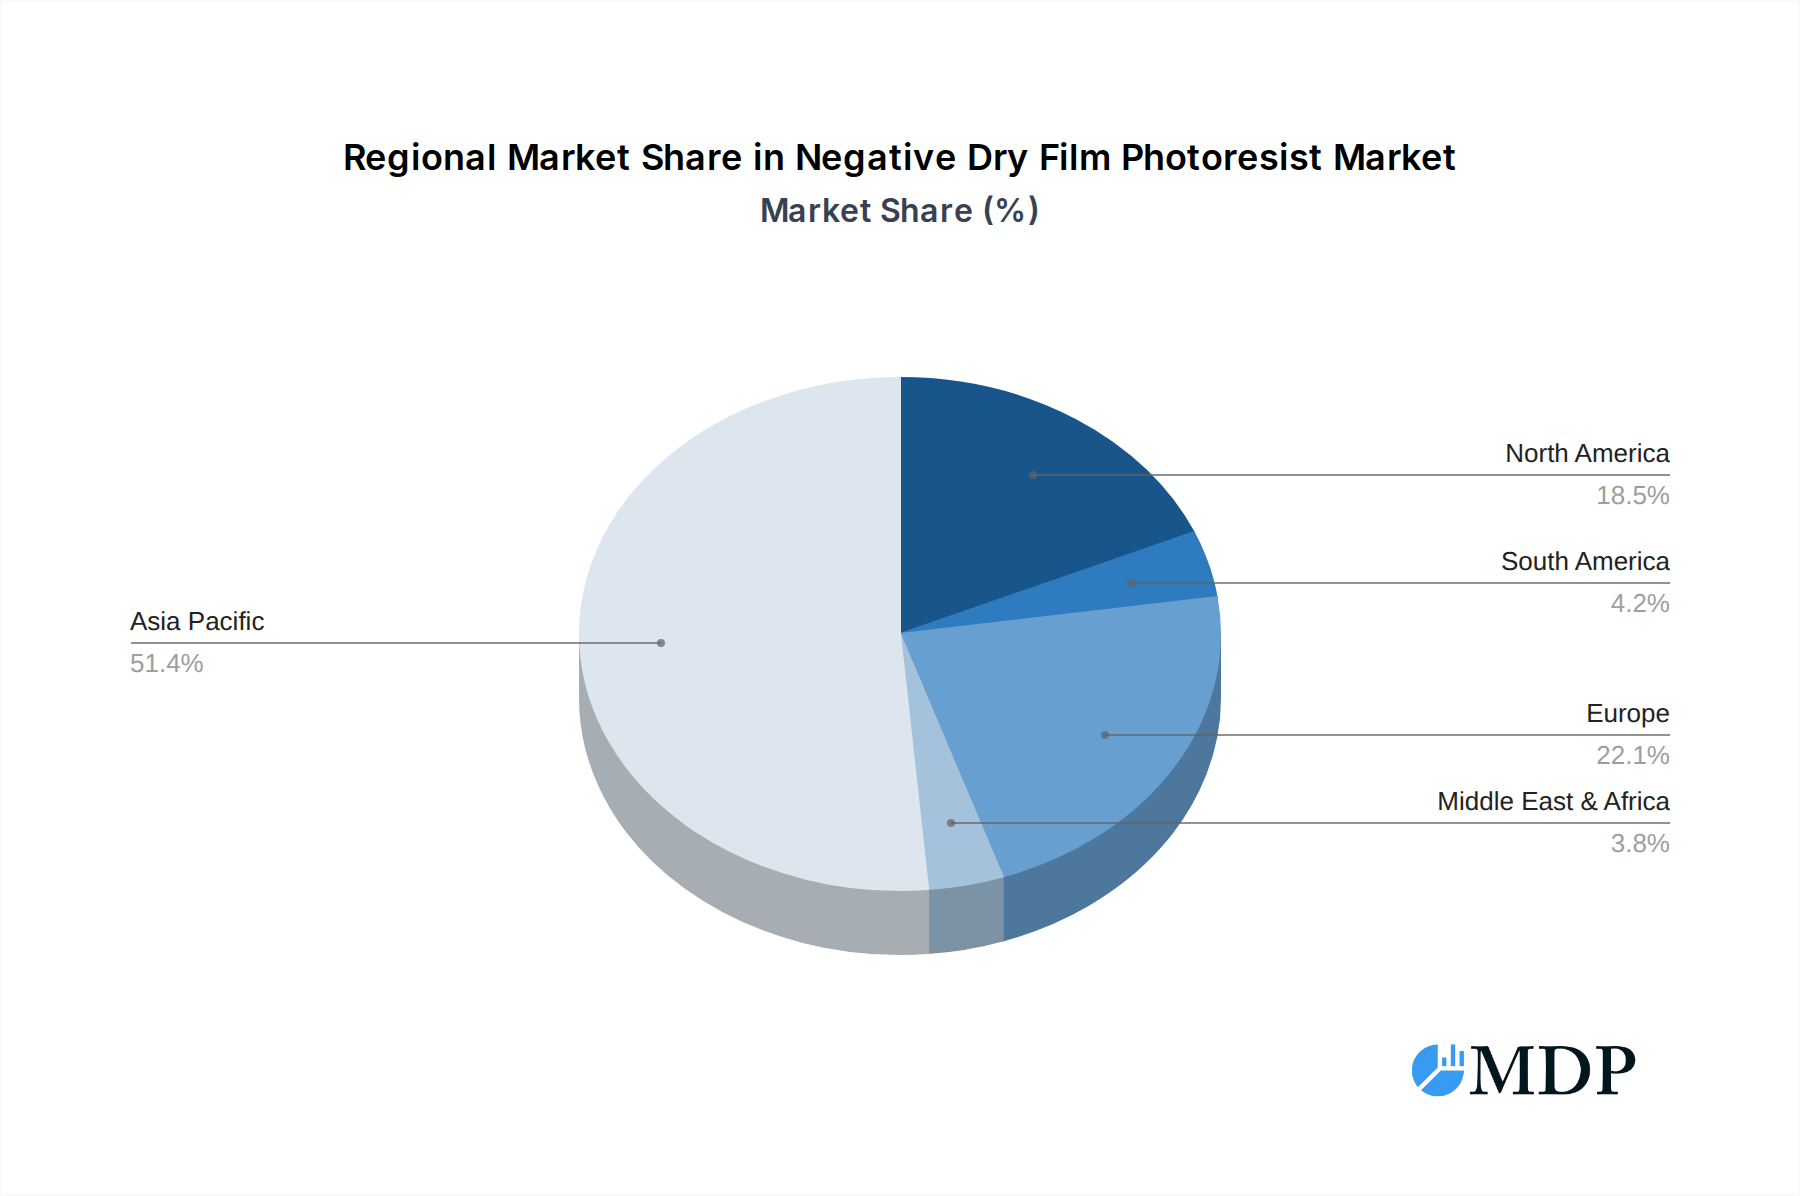
Negative Dry Film Photoresist Regional Market Share
Geographic Coverage of Negative Dry Film Photoresist
Negative Dry Film Photoresist REPORT HIGHLIGHTS
| Aspects | Details |
|---|---|
| Study Period | 2020-2034 |
| Base Year | 2025 |
| Estimated Year | 2026 |
| Forecast Period | 2026-2034 |
| Historical Period | 2020-2025 |
| Growth Rate | CAGR of 8.1% from 2020-2034 |
| Segmentation |
|
Table of Contents
- 1. Introduction
- 1.1. Research Scope
- 1.2. Market Segmentation
- 1.3. Research Objective
- 1.4. Definitions and Assumptions
- 2. Executive Summary
- 2.1. Market Snapshot
- 3. Market Dynamics
- 3.1. Market Drivers
- 3.2. Market Restrains
- 3.3. Market Trends
- 3.4. Market Opportunities
- 4. Market Factor Analysis
- 4.1. Porters Five Forces
- 4.1.1. Bargaining Power of Suppliers
- 4.1.2. Bargaining Power of Buyers
- 4.1.3. Threat of New Entrants
- 4.1.4. Threat of Substitutes
- 4.1.5. Competitive Rivalry
- 4.2. PESTEL analysis
- 4.3. BCG Analysis
- 4.3.1. Stars (High Growth, High Market Share)
- 4.3.2. Cash Cows (Low Growth, High Market Share)
- 4.3.3. Question Mark (High Growth, Low Market Share)
- 4.3.4. Dogs (Low Growth, Low Market Share)
- 4.4. Ansoff Matrix Analysis
- 4.5. Supply Chain Analysis
- 4.6. Regulatory Landscape
- 4.7. Current Market Potential and Opportunity Assessment (TAM–SAM–SOM Framework)
- 4.8. MDP Analyst Note
- 4.1. Porters Five Forces
- 5. Market Analysis, Insights and Forecast 2021-2033
- 5.1. Market Analysis, Insights and Forecast - by Application
- 5.1.1. Printed Circuit Board
- 5.1.2. Semiconductor Packaging
- 5.1.3. Other
- 5.2. Market Analysis, Insights and Forecast - by Types
- 5.2.1. Negative Stripping Resistance
- 5.2.2. Negative Etching Resistance
- 5.3. Market Analysis, Insights and Forecast - by Region
- 5.3.1. North America
- 5.3.2. South America
- 5.3.3. Europe
- 5.3.4. Middle East & Africa
- 5.3.5. Asia Pacific
- 5.1. Market Analysis, Insights and Forecast - by Application
- 6. Global Negative Dry Film Photoresist Analysis, Insights and Forecast, 2021-2033
- 6.1. Market Analysis, Insights and Forecast - by Application
- 6.1.1. Printed Circuit Board
- 6.1.2. Semiconductor Packaging
- 6.1.3. Other
- 6.2. Market Analysis, Insights and Forecast - by Types
- 6.2.1. Negative Stripping Resistance
- 6.2.2. Negative Etching Resistance
- 6.1. Market Analysis, Insights and Forecast - by Application
- 7. North America Negative Dry Film Photoresist Analysis, Insights and Forecast, 2020-2032
- 7.1. Market Analysis, Insights and Forecast - by Application
- 7.1.1. Printed Circuit Board
- 7.1.2. Semiconductor Packaging
- 7.1.3. Other
- 7.2. Market Analysis, Insights and Forecast - by Types
- 7.2.1. Negative Stripping Resistance
- 7.2.2. Negative Etching Resistance
- 7.1. Market Analysis, Insights and Forecast - by Application
- 8. South America Negative Dry Film Photoresist Analysis, Insights and Forecast, 2020-2032
- 8.1. Market Analysis, Insights and Forecast - by Application
- 8.1.1. Printed Circuit Board
- 8.1.2. Semiconductor Packaging
- 8.1.3. Other
- 8.2. Market Analysis, Insights and Forecast - by Types
- 8.2.1. Negative Stripping Resistance
- 8.2.2. Negative Etching Resistance
- 8.1. Market Analysis, Insights and Forecast - by Application
- 9. Europe Negative Dry Film Photoresist Analysis, Insights and Forecast, 2020-2032
- 9.1. Market Analysis, Insights and Forecast - by Application
- 9.1.1. Printed Circuit Board
- 9.1.2. Semiconductor Packaging
- 9.1.3. Other
- 9.2. Market Analysis, Insights and Forecast - by Types
- 9.2.1. Negative Stripping Resistance
- 9.2.2. Negative Etching Resistance
- 9.1. Market Analysis, Insights and Forecast - by Application
- 10. Middle East & Africa Negative Dry Film Photoresist Analysis, Insights and Forecast, 2020-2032
- 10.1. Market Analysis, Insights and Forecast - by Application
- 10.1.1. Printed Circuit Board
- 10.1.2. Semiconductor Packaging
- 10.1.3. Other
- 10.2. Market Analysis, Insights and Forecast - by Types
- 10.2.1. Negative Stripping Resistance
- 10.2.2. Negative Etching Resistance
- 10.1. Market Analysis, Insights and Forecast - by Application
- 11. Asia Pacific Negative Dry Film Photoresist Analysis, Insights and Forecast, 2020-2032
- 11.1. Market Analysis, Insights and Forecast - by Application
- 11.1.1. Printed Circuit Board
- 11.1.2. Semiconductor Packaging
- 11.1.3. Other
- 11.2. Market Analysis, Insights and Forecast - by Types
- 11.2.1. Negative Stripping Resistance
- 11.2.2. Negative Etching Resistance
- 11.1. Market Analysis, Insights and Forecast - by Application
- 12. Competitive Analysis
- 12.1. Company Profiles
- 12.1.1 DuPont
- 12.1.1.1. Company Overview
- 12.1.1.2. Products
- 12.1.1.3. Company Financials
- 12.1.1.4. SWOT Analysis
- 12.1.2 Dow
- 12.1.2.1. Company Overview
- 12.1.2.2. Products
- 12.1.2.3. Company Financials
- 12.1.2.4. SWOT Analysis
- 12.1.3 FUJIFILM
- 12.1.3.1. Company Overview
- 12.1.3.2. Products
- 12.1.3.3. Company Financials
- 12.1.3.4. SWOT Analysis
- 12.1.4 Chang Chun Group
- 12.1.4.1. Company Overview
- 12.1.4.2. Products
- 12.1.4.3. Company Financials
- 12.1.4.4. SWOT Analysis
- 12.1.5 Asahi Kasei
- 12.1.5.1. Company Overview
- 12.1.5.2. Products
- 12.1.5.3. Company Financials
- 12.1.5.4. SWOT Analysis
- 12.1.6 AZ Electronic Materials
- 12.1.6.1. Company Overview
- 12.1.6.2. Products
- 12.1.6.3. Company Financials
- 12.1.6.4. SWOT Analysis
- 12.1.1 DuPont
- 12.2. Market Entropy
- 12.2.1 Company's Key Areas Served
- 12.2.2 Recent Developments
- 12.3. Company Market Share Analysis 2025
- 12.3.1 Top 5 Companies Market Share Analysis
- 12.3.2 Top 3 Companies Market Share Analysis
- 12.4. List of Potential Customers
- 13. Research Methodology
List of Figures
- Figure 1: Global Negative Dry Film Photoresist Revenue Breakdown (undefined, %) by Region 2025 & 2033
- Figure 2: North America Negative Dry Film Photoresist Revenue (undefined), by Application 2025 & 2033
- Figure 3: North America Negative Dry Film Photoresist Revenue Share (%), by Application 2025 & 2033
- Figure 4: North America Negative Dry Film Photoresist Revenue (undefined), by Types 2025 & 2033
- Figure 5: North America Negative Dry Film Photoresist Revenue Share (%), by Types 2025 & 2033
- Figure 6: North America Negative Dry Film Photoresist Revenue (undefined), by Country 2025 & 2033
- Figure 7: North America Negative Dry Film Photoresist Revenue Share (%), by Country 2025 & 2033
- Figure 8: South America Negative Dry Film Photoresist Revenue (undefined), by Application 2025 & 2033
- Figure 9: South America Negative Dry Film Photoresist Revenue Share (%), by Application 2025 & 2033
- Figure 10: South America Negative Dry Film Photoresist Revenue (undefined), by Types 2025 & 2033
- Figure 11: South America Negative Dry Film Photoresist Revenue Share (%), by Types 2025 & 2033
- Figure 12: South America Negative Dry Film Photoresist Revenue (undefined), by Country 2025 & 2033
- Figure 13: South America Negative Dry Film Photoresist Revenue Share (%), by Country 2025 & 2033
- Figure 14: Europe Negative Dry Film Photoresist Revenue (undefined), by Application 2025 & 2033
- Figure 15: Europe Negative Dry Film Photoresist Revenue Share (%), by Application 2025 & 2033
- Figure 16: Europe Negative Dry Film Photoresist Revenue (undefined), by Types 2025 & 2033
- Figure 17: Europe Negative Dry Film Photoresist Revenue Share (%), by Types 2025 & 2033
- Figure 18: Europe Negative Dry Film Photoresist Revenue (undefined), by Country 2025 & 2033
- Figure 19: Europe Negative Dry Film Photoresist Revenue Share (%), by Country 2025 & 2033
- Figure 20: Middle East & Africa Negative Dry Film Photoresist Revenue (undefined), by Application 2025 & 2033
- Figure 21: Middle East & Africa Negative Dry Film Photoresist Revenue Share (%), by Application 2025 & 2033
- Figure 22: Middle East & Africa Negative Dry Film Photoresist Revenue (undefined), by Types 2025 & 2033
- Figure 23: Middle East & Africa Negative Dry Film Photoresist Revenue Share (%), by Types 2025 & 2033
- Figure 24: Middle East & Africa Negative Dry Film Photoresist Revenue (undefined), by Country 2025 & 2033
- Figure 25: Middle East & Africa Negative Dry Film Photoresist Revenue Share (%), by Country 2025 & 2033
- Figure 26: Asia Pacific Negative Dry Film Photoresist Revenue (undefined), by Application 2025 & 2033
- Figure 27: Asia Pacific Negative Dry Film Photoresist Revenue Share (%), by Application 2025 & 2033
- Figure 28: Asia Pacific Negative Dry Film Photoresist Revenue (undefined), by Types 2025 & 2033
- Figure 29: Asia Pacific Negative Dry Film Photoresist Revenue Share (%), by Types 2025 & 2033
- Figure 30: Asia Pacific Negative Dry Film Photoresist Revenue (undefined), by Country 2025 & 2033
- Figure 31: Asia Pacific Negative Dry Film Photoresist Revenue Share (%), by Country 2025 & 2033
List of Tables
- Table 1: Global Negative Dry Film Photoresist Revenue undefined Forecast, by Application 2020 & 2033
- Table 2: Global Negative Dry Film Photoresist Revenue undefined Forecast, by Types 2020 & 2033
- Table 3: Global Negative Dry Film Photoresist Revenue undefined Forecast, by Region 2020 & 2033
- Table 4: Global Negative Dry Film Photoresist Revenue undefined Forecast, by Application 2020 & 2033
- Table 5: Global Negative Dry Film Photoresist Revenue undefined Forecast, by Types 2020 & 2033
- Table 6: Global Negative Dry Film Photoresist Revenue undefined Forecast, by Country 2020 & 2033
- Table 7: United States Negative Dry Film Photoresist Revenue (undefined) Forecast, by Application 2020 & 2033
- Table 8: Canada Negative Dry Film Photoresist Revenue (undefined) Forecast, by Application 2020 & 2033
- Table 9: Mexico Negative Dry Film Photoresist Revenue (undefined) Forecast, by Application 2020 & 2033
- Table 10: Global Negative Dry Film Photoresist Revenue undefined Forecast, by Application 2020 & 2033
- Table 11: Global Negative Dry Film Photoresist Revenue undefined Forecast, by Types 2020 & 2033
- Table 12: Global Negative Dry Film Photoresist Revenue undefined Forecast, by Country 2020 & 2033
- Table 13: Brazil Negative Dry Film Photoresist Revenue (undefined) Forecast, by Application 2020 & 2033
- Table 14: Argentina Negative Dry Film Photoresist Revenue (undefined) Forecast, by Application 2020 & 2033
- Table 15: Rest of South America Negative Dry Film Photoresist Revenue (undefined) Forecast, by Application 2020 & 2033
- Table 16: Global Negative Dry Film Photoresist Revenue undefined Forecast, by Application 2020 & 2033
- Table 17: Global Negative Dry Film Photoresist Revenue undefined Forecast, by Types 2020 & 2033
- Table 18: Global Negative Dry Film Photoresist Revenue undefined Forecast, by Country 2020 & 2033
- Table 19: United Kingdom Negative Dry Film Photoresist Revenue (undefined) Forecast, by Application 2020 & 2033
- Table 20: Germany Negative Dry Film Photoresist Revenue (undefined) Forecast, by Application 2020 & 2033
- Table 21: France Negative Dry Film Photoresist Revenue (undefined) Forecast, by Application 2020 & 2033
- Table 22: Italy Negative Dry Film Photoresist Revenue (undefined) Forecast, by Application 2020 & 2033
- Table 23: Spain Negative Dry Film Photoresist Revenue (undefined) Forecast, by Application 2020 & 2033
- Table 24: Russia Negative Dry Film Photoresist Revenue (undefined) Forecast, by Application 2020 & 2033
- Table 25: Benelux Negative Dry Film Photoresist Revenue (undefined) Forecast, by Application 2020 & 2033
- Table 26: Nordics Negative Dry Film Photoresist Revenue (undefined) Forecast, by Application 2020 & 2033
- Table 27: Rest of Europe Negative Dry Film Photoresist Revenue (undefined) Forecast, by Application 2020 & 2033
- Table 28: Global Negative Dry Film Photoresist Revenue undefined Forecast, by Application 2020 & 2033
- Table 29: Global Negative Dry Film Photoresist Revenue undefined Forecast, by Types 2020 & 2033
- Table 30: Global Negative Dry Film Photoresist Revenue undefined Forecast, by Country 2020 & 2033
- Table 31: Turkey Negative Dry Film Photoresist Revenue (undefined) Forecast, by Application 2020 & 2033
- Table 32: Israel Negative Dry Film Photoresist Revenue (undefined) Forecast, by Application 2020 & 2033
- Table 33: GCC Negative Dry Film Photoresist Revenue (undefined) Forecast, by Application 2020 & 2033
- Table 34: North Africa Negative Dry Film Photoresist Revenue (undefined) Forecast, by Application 2020 & 2033
- Table 35: South Africa Negative Dry Film Photoresist Revenue (undefined) Forecast, by Application 2020 & 2033
- Table 36: Rest of Middle East & Africa Negative Dry Film Photoresist Revenue (undefined) Forecast, by Application 2020 & 2033
- Table 37: Global Negative Dry Film Photoresist Revenue undefined Forecast, by Application 2020 & 2033
- Table 38: Global Negative Dry Film Photoresist Revenue undefined Forecast, by Types 2020 & 2033
- Table 39: Global Negative Dry Film Photoresist Revenue undefined Forecast, by Country 2020 & 2033
- Table 40: China Negative Dry Film Photoresist Revenue (undefined) Forecast, by Application 2020 & 2033
- Table 41: India Negative Dry Film Photoresist Revenue (undefined) Forecast, by Application 2020 & 2033
- Table 42: Japan Negative Dry Film Photoresist Revenue (undefined) Forecast, by Application 2020 & 2033
- Table 43: South Korea Negative Dry Film Photoresist Revenue (undefined) Forecast, by Application 2020 & 2033
- Table 44: ASEAN Negative Dry Film Photoresist Revenue (undefined) Forecast, by Application 2020 & 2033
- Table 45: Oceania Negative Dry Film Photoresist Revenue (undefined) Forecast, by Application 2020 & 2033
- Table 46: Rest of Asia Pacific Negative Dry Film Photoresist Revenue (undefined) Forecast, by Application 2020 & 2033
Frequently Asked Questions
1. What is the projected Compound Annual Growth Rate (CAGR) of the Negative Dry Film Photoresist?
The projected CAGR is approximately 8.1%.
2. Which companies are prominent players in the Negative Dry Film Photoresist?
Key companies in the market include DuPont, Dow, FUJIFILM, Chang Chun Group, Asahi Kasei, AZ Electronic Materials.
3. What are the main segments of the Negative Dry Film Photoresist?
The market segments include Application, Types.
4. Can you provide details about the market size?
The market size is estimated to be USD XXX N/A as of 2022.
5. What are some drivers contributing to market growth?
N/A
6. What are the notable trends driving market growth?
N/A
7. Are there any restraints impacting market growth?
N/A
8. Can you provide examples of recent developments in the market?
N/A
9. What pricing options are available for accessing the report?
Pricing options include single-user, multi-user, and enterprise licenses priced at USD 4900.00, USD 7350.00, and USD 9800.00 respectively.
10. Is the market size provided in terms of value or volume?
The market size is provided in terms of value, measured in N/A.
11. Are there any specific market keywords associated with the report?
Yes, the market keyword associated with the report is "Negative Dry Film Photoresist," which aids in identifying and referencing the specific market segment covered.
12. How do I determine which pricing option suits my needs best?
The pricing options vary based on user requirements and access needs. Individual users may opt for single-user licenses, while businesses requiring broader access may choose multi-user or enterprise licenses for cost-effective access to the report.
13. Are there any additional resources or data provided in the Negative Dry Film Photoresist report?
While the report offers comprehensive insights, it's advisable to review the specific contents or supplementary materials provided to ascertain if additional resources or data are available.
14. How can I stay updated on further developments or reports in the Negative Dry Film Photoresist?
To stay informed about further developments, trends, and reports in the Negative Dry Film Photoresist, consider subscribing to industry newsletters, following relevant companies and organizations, or regularly checking reputable industry news sources and publications.
Methodology
Step 1 - Identification of Relevant Samples Size from Population Database


Step 2 - Approaches for Defining Global Market Size (Value, Volume* & Price*)

Note*: In applicable scenarios
Step 3 - Data Sources
Primary Research
- Web Analytics
- Survey Reports
- Research Institute
- Latest Research Reports
- Opinion Leaders
Secondary Research
- Annual Reports
- White Paper
- Latest Press Release
- Industry Association
- Paid Database
- Investor Presentations

Step 4 - Data Triangulation
Involves using different sources of information in order to increase the validity of a study
These sources are likely to be stakeholders in a program - participants, other researchers, program staff, other community members, and so on.
Then we put all data in single framework & apply various statistical tools to find out the dynamic on the market.
During the analysis stage, feedback from the stakeholder groups would be compared to determine areas of agreement as well as areas of divergence