

Key Insights
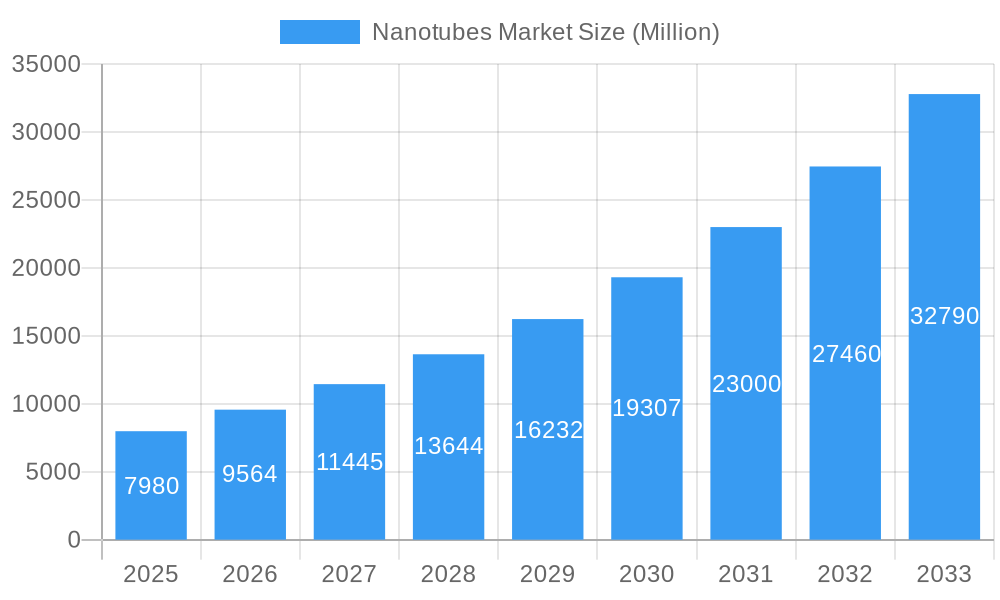
The global nanotubes market, valued at $7.98 billion in 2025, is projected to experience robust growth, driven by a compound annual growth rate (CAGR) of 19.95% from 2025 to 2033. This expansion is fueled by the increasing adoption of nanotubes across diverse sectors, including electronics, energy, healthcare, and automotive. The rising demand for lightweight, high-strength materials in aerospace and defense applications further contributes to market growth. Significant advancements in the synthesis and functionalization of nanotubes are enabling the development of novel applications, such as high-performance batteries, advanced sensors, and efficient water purification filters. The diverse types of nanotubes, including carbon nanotubes, silicon nanotubes, and inorganic nanotubes, each cater to specific application needs, leading to market segmentation based on type, structure, and application. Competition among key players, including Jiangsu Cnano Technology Co Ltd, Nanoshel LLC, and Arkema, drives innovation and market expansion. However, factors such as the high cost of production and potential health and environmental concerns associated with some types of nanotubes may pose challenges to the market's sustained growth. Nonetheless, ongoing research and development efforts aimed at improving production efficiency and addressing safety concerns are expected to mitigate these challenges.
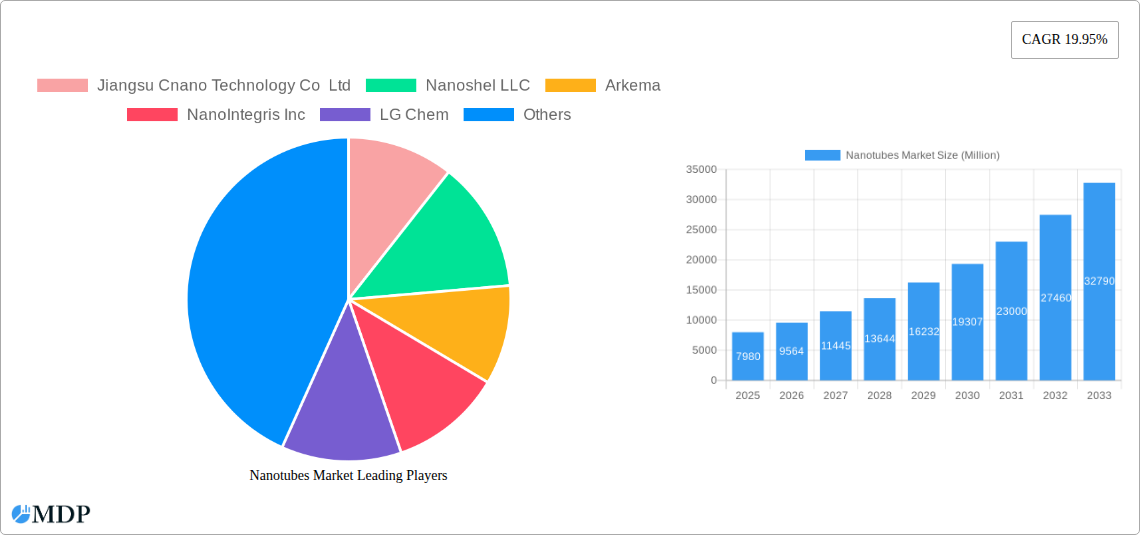
Nanotubes Market Market Size (In Billion)
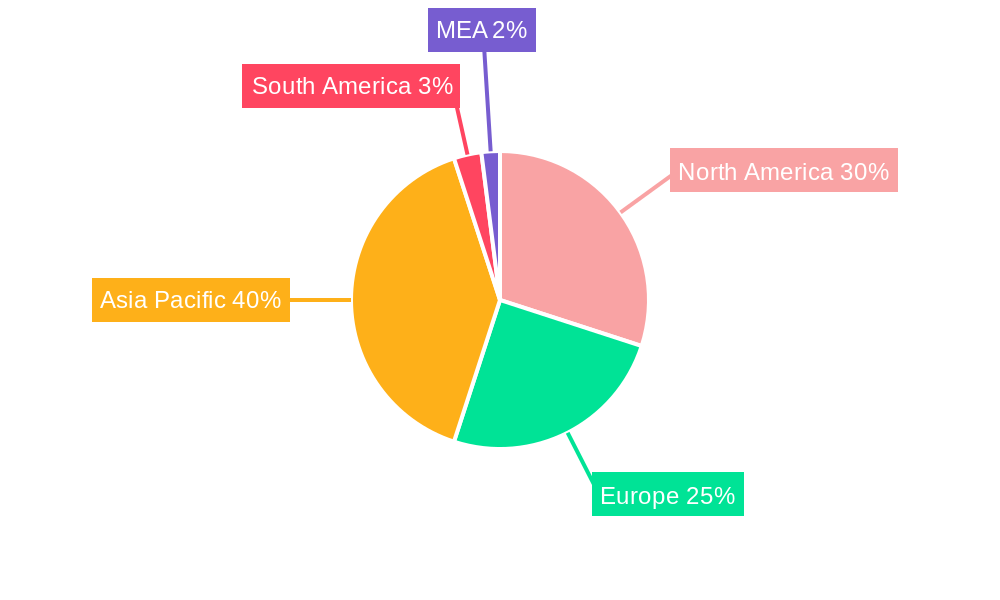
The market's geographical distribution is expected to show significant regional variations, with Asia-Pacific projected to dominate due to its large and rapidly growing electronics and energy sectors. North America and Europe will also experience substantial growth, driven by strong technological advancements and high adoption rates in various end-user industries. The continued expansion of the electric vehicle market is a key driver, boosting demand for high-performance battery materials. The healthcare sector's increasing use of nanotubes in drug delivery systems and biosensors is also a significant contributor. This dynamic interplay of technological innovation, evolving application demands, and robust regional growth will shape the future trajectory of the nanotubes market, ensuring its continued expansion in the coming years. Further market analysis suggests that specific application segments, such as Li-ion batteries and biosensors, will witness particularly rapid growth, exceeding the overall market CAGR.
Nanotubes Market Company Market Share
Nanotubes Market: A Comprehensive Report (2019-2033)
This comprehensive report provides an in-depth analysis of the global nanotubes market, encompassing market dynamics, industry trends, leading segments, key players, and future growth prospects. With a study period spanning 2019-2033, a base year of 2025, and a forecast period of 2025-2033, this report offers invaluable insights for industry stakeholders, investors, and researchers. The market is projected to reach xx Million by 2033, exhibiting a robust CAGR of xx% during the forecast period.
Nanotubes Market Market Dynamics & Concentration
The nanotubes market is characterized by moderate concentration, with several key players dominating specific segments. Market share is largely influenced by technological advancements, production capacity, and strategic partnerships. Innovation in synthesis techniques, particularly for carbon nanotubes (CNTs), is a key driver, alongside growing demand from the electronics and energy sectors. Stringent regulations regarding the safe handling and disposal of nanotubes are impacting market growth, but also incentivizing the development of sustainable production methods. The presence of substitute materials, such as graphene, presents a competitive challenge. However, nanotubes' unique properties, such as high strength-to-weight ratio and excellent electrical conductivity, ensure ongoing demand. M&A activity is steadily increasing, with recent examples highlighting the growing strategic importance of the sector. For instance, the number of M&A deals in the last five years has increased by xx%, indicating a trend of consolidation and expansion within the market.
- Market Concentration: Moderately concentrated, with top 5 players holding xx% of market share in 2024.
- Innovation Drivers: Advancements in synthesis methods, functionalization techniques, and application-specific designs.
- Regulatory Framework: Growing emphasis on safety and environmental regulations impacting production and disposal.
- Product Substitutes: Graphene and other advanced materials pose a competitive challenge.
- End-User Trends: Increasing adoption in electronics, energy storage, and healthcare sectors.
- M&A Activity: xx M&A deals recorded in the past five years, indicating consolidation and expansion.
Nanotubes Market Industry Trends & Analysis
The nanotubes market is experiencing significant growth driven by the increasing demand for lightweight yet high-strength materials across diverse sectors. Technological advancements, particularly in scalable and cost-effective production methods, are accelerating market penetration. Consumer preference for sustainable and high-performance products is further fueling demand. The competitive landscape is dynamic, with both established players and new entrants vying for market share through product innovation and strategic partnerships. Market growth is particularly strong in the electronics sector, driven by the increasing demand for smaller, faster, and more efficient electronic devices. The adoption of nanotubes in energy storage applications, especially lithium-ion batteries, is also a significant driver of growth, with the market expected to reach xx Million by 2033, at a CAGR of xx%. The market penetration rate for nanotubes in Li-ion batteries is estimated at xx% in 2025, projected to increase to xx% by 2033.
Leading Markets & Segments in Nanotubes Market
The Asia-Pacific region currently dominates the nanotubes market, driven by robust economic growth, increasing industrialization, and government support for advanced materials research. Within this region, China holds a significant market share. Other significant regions are North America and Europe.
- Dominant Region: Asia-Pacific
- Dominant Country: China
- Dominant Type: Carbon Nanotubes (CNTs) hold the largest market share due to their established applications and cost-effectiveness.
- Dominant Structure Type: Non-polymer Organic Nanomaterials dominate due to superior mechanical and electrical properties.
- Dominant Application: Li-ion Batteries are the leading application area due to high demand from the electronics and automotive sectors. Other important applications include conductive plastics and sensors.
- Dominant End-user Industry: Electronics are currently the largest end-user industry, followed by energy and healthcare.
Key Drivers:
- Rapid industrialization in Asia-Pacific.
- Increasing government investments in research and development.
- Favorable economic policies promoting technological advancements.
- Growing demand for lightweight, high-strength materials in various sectors.
Nanotubes Market Product Developments
Recent product innovations have focused on improving the dispersion and functionalization of nanotubes to enhance their performance in different applications. Companies are developing specialized nanotubes with tailored properties for specific uses, resulting in superior performance and market fit compared to traditional materials. This includes advancements in CNT synthesis, such as the development of high-purity CNTs and novel functionalization methods for better integration into composites and devices.
Key Drivers of Nanotubes Market Growth
The market is fueled by technological advancements in synthesis and functionalization, coupled with growing demand from electronics (miniaturization, improved conductivity), energy (high-capacity batteries, efficient solar cells), and healthcare (drug delivery, biosensors) industries. Favorable government policies supporting nanotechnology research and development, and increasing investments in renewable energy technologies are also contributing significantly.
Challenges in the Nanotubes Market Market
High production costs, especially for high-purity nanotubes, are a major barrier to widespread adoption. Supply chain complexities and variability in nanotube quality also present challenges. Addressing environmental concerns regarding nanotube disposal and safety remains a crucial factor impacting growth. Furthermore, intense competition from established players and emerging technologies (e.g., graphene) impacts profit margins and market share.
Emerging Opportunities in Nanotubes Market
Long-term growth is expected from strategic partnerships and collaborations driving innovation and market penetration. Breakthroughs in scalable and cost-effective production methods, alongside the exploration of new applications such as water purification and advanced composites will be key factors. Market expansion into developing economies with growing industrialization presents significant opportunities.
Leading Players in the Nanotubes Market Sector
- Jiangsu Cnano Technology Co Ltd
- Nanoshel LLC
- Arkema
- NanoIntegris Inc
- LG Chem
- Cheap Tubes
- Carbon Solutions Inc
- Hyperion Catalysis International
- Resonac Holdings Corporation
- Nano-C
- Thomas Swan & Co Ltd
- Nanocyl SA (Birla Carbon)
Key Milestones in Nanotubes Market Industry
- October 2023: Birla Carbon (Aditya Birla Group) acquired Nanocyl SA, strengthening its position in the lithium-ion battery materials market.
- May 2023: LG Chem commenced construction of its fourth CNT plant, set to double its annual production capacity to 6,100 tons by 2025.
Strategic Outlook for Nanotubes Market Market
The nanotubes market presents a significant long-term growth potential driven by technological advancements and increasing demand across diverse sectors. Strategic investments in research and development, coupled with expansion into new applications and emerging markets, will be crucial for success. Companies focusing on sustainable and cost-effective production methods will gain a competitive advantage.
Nanotubes Market Segmentation
-
1. Type
- 1.1. Carbon Nanotubes
- 1.2. Silicon Nanotubes
- 1.3. Inorganic Nanotubes
- 1.4. Other Types (Membrane Nanotubes, Etc.)
-
2. Structure Type
- 2.1. Non-polymer Organic Nanomaterials
- 2.2. Polymeric Nanomaterials
-
3. Application
- 3.1. Hydrogen Storage Devices
- 3.2. Sensors
- 3.3. Polymeric Biomaterials
- 3.4. Li-ion Batteries
- 3.5. Luminescent Display Devices
- 3.6. Biosensors
- 3.7. Nanoelectrodes
- 3.8. Water Purification Filters
- 3.9. Semiconductor Devices
- 3.10. Conductive Plastics
-
4. End-user Industry
- 4.1. Healthcare
- 4.2. Electronics
- 4.3. Energy
- 4.4. Automotive
- 4.5. Aerospace and Defense
- 4.6. Textile
- 4.7. Other En
Nanotubes Market Segmentation By Geography
-
1. Asia Pacific
- 1.1. China
- 1.2. India
- 1.3. Japan
- 1.4. South Korea
- 1.5. Rest of Asia Pacific
-
2. North America
- 2.1. United States
- 2.2. Canada
- 2.3. Mexico
-
3. Europe
- 3.1. Germany
- 3.2. United Kingdom
- 3.3. France
- 3.4. Italy
- 3.5. Rest of Europe
-
4. South America
- 4.1. Brazil
- 4.2. Argentina
- 4.3. Rest of South America
-
5. Middle East and Africa
- 5.1. Saudi Arabia
- 5.2. South Africa
- 5.3. Rest of Middle East and Africa
Nanotubes Market Regional Market Share
Geographic Coverage of Nanotubes Market
Nanotubes Market REPORT HIGHLIGHTS
| Aspects | Details |
|---|---|
| Study Period | 2020-2034 |
| Base Year | 2025 |
| Estimated Year | 2026 |
| Forecast Period | 2026-2034 |
| Historical Period | 2020-2025 |
| Growth Rate | CAGR of 19.95% from 2020-2034 |
| Segmentation |
|
Table of Contents
- 1. Introduction
- 1.1. Research Scope
- 1.2. Market Segmentation
- 1.3. Research Objective
- 1.4. Definitions and Assumptions
- 2. Executive Summary
- 2.1. Market Snapshot
- 3. Market Dynamics
- 3.1. Market Drivers
- 3.2. Market Restrains
- 3.3. Market Trends
- 3.4. Market Opportunities
- 4. Market Factor Analysis
- 4.1. Porters Five Forces
- 4.1.1. Bargaining Power of Suppliers
- 4.1.2. Bargaining Power of Buyers
- 4.1.3. Threat of New Entrants
- 4.1.4. Threat of Substitutes
- 4.1.5. Competitive Rivalry
- 4.2. PESTEL analysis
- 4.3. BCG Analysis
- 4.3.1. Stars (High Growth, High Market Share)
- 4.3.2. Cash Cows (Low Growth, High Market Share)
- 4.3.3. Question Mark (High Growth, Low Market Share)
- 4.3.4. Dogs (Low Growth, Low Market Share)
- 4.4. Ansoff Matrix Analysis
- 4.5. Supply Chain Analysis
- 4.6. Regulatory Landscape
- 4.7. Current Market Potential and Opportunity Assessment (TAM–SAM–SOM Framework)
- 4.8. MDP Analyst Note
- 4.1. Porters Five Forces
- 5. Market Analysis, Insights and Forecast 2021-2033
- 5.1. Market Analysis, Insights and Forecast - by Type
- 5.1.1. Carbon Nanotubes
- 5.1.2. Silicon Nanotubes
- 5.1.3. Inorganic Nanotubes
- 5.1.4. Other Types (Membrane Nanotubes, Etc.)
- 5.2. Market Analysis, Insights and Forecast - by Structure Type
- 5.2.1. Non-polymer Organic Nanomaterials
- 5.2.2. Polymeric Nanomaterials
- 5.3. Market Analysis, Insights and Forecast - by Application
- 5.3.1. Hydrogen Storage Devices
- 5.3.2. Sensors
- 5.3.3. Polymeric Biomaterials
- 5.3.4. Li-ion Batteries
- 5.3.5. Luminescent Display Devices
- 5.3.6. Biosensors
- 5.3.7. Nanoelectrodes
- 5.3.8. Water Purification Filters
- 5.3.9. Semiconductor Devices
- 5.3.10. Conductive Plastics
- 5.4. Market Analysis, Insights and Forecast - by End-user Industry
- 5.4.1. Healthcare
- 5.4.2. Electronics
- 5.4.3. Energy
- 5.4.4. Automotive
- 5.4.5. Aerospace and Defense
- 5.4.6. Textile
- 5.4.7. Other En
- 5.5. Market Analysis, Insights and Forecast - by Region
- 5.5.1. Asia Pacific
- 5.5.2. North America
- 5.5.3. Europe
- 5.5.4. South America
- 5.5.5. Middle East and Africa
- 5.1. Market Analysis, Insights and Forecast - by Type
- 6. Global Nanotubes Market Analysis, Insights and Forecast, 2021-2033
- 6.1. Market Analysis, Insights and Forecast - by Type
- 6.1.1. Carbon Nanotubes
- 6.1.2. Silicon Nanotubes
- 6.1.3. Inorganic Nanotubes
- 6.1.4. Other Types (Membrane Nanotubes, Etc.)
- 6.2. Market Analysis, Insights and Forecast - by Structure Type
- 6.2.1. Non-polymer Organic Nanomaterials
- 6.2.2. Polymeric Nanomaterials
- 6.3. Market Analysis, Insights and Forecast - by Application
- 6.3.1. Hydrogen Storage Devices
- 6.3.2. Sensors
- 6.3.3. Polymeric Biomaterials
- 6.3.4. Li-ion Batteries
- 6.3.5. Luminescent Display Devices
- 6.3.6. Biosensors
- 6.3.7. Nanoelectrodes
- 6.3.8. Water Purification Filters
- 6.3.9. Semiconductor Devices
- 6.3.10. Conductive Plastics
- 6.4. Market Analysis, Insights and Forecast - by End-user Industry
- 6.4.1. Healthcare
- 6.4.2. Electronics
- 6.4.3. Energy
- 6.4.4. Automotive
- 6.4.5. Aerospace and Defense
- 6.4.6. Textile
- 6.4.7. Other En
- 6.1. Market Analysis, Insights and Forecast - by Type
- 7. Asia Pacific Nanotubes Market Analysis, Insights and Forecast, 2020-2032
- 7.1. Market Analysis, Insights and Forecast - by Type
- 7.1.1. Carbon Nanotubes
- 7.1.2. Silicon Nanotubes
- 7.1.3. Inorganic Nanotubes
- 7.1.4. Other Types (Membrane Nanotubes, Etc.)
- 7.2. Market Analysis, Insights and Forecast - by Structure Type
- 7.2.1. Non-polymer Organic Nanomaterials
- 7.2.2. Polymeric Nanomaterials
- 7.3. Market Analysis, Insights and Forecast - by Application
- 7.3.1. Hydrogen Storage Devices
- 7.3.2. Sensors
- 7.3.3. Polymeric Biomaterials
- 7.3.4. Li-ion Batteries
- 7.3.5. Luminescent Display Devices
- 7.3.6. Biosensors
- 7.3.7. Nanoelectrodes
- 7.3.8. Water Purification Filters
- 7.3.9. Semiconductor Devices
- 7.3.10. Conductive Plastics
- 7.4. Market Analysis, Insights and Forecast - by End-user Industry
- 7.4.1. Healthcare
- 7.4.2. Electronics
- 7.4.3. Energy
- 7.4.4. Automotive
- 7.4.5. Aerospace and Defense
- 7.4.6. Textile
- 7.4.7. Other En
- 7.1. Market Analysis, Insights and Forecast - by Type
- 8. North America Nanotubes Market Analysis, Insights and Forecast, 2020-2032
- 8.1. Market Analysis, Insights and Forecast - by Type
- 8.1.1. Carbon Nanotubes
- 8.1.2. Silicon Nanotubes
- 8.1.3. Inorganic Nanotubes
- 8.1.4. Other Types (Membrane Nanotubes, Etc.)
- 8.2. Market Analysis, Insights and Forecast - by Structure Type
- 8.2.1. Non-polymer Organic Nanomaterials
- 8.2.2. Polymeric Nanomaterials
- 8.3. Market Analysis, Insights and Forecast - by Application
- 8.3.1. Hydrogen Storage Devices
- 8.3.2. Sensors
- 8.3.3. Polymeric Biomaterials
- 8.3.4. Li-ion Batteries
- 8.3.5. Luminescent Display Devices
- 8.3.6. Biosensors
- 8.3.7. Nanoelectrodes
- 8.3.8. Water Purification Filters
- 8.3.9. Semiconductor Devices
- 8.3.10. Conductive Plastics
- 8.4. Market Analysis, Insights and Forecast - by End-user Industry
- 8.4.1. Healthcare
- 8.4.2. Electronics
- 8.4.3. Energy
- 8.4.4. Automotive
- 8.4.5. Aerospace and Defense
- 8.4.6. Textile
- 8.4.7. Other En
- 8.1. Market Analysis, Insights and Forecast - by Type
- 9. Europe Nanotubes Market Analysis, Insights and Forecast, 2020-2032
- 9.1. Market Analysis, Insights and Forecast - by Type
- 9.1.1. Carbon Nanotubes
- 9.1.2. Silicon Nanotubes
- 9.1.3. Inorganic Nanotubes
- 9.1.4. Other Types (Membrane Nanotubes, Etc.)
- 9.2. Market Analysis, Insights and Forecast - by Structure Type
- 9.2.1. Non-polymer Organic Nanomaterials
- 9.2.2. Polymeric Nanomaterials
- 9.3. Market Analysis, Insights and Forecast - by Application
- 9.3.1. Hydrogen Storage Devices
- 9.3.2. Sensors
- 9.3.3. Polymeric Biomaterials
- 9.3.4. Li-ion Batteries
- 9.3.5. Luminescent Display Devices
- 9.3.6. Biosensors
- 9.3.7. Nanoelectrodes
- 9.3.8. Water Purification Filters
- 9.3.9. Semiconductor Devices
- 9.3.10. Conductive Plastics
- 9.4. Market Analysis, Insights and Forecast - by End-user Industry
- 9.4.1. Healthcare
- 9.4.2. Electronics
- 9.4.3. Energy
- 9.4.4. Automotive
- 9.4.5. Aerospace and Defense
- 9.4.6. Textile
- 9.4.7. Other En
- 9.1. Market Analysis, Insights and Forecast - by Type
- 10. South America Nanotubes Market Analysis, Insights and Forecast, 2020-2032
- 10.1. Market Analysis, Insights and Forecast - by Type
- 10.1.1. Carbon Nanotubes
- 10.1.2. Silicon Nanotubes
- 10.1.3. Inorganic Nanotubes
- 10.1.4. Other Types (Membrane Nanotubes, Etc.)
- 10.2. Market Analysis, Insights and Forecast - by Structure Type
- 10.2.1. Non-polymer Organic Nanomaterials
- 10.2.2. Polymeric Nanomaterials
- 10.3. Market Analysis, Insights and Forecast - by Application
- 10.3.1. Hydrogen Storage Devices
- 10.3.2. Sensors
- 10.3.3. Polymeric Biomaterials
- 10.3.4. Li-ion Batteries
- 10.3.5. Luminescent Display Devices
- 10.3.6. Biosensors
- 10.3.7. Nanoelectrodes
- 10.3.8. Water Purification Filters
- 10.3.9. Semiconductor Devices
- 10.3.10. Conductive Plastics
- 10.4. Market Analysis, Insights and Forecast - by End-user Industry
- 10.4.1. Healthcare
- 10.4.2. Electronics
- 10.4.3. Energy
- 10.4.4. Automotive
- 10.4.5. Aerospace and Defense
- 10.4.6. Textile
- 10.4.7. Other En
- 10.1. Market Analysis, Insights and Forecast - by Type
- 11. Middle East and Africa Nanotubes Market Analysis, Insights and Forecast, 2020-2032
- 11.1. Market Analysis, Insights and Forecast - by Type
- 11.1.1. Carbon Nanotubes
- 11.1.2. Silicon Nanotubes
- 11.1.3. Inorganic Nanotubes
- 11.1.4. Other Types (Membrane Nanotubes, Etc.)
- 11.2. Market Analysis, Insights and Forecast - by Structure Type
- 11.2.1. Non-polymer Organic Nanomaterials
- 11.2.2. Polymeric Nanomaterials
- 11.3. Market Analysis, Insights and Forecast - by Application
- 11.3.1. Hydrogen Storage Devices
- 11.3.2. Sensors
- 11.3.3. Polymeric Biomaterials
- 11.3.4. Li-ion Batteries
- 11.3.5. Luminescent Display Devices
- 11.3.6. Biosensors
- 11.3.7. Nanoelectrodes
- 11.3.8. Water Purification Filters
- 11.3.9. Semiconductor Devices
- 11.3.10. Conductive Plastics
- 11.4. Market Analysis, Insights and Forecast - by End-user Industry
- 11.4.1. Healthcare
- 11.4.2. Electronics
- 11.4.3. Energy
- 11.4.4. Automotive
- 11.4.5. Aerospace and Defense
- 11.4.6. Textile
- 11.4.7. Other En
- 11.1. Market Analysis, Insights and Forecast - by Type
- 12. Competitive Analysis
- 12.1. Company Profiles
- 12.1.1 Jiangsu Cnano Technology Co Ltd
- 12.1.1.1. Company Overview
- 12.1.1.2. Products
- 12.1.1.3. Company Financials
- 12.1.1.4. SWOT Analysis
- 12.1.2 Nanoshel LLC
- 12.1.2.1. Company Overview
- 12.1.2.2. Products
- 12.1.2.3. Company Financials
- 12.1.2.4. SWOT Analysis
- 12.1.3 Arkema
- 12.1.3.1. Company Overview
- 12.1.3.2. Products
- 12.1.3.3. Company Financials
- 12.1.3.4. SWOT Analysis
- 12.1.4 NanoIntegris Inc
- 12.1.4.1. Company Overview
- 12.1.4.2. Products
- 12.1.4.3. Company Financials
- 12.1.4.4. SWOT Analysis
- 12.1.5 LG Chem
- 12.1.5.1. Company Overview
- 12.1.5.2. Products
- 12.1.5.3. Company Financials
- 12.1.5.4. SWOT Analysis
- 12.1.6 Cheap Tubes
- 12.1.6.1. Company Overview
- 12.1.6.2. Products
- 12.1.6.3. Company Financials
- 12.1.6.4. SWOT Analysis
- 12.1.7 Carbon Solutions Inc
- 12.1.7.1. Company Overview
- 12.1.7.2. Products
- 12.1.7.3. Company Financials
- 12.1.7.4. SWOT Analysis
- 12.1.8 Hyperion Catalysis International
- 12.1.8.1. Company Overview
- 12.1.8.2. Products
- 12.1.8.3. Company Financials
- 12.1.8.4. SWOT Analysis
- 12.1.9 Resonac Holdings Corporation
- 12.1.9.1. Company Overview
- 12.1.9.2. Products
- 12.1.9.3. Company Financials
- 12.1.9.4. SWOT Analysis
- 12.1.10 Nano-C
- 12.1.10.1. Company Overview
- 12.1.10.2. Products
- 12.1.10.3. Company Financials
- 12.1.10.4. SWOT Analysis
- 12.1.11 Thomas Swan & Co Ltd
- 12.1.11.1. Company Overview
- 12.1.11.2. Products
- 12.1.11.3. Company Financials
- 12.1.11.4. SWOT Analysis
- 12.1.12 Nanocyl SA (Birla Carbon)
- 12.1.12.1. Company Overview
- 12.1.12.2. Products
- 12.1.12.3. Company Financials
- 12.1.12.4. SWOT Analysis
- 12.1.1 Jiangsu Cnano Technology Co Ltd
- 12.2. Market Entropy
- 12.2.1 Company's Key Areas Served
- 12.2.2 Recent Developments
- 12.3. Company Market Share Analysis 2025
- 12.3.1 Top 5 Companies Market Share Analysis
- 12.3.2 Top 3 Companies Market Share Analysis
- 12.4. List of Potential Customers
- 13. Research Methodology
List of Figures
- Figure 1: Global Nanotubes Market Revenue Breakdown (Million, %) by Region 2025 & 2033
- Figure 2: Global Nanotubes Market Volume Breakdown (K Tons, %) by Region 2025 & 2033
- Figure 3: Asia Pacific Nanotubes Market Revenue (Million), by Type 2025 & 2033
- Figure 4: Asia Pacific Nanotubes Market Volume (K Tons), by Type 2025 & 2033
- Figure 5: Asia Pacific Nanotubes Market Revenue Share (%), by Type 2025 & 2033
- Figure 6: Asia Pacific Nanotubes Market Volume Share (%), by Type 2025 & 2033
- Figure 7: Asia Pacific Nanotubes Market Revenue (Million), by Structure Type 2025 & 2033
- Figure 8: Asia Pacific Nanotubes Market Volume (K Tons), by Structure Type 2025 & 2033
- Figure 9: Asia Pacific Nanotubes Market Revenue Share (%), by Structure Type 2025 & 2033
- Figure 10: Asia Pacific Nanotubes Market Volume Share (%), by Structure Type 2025 & 2033
- Figure 11: Asia Pacific Nanotubes Market Revenue (Million), by Application 2025 & 2033
- Figure 12: Asia Pacific Nanotubes Market Volume (K Tons), by Application 2025 & 2033
- Figure 13: Asia Pacific Nanotubes Market Revenue Share (%), by Application 2025 & 2033
- Figure 14: Asia Pacific Nanotubes Market Volume Share (%), by Application 2025 & 2033
- Figure 15: Asia Pacific Nanotubes Market Revenue (Million), by End-user Industry 2025 & 2033
- Figure 16: Asia Pacific Nanotubes Market Volume (K Tons), by End-user Industry 2025 & 2033
- Figure 17: Asia Pacific Nanotubes Market Revenue Share (%), by End-user Industry 2025 & 2033
- Figure 18: Asia Pacific Nanotubes Market Volume Share (%), by End-user Industry 2025 & 2033
- Figure 19: Asia Pacific Nanotubes Market Revenue (Million), by Country 2025 & 2033
- Figure 20: Asia Pacific Nanotubes Market Volume (K Tons), by Country 2025 & 2033
- Figure 21: Asia Pacific Nanotubes Market Revenue Share (%), by Country 2025 & 2033
- Figure 22: Asia Pacific Nanotubes Market Volume Share (%), by Country 2025 & 2033
- Figure 23: North America Nanotubes Market Revenue (Million), by Type 2025 & 2033
- Figure 24: North America Nanotubes Market Volume (K Tons), by Type 2025 & 2033
- Figure 25: North America Nanotubes Market Revenue Share (%), by Type 2025 & 2033
- Figure 26: North America Nanotubes Market Volume Share (%), by Type 2025 & 2033
- Figure 27: North America Nanotubes Market Revenue (Million), by Structure Type 2025 & 2033
- Figure 28: North America Nanotubes Market Volume (K Tons), by Structure Type 2025 & 2033
- Figure 29: North America Nanotubes Market Revenue Share (%), by Structure Type 2025 & 2033
- Figure 30: North America Nanotubes Market Volume Share (%), by Structure Type 2025 & 2033
- Figure 31: North America Nanotubes Market Revenue (Million), by Application 2025 & 2033
- Figure 32: North America Nanotubes Market Volume (K Tons), by Application 2025 & 2033
- Figure 33: North America Nanotubes Market Revenue Share (%), by Application 2025 & 2033
- Figure 34: North America Nanotubes Market Volume Share (%), by Application 2025 & 2033
- Figure 35: North America Nanotubes Market Revenue (Million), by End-user Industry 2025 & 2033
- Figure 36: North America Nanotubes Market Volume (K Tons), by End-user Industry 2025 & 2033
- Figure 37: North America Nanotubes Market Revenue Share (%), by End-user Industry 2025 & 2033
- Figure 38: North America Nanotubes Market Volume Share (%), by End-user Industry 2025 & 2033
- Figure 39: North America Nanotubes Market Revenue (Million), by Country 2025 & 2033
- Figure 40: North America Nanotubes Market Volume (K Tons), by Country 2025 & 2033
- Figure 41: North America Nanotubes Market Revenue Share (%), by Country 2025 & 2033
- Figure 42: North America Nanotubes Market Volume Share (%), by Country 2025 & 2033
- Figure 43: Europe Nanotubes Market Revenue (Million), by Type 2025 & 2033
- Figure 44: Europe Nanotubes Market Volume (K Tons), by Type 2025 & 2033
- Figure 45: Europe Nanotubes Market Revenue Share (%), by Type 2025 & 2033
- Figure 46: Europe Nanotubes Market Volume Share (%), by Type 2025 & 2033
- Figure 47: Europe Nanotubes Market Revenue (Million), by Structure Type 2025 & 2033
- Figure 48: Europe Nanotubes Market Volume (K Tons), by Structure Type 2025 & 2033
- Figure 49: Europe Nanotubes Market Revenue Share (%), by Structure Type 2025 & 2033
- Figure 50: Europe Nanotubes Market Volume Share (%), by Structure Type 2025 & 2033
- Figure 51: Europe Nanotubes Market Revenue (Million), by Application 2025 & 2033
- Figure 52: Europe Nanotubes Market Volume (K Tons), by Application 2025 & 2033
- Figure 53: Europe Nanotubes Market Revenue Share (%), by Application 2025 & 2033
- Figure 54: Europe Nanotubes Market Volume Share (%), by Application 2025 & 2033
- Figure 55: Europe Nanotubes Market Revenue (Million), by End-user Industry 2025 & 2033
- Figure 56: Europe Nanotubes Market Volume (K Tons), by End-user Industry 2025 & 2033
- Figure 57: Europe Nanotubes Market Revenue Share (%), by End-user Industry 2025 & 2033
- Figure 58: Europe Nanotubes Market Volume Share (%), by End-user Industry 2025 & 2033
- Figure 59: Europe Nanotubes Market Revenue (Million), by Country 2025 & 2033
- Figure 60: Europe Nanotubes Market Volume (K Tons), by Country 2025 & 2033
- Figure 61: Europe Nanotubes Market Revenue Share (%), by Country 2025 & 2033
- Figure 62: Europe Nanotubes Market Volume Share (%), by Country 2025 & 2033
- Figure 63: South America Nanotubes Market Revenue (Million), by Type 2025 & 2033
- Figure 64: South America Nanotubes Market Volume (K Tons), by Type 2025 & 2033
- Figure 65: South America Nanotubes Market Revenue Share (%), by Type 2025 & 2033
- Figure 66: South America Nanotubes Market Volume Share (%), by Type 2025 & 2033
- Figure 67: South America Nanotubes Market Revenue (Million), by Structure Type 2025 & 2033
- Figure 68: South America Nanotubes Market Volume (K Tons), by Structure Type 2025 & 2033
- Figure 69: South America Nanotubes Market Revenue Share (%), by Structure Type 2025 & 2033
- Figure 70: South America Nanotubes Market Volume Share (%), by Structure Type 2025 & 2033
- Figure 71: South America Nanotubes Market Revenue (Million), by Application 2025 & 2033
- Figure 72: South America Nanotubes Market Volume (K Tons), by Application 2025 & 2033
- Figure 73: South America Nanotubes Market Revenue Share (%), by Application 2025 & 2033
- Figure 74: South America Nanotubes Market Volume Share (%), by Application 2025 & 2033
- Figure 75: South America Nanotubes Market Revenue (Million), by End-user Industry 2025 & 2033
- Figure 76: South America Nanotubes Market Volume (K Tons), by End-user Industry 2025 & 2033
- Figure 77: South America Nanotubes Market Revenue Share (%), by End-user Industry 2025 & 2033
- Figure 78: South America Nanotubes Market Volume Share (%), by End-user Industry 2025 & 2033
- Figure 79: South America Nanotubes Market Revenue (Million), by Country 2025 & 2033
- Figure 80: South America Nanotubes Market Volume (K Tons), by Country 2025 & 2033
- Figure 81: South America Nanotubes Market Revenue Share (%), by Country 2025 & 2033
- Figure 82: South America Nanotubes Market Volume Share (%), by Country 2025 & 2033
- Figure 83: Middle East and Africa Nanotubes Market Revenue (Million), by Type 2025 & 2033
- Figure 84: Middle East and Africa Nanotubes Market Volume (K Tons), by Type 2025 & 2033
- Figure 85: Middle East and Africa Nanotubes Market Revenue Share (%), by Type 2025 & 2033
- Figure 86: Middle East and Africa Nanotubes Market Volume Share (%), by Type 2025 & 2033
- Figure 87: Middle East and Africa Nanotubes Market Revenue (Million), by Structure Type 2025 & 2033
- Figure 88: Middle East and Africa Nanotubes Market Volume (K Tons), by Structure Type 2025 & 2033
- Figure 89: Middle East and Africa Nanotubes Market Revenue Share (%), by Structure Type 2025 & 2033
- Figure 90: Middle East and Africa Nanotubes Market Volume Share (%), by Structure Type 2025 & 2033
- Figure 91: Middle East and Africa Nanotubes Market Revenue (Million), by Application 2025 & 2033
- Figure 92: Middle East and Africa Nanotubes Market Volume (K Tons), by Application 2025 & 2033
- Figure 93: Middle East and Africa Nanotubes Market Revenue Share (%), by Application 2025 & 2033
- Figure 94: Middle East and Africa Nanotubes Market Volume Share (%), by Application 2025 & 2033
- Figure 95: Middle East and Africa Nanotubes Market Revenue (Million), by End-user Industry 2025 & 2033
- Figure 96: Middle East and Africa Nanotubes Market Volume (K Tons), by End-user Industry 2025 & 2033
- Figure 97: Middle East and Africa Nanotubes Market Revenue Share (%), by End-user Industry 2025 & 2033
- Figure 98: Middle East and Africa Nanotubes Market Volume Share (%), by End-user Industry 2025 & 2033
- Figure 99: Middle East and Africa Nanotubes Market Revenue (Million), by Country 2025 & 2033
- Figure 100: Middle East and Africa Nanotubes Market Volume (K Tons), by Country 2025 & 2033
- Figure 101: Middle East and Africa Nanotubes Market Revenue Share (%), by Country 2025 & 2033
- Figure 102: Middle East and Africa Nanotubes Market Volume Share (%), by Country 2025 & 2033
List of Tables
- Table 1: Global Nanotubes Market Revenue Million Forecast, by Type 2020 & 2033
- Table 2: Global Nanotubes Market Volume K Tons Forecast, by Type 2020 & 2033
- Table 3: Global Nanotubes Market Revenue Million Forecast, by Structure Type 2020 & 2033
- Table 4: Global Nanotubes Market Volume K Tons Forecast, by Structure Type 2020 & 2033
- Table 5: Global Nanotubes Market Revenue Million Forecast, by Application 2020 & 2033
- Table 6: Global Nanotubes Market Volume K Tons Forecast, by Application 2020 & 2033
- Table 7: Global Nanotubes Market Revenue Million Forecast, by End-user Industry 2020 & 2033
- Table 8: Global Nanotubes Market Volume K Tons Forecast, by End-user Industry 2020 & 2033
- Table 9: Global Nanotubes Market Revenue Million Forecast, by Region 2020 & 2033
- Table 10: Global Nanotubes Market Volume K Tons Forecast, by Region 2020 & 2033
- Table 11: Global Nanotubes Market Revenue Million Forecast, by Type 2020 & 2033
- Table 12: Global Nanotubes Market Volume K Tons Forecast, by Type 2020 & 2033
- Table 13: Global Nanotubes Market Revenue Million Forecast, by Structure Type 2020 & 2033
- Table 14: Global Nanotubes Market Volume K Tons Forecast, by Structure Type 2020 & 2033
- Table 15: Global Nanotubes Market Revenue Million Forecast, by Application 2020 & 2033
- Table 16: Global Nanotubes Market Volume K Tons Forecast, by Application 2020 & 2033
- Table 17: Global Nanotubes Market Revenue Million Forecast, by End-user Industry 2020 & 2033
- Table 18: Global Nanotubes Market Volume K Tons Forecast, by End-user Industry 2020 & 2033
- Table 19: Global Nanotubes Market Revenue Million Forecast, by Country 2020 & 2033
- Table 20: Global Nanotubes Market Volume K Tons Forecast, by Country 2020 & 2033
- Table 21: China Nanotubes Market Revenue (Million) Forecast, by Application 2020 & 2033
- Table 22: China Nanotubes Market Volume (K Tons) Forecast, by Application 2020 & 2033
- Table 23: India Nanotubes Market Revenue (Million) Forecast, by Application 2020 & 2033
- Table 24: India Nanotubes Market Volume (K Tons) Forecast, by Application 2020 & 2033
- Table 25: Japan Nanotubes Market Revenue (Million) Forecast, by Application 2020 & 2033
- Table 26: Japan Nanotubes Market Volume (K Tons) Forecast, by Application 2020 & 2033
- Table 27: South Korea Nanotubes Market Revenue (Million) Forecast, by Application 2020 & 2033
- Table 28: South Korea Nanotubes Market Volume (K Tons) Forecast, by Application 2020 & 2033
- Table 29: Rest of Asia Pacific Nanotubes Market Revenue (Million) Forecast, by Application 2020 & 2033
- Table 30: Rest of Asia Pacific Nanotubes Market Volume (K Tons) Forecast, by Application 2020 & 2033
- Table 31: Global Nanotubes Market Revenue Million Forecast, by Type 2020 & 2033
- Table 32: Global Nanotubes Market Volume K Tons Forecast, by Type 2020 & 2033
- Table 33: Global Nanotubes Market Revenue Million Forecast, by Structure Type 2020 & 2033
- Table 34: Global Nanotubes Market Volume K Tons Forecast, by Structure Type 2020 & 2033
- Table 35: Global Nanotubes Market Revenue Million Forecast, by Application 2020 & 2033
- Table 36: Global Nanotubes Market Volume K Tons Forecast, by Application 2020 & 2033
- Table 37: Global Nanotubes Market Revenue Million Forecast, by End-user Industry 2020 & 2033
- Table 38: Global Nanotubes Market Volume K Tons Forecast, by End-user Industry 2020 & 2033
- Table 39: Global Nanotubes Market Revenue Million Forecast, by Country 2020 & 2033
- Table 40: Global Nanotubes Market Volume K Tons Forecast, by Country 2020 & 2033
- Table 41: United States Nanotubes Market Revenue (Million) Forecast, by Application 2020 & 2033
- Table 42: United States Nanotubes Market Volume (K Tons) Forecast, by Application 2020 & 2033
- Table 43: Canada Nanotubes Market Revenue (Million) Forecast, by Application 2020 & 2033
- Table 44: Canada Nanotubes Market Volume (K Tons) Forecast, by Application 2020 & 2033
- Table 45: Mexico Nanotubes Market Revenue (Million) Forecast, by Application 2020 & 2033
- Table 46: Mexico Nanotubes Market Volume (K Tons) Forecast, by Application 2020 & 2033
- Table 47: Global Nanotubes Market Revenue Million Forecast, by Type 2020 & 2033
- Table 48: Global Nanotubes Market Volume K Tons Forecast, by Type 2020 & 2033
- Table 49: Global Nanotubes Market Revenue Million Forecast, by Structure Type 2020 & 2033
- Table 50: Global Nanotubes Market Volume K Tons Forecast, by Structure Type 2020 & 2033
- Table 51: Global Nanotubes Market Revenue Million Forecast, by Application 2020 & 2033
- Table 52: Global Nanotubes Market Volume K Tons Forecast, by Application 2020 & 2033
- Table 53: Global Nanotubes Market Revenue Million Forecast, by End-user Industry 2020 & 2033
- Table 54: Global Nanotubes Market Volume K Tons Forecast, by End-user Industry 2020 & 2033
- Table 55: Global Nanotubes Market Revenue Million Forecast, by Country 2020 & 2033
- Table 56: Global Nanotubes Market Volume K Tons Forecast, by Country 2020 & 2033
- Table 57: Germany Nanotubes Market Revenue (Million) Forecast, by Application 2020 & 2033
- Table 58: Germany Nanotubes Market Volume (K Tons) Forecast, by Application 2020 & 2033
- Table 59: United Kingdom Nanotubes Market Revenue (Million) Forecast, by Application 2020 & 2033
- Table 60: United Kingdom Nanotubes Market Volume (K Tons) Forecast, by Application 2020 & 2033
- Table 61: France Nanotubes Market Revenue (Million) Forecast, by Application 2020 & 2033
- Table 62: France Nanotubes Market Volume (K Tons) Forecast, by Application 2020 & 2033
- Table 63: Italy Nanotubes Market Revenue (Million) Forecast, by Application 2020 & 2033
- Table 64: Italy Nanotubes Market Volume (K Tons) Forecast, by Application 2020 & 2033
- Table 65: Rest of Europe Nanotubes Market Revenue (Million) Forecast, by Application 2020 & 2033
- Table 66: Rest of Europe Nanotubes Market Volume (K Tons) Forecast, by Application 2020 & 2033
- Table 67: Global Nanotubes Market Revenue Million Forecast, by Type 2020 & 2033
- Table 68: Global Nanotubes Market Volume K Tons Forecast, by Type 2020 & 2033
- Table 69: Global Nanotubes Market Revenue Million Forecast, by Structure Type 2020 & 2033
- Table 70: Global Nanotubes Market Volume K Tons Forecast, by Structure Type 2020 & 2033
- Table 71: Global Nanotubes Market Revenue Million Forecast, by Application 2020 & 2033
- Table 72: Global Nanotubes Market Volume K Tons Forecast, by Application 2020 & 2033
- Table 73: Global Nanotubes Market Revenue Million Forecast, by End-user Industry 2020 & 2033
- Table 74: Global Nanotubes Market Volume K Tons Forecast, by End-user Industry 2020 & 2033
- Table 75: Global Nanotubes Market Revenue Million Forecast, by Country 2020 & 2033
- Table 76: Global Nanotubes Market Volume K Tons Forecast, by Country 2020 & 2033
- Table 77: Brazil Nanotubes Market Revenue (Million) Forecast, by Application 2020 & 2033
- Table 78: Brazil Nanotubes Market Volume (K Tons) Forecast, by Application 2020 & 2033
- Table 79: Argentina Nanotubes Market Revenue (Million) Forecast, by Application 2020 & 2033
- Table 80: Argentina Nanotubes Market Volume (K Tons) Forecast, by Application 2020 & 2033
- Table 81: Rest of South America Nanotubes Market Revenue (Million) Forecast, by Application 2020 & 2033
- Table 82: Rest of South America Nanotubes Market Volume (K Tons) Forecast, by Application 2020 & 2033
- Table 83: Global Nanotubes Market Revenue Million Forecast, by Type 2020 & 2033
- Table 84: Global Nanotubes Market Volume K Tons Forecast, by Type 2020 & 2033
- Table 85: Global Nanotubes Market Revenue Million Forecast, by Structure Type 2020 & 2033
- Table 86: Global Nanotubes Market Volume K Tons Forecast, by Structure Type 2020 & 2033
- Table 87: Global Nanotubes Market Revenue Million Forecast, by Application 2020 & 2033
- Table 88: Global Nanotubes Market Volume K Tons Forecast, by Application 2020 & 2033
- Table 89: Global Nanotubes Market Revenue Million Forecast, by End-user Industry 2020 & 2033
- Table 90: Global Nanotubes Market Volume K Tons Forecast, by End-user Industry 2020 & 2033
- Table 91: Global Nanotubes Market Revenue Million Forecast, by Country 2020 & 2033
- Table 92: Global Nanotubes Market Volume K Tons Forecast, by Country 2020 & 2033
- Table 93: Saudi Arabia Nanotubes Market Revenue (Million) Forecast, by Application 2020 & 2033
- Table 94: Saudi Arabia Nanotubes Market Volume (K Tons) Forecast, by Application 2020 & 2033
- Table 95: South Africa Nanotubes Market Revenue (Million) Forecast, by Application 2020 & 2033
- Table 96: South Africa Nanotubes Market Volume (K Tons) Forecast, by Application 2020 & 2033
- Table 97: Rest of Middle East and Africa Nanotubes Market Revenue (Million) Forecast, by Application 2020 & 2033
- Table 98: Rest of Middle East and Africa Nanotubes Market Volume (K Tons) Forecast, by Application 2020 & 2033
Frequently Asked Questions
1. What is the projected Compound Annual Growth Rate (CAGR) of the Nanotubes Market?
The projected CAGR is approximately 19.95%.
2. Which companies are prominent players in the Nanotubes Market?
Key companies in the market include Jiangsu Cnano Technology Co Ltd, Nanoshel LLC, Arkema, NanoIntegris Inc, LG Chem, Cheap Tubes, Carbon Solutions Inc, Hyperion Catalysis International, Resonac Holdings Corporation, Nano-C, Thomas Swan & Co Ltd, Nanocyl SA (Birla Carbon).
3. What are the main segments of the Nanotubes Market?
The market segments include Type, Structure Type, Application, End-user Industry.
4. Can you provide details about the market size?
The market size is estimated to be USD 7.98 Million as of 2022.
5. What are some drivers contributing to market growth?
Advancement in Nanotubes Technologies; Growing Adoption of Carbon Nanotubes; Other Drivers.
6. What are the notable trends driving market growth?
Electronics and Semiconductor Segment to Dominate the Market Demand.
7. Are there any restraints impacting market growth?
High Manufacturing and R&D Cost; Other Restraints.
8. Can you provide examples of recent developments in the market?
October 2023: Birla Carbon (Aditya Birla Group) acquired Nanocyl SA to enhance its growth in battery materials for lithium-ion batteries, which will add value to its nanotubes business segment.
9. What pricing options are available for accessing the report?
Pricing options include single-user, multi-user, and enterprise licenses priced at USD 4750, USD 5250, and USD 8750 respectively.
10. Is the market size provided in terms of value or volume?
The market size is provided in terms of value, measured in Million and volume, measured in K Tons.
11. Are there any specific market keywords associated with the report?
Yes, the market keyword associated with the report is "Nanotubes Market," which aids in identifying and referencing the specific market segment covered.
12. How do I determine which pricing option suits my needs best?
The pricing options vary based on user requirements and access needs. Individual users may opt for single-user licenses, while businesses requiring broader access may choose multi-user or enterprise licenses for cost-effective access to the report.
13. Are there any additional resources or data provided in the Nanotubes Market report?
While the report offers comprehensive insights, it's advisable to review the specific contents or supplementary materials provided to ascertain if additional resources or data are available.
14. How can I stay updated on further developments or reports in the Nanotubes Market?
To stay informed about further developments, trends, and reports in the Nanotubes Market, consider subscribing to industry newsletters, following relevant companies and organizations, or regularly checking reputable industry news sources and publications.
Methodology
Step 1 - Identification of Relevant Samples Size from Population Database


Step 2 - Approaches for Defining Global Market Size (Value, Volume* & Price*)

Note*: In applicable scenarios
Step 3 - Data Sources
Primary Research
- Web Analytics
- Survey Reports
- Research Institute
- Latest Research Reports
- Opinion Leaders
Secondary Research
- Annual Reports
- White Paper
- Latest Press Release
- Industry Association
- Paid Database
- Investor Presentations

Step 4 - Data Triangulation
Involves using different sources of information in order to increase the validity of a study
These sources are likely to be stakeholders in a program - participants, other researchers, program staff, other community members, and so on.
Then we put all data in single framework & apply various statistical tools to find out the dynamic on the market.
During the analysis stage, feedback from the stakeholder groups would be compared to determine areas of agreement as well as areas of divergence