

Key Insights
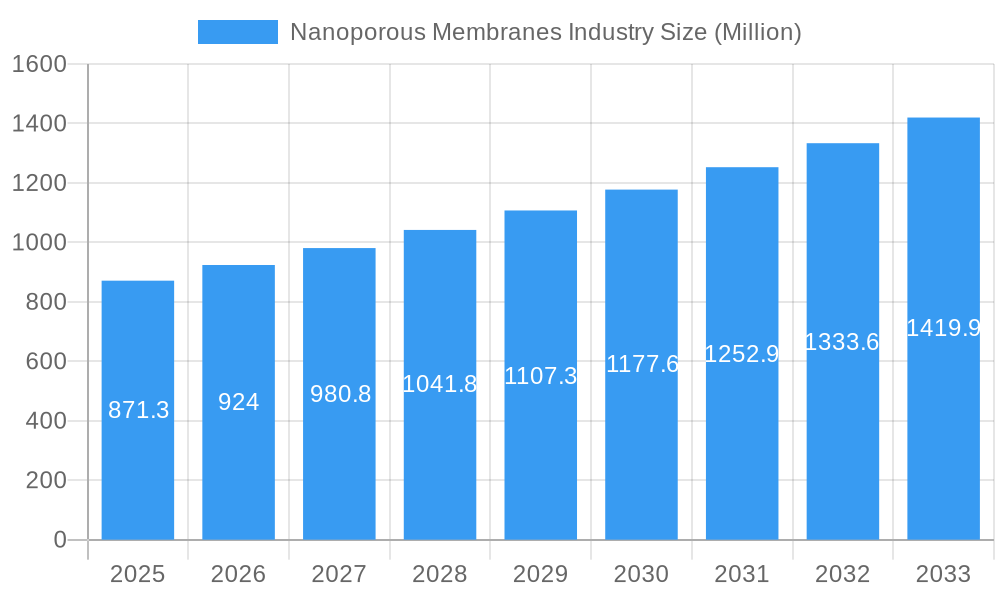
The nanoporous membranes market, valued at $871.3 million in 2025, is projected to experience robust growth, driven by increasing demand across diverse applications. A Compound Annual Growth Rate (CAGR) of 6% from 2025 to 2033 indicates a substantial market expansion. Key drivers include the rising need for advanced water purification technologies in both industrial and residential settings, the burgeoning fuel cell market seeking efficient and durable membrane separators, and the expanding biomedical sector utilizing nanoporous membranes for drug delivery and diagnostics. Growth is further fueled by advancements in material science, leading to the development of innovative hybrid membranes combining the advantages of organic and inorganic materials. The organic segment currently holds a significant market share due to its biocompatibility and cost-effectiveness in certain applications, while inorganic materials like ceramics, carbon nanotubes, and graphene are gaining traction owing to their superior chemical and thermal stability. The water treatment application segment is expected to dominate the market due to its large-scale adoption, followed by fuel cells and biomedical applications, which are experiencing high growth rates. However, challenges such as high manufacturing costs for some advanced materials and potential regulatory hurdles in certain applications may pose constraints to market growth. Geographic expansion, particularly in rapidly developing economies of Asia-Pacific and South America, offers significant opportunities for market players.
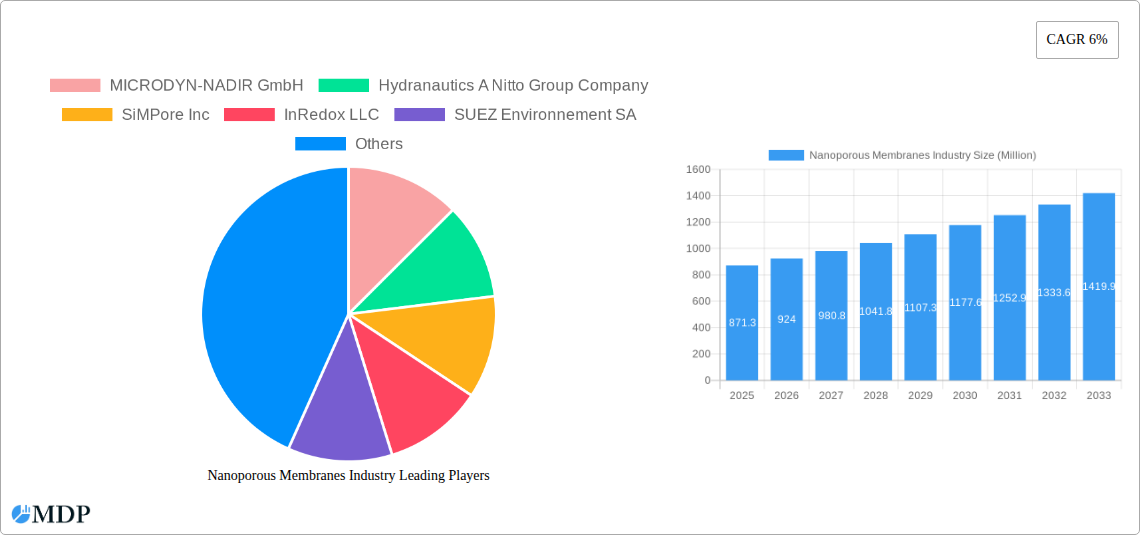
Nanoporous Membranes Industry Market Size (In Million)
The competitive landscape is characterized by a mix of established multinational corporations and specialized smaller companies. Major players, including MICRODYN-NADIR GmbH, Hydranautics, and Koch Membrane Systems, are actively engaged in research and development to enhance membrane performance and expand their product portfolios. Strategic partnerships, mergers, and acquisitions are likely to shape the market dynamics in the coming years. The forecast period (2025-2033) is anticipated to witness significant technological advancements, leading to improved membrane selectivity, permeability, and durability. This will further stimulate market growth, particularly in niche applications such as food processing and specialized industrial processes. Successful market players will need to focus on innovation, cost optimization, and strategic partnerships to thrive in this dynamic and rapidly evolving landscape.
Nanoporous Membranes Industry Company Market Share
Deep Dive into the Nanoporous Membranes Industry: A Comprehensive Market Report (2019-2033)
This comprehensive report provides an in-depth analysis of the global nanoporous membranes market, offering invaluable insights for industry stakeholders, investors, and researchers. Spanning the period from 2019 to 2033, with a focus on 2025, this study meticulously examines market dynamics, trends, leading players, and future growth potential. The market is projected to reach xx Million by 2033, exhibiting a CAGR of xx% during the forecast period (2025-2033).
Nanoporous Membranes Industry Market Dynamics & Concentration
The nanoporous membranes market is characterized by a moderately concentrated landscape, with key players vying for market share through innovation, strategic acquisitions, and expanding product portfolios. Market concentration is influenced by factors such as technological advancements, regulatory compliance, and the growing demand across diverse applications. The estimated market share held by the top five players in 2025 is approximately xx%.
- Innovation Drivers: Significant advancements in nanomaterials, membrane fabrication techniques (e.g., electrospinning, phase inversion), and surface modifications are driving market expansion.
- Regulatory Frameworks: Stringent environmental regulations, particularly concerning water purification and industrial emissions, are creating a favorable environment for nanoporous membrane adoption.
- Product Substitutes: While alternative filtration technologies exist, nanoporous membranes offer superior performance in terms of selectivity, permeability, and fouling resistance, limiting the impact of substitutes.
- End-User Trends: The increasing demand for clean water, energy-efficient processes, and advanced medical technologies fuels market growth across diverse sectors.
- M&A Activities: The number of mergers and acquisitions in the nanoporous membranes industry during the historical period (2019-2024) totaled approximately xx deals, signifying consolidation and expansion efforts by major players.
Nanoporous Membranes Industry Industry Trends & Analysis
The nanoporous membranes market is experiencing robust growth, driven by several key factors. Technological advancements, such as the development of advanced materials and fabrication techniques, are improving membrane performance and expanding application possibilities. Consumer preferences are shifting towards sustainable and efficient solutions, further bolstering market demand. The competitive landscape is dynamic, with companies continuously innovating and expanding their product offerings to cater to the evolving needs of diverse end-users. The market exhibits a strong correlation with global industrial output and infrastructure development. The market penetration rate for nanoporous membranes in water treatment applications exceeded xx% in 2025, indicating substantial adoption.
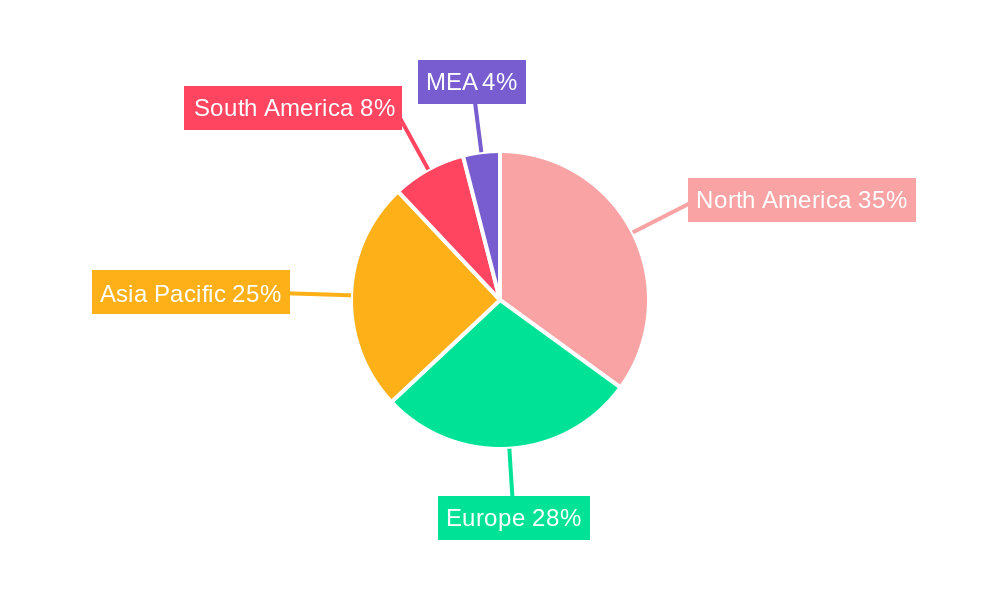
Leading Markets & Segments in Nanoporous Membranes Industry
The water treatment application segment dominates the nanoporous membranes market, accounting for approximately xx% of the total market value in 2025. Asia Pacific is projected to be the leading regional market, fueled by robust economic growth, industrialization, and increasing investments in infrastructure development.
Key Drivers by Segment:
- Water Treatment: Growing concerns about water scarcity and stringent regulations are driving significant demand.
- Fuel Cells: The rising adoption of fuel cell technology in transportation and stationary power generation is fostering market growth.
- Biomedical: Nanoporous membranes are integral to various biomedical applications, including drug delivery, diagnostics, and tissue engineering.
- Food Processing: The demand for high-quality, safe food products is driving the adoption of nanoporous membranes in food processing and packaging.
Regional Dominance Analysis:
Asia Pacific’s dominance is attributed to factors such as rapid industrialization, increasing disposable incomes, and government initiatives promoting clean water access. North America and Europe also exhibit significant market potential, driven by technological advancements and stringent environmental regulations.
Nanoporous Membranes Industry Product Developments
Recent product developments focus on enhancing membrane performance, durability, and selectivity. Innovations in material science, including the integration of carbon nanotubes and graphene, are improving permeability and fouling resistance. Furthermore, advanced manufacturing techniques are enabling the production of highly customized membranes tailored to specific application requirements. These advancements are driving market expansion and enhancing the competitiveness of nanoporous membrane technologies.
Key Drivers of Nanoporous Membranes Industry Growth
Several key factors drive the growth of the nanoporous membranes market:
- Technological Advancements: The continuous development of novel materials and fabrication techniques enhances membrane performance and expands applications.
- Economic Growth: Increasing industrialization and infrastructure development in emerging economies drive demand across various sectors.
- Stringent Environmental Regulations: Growing concerns about environmental pollution and resource scarcity necessitate advanced filtration solutions.
Challenges in the Nanoporous Membranes Industry Market
The nanoporous membranes market faces several challenges:
- High Manufacturing Costs: The production of advanced nanoporous membranes can be expensive, impacting market penetration.
- Supply Chain Disruptions: Global supply chain vulnerabilities can impact the availability of raw materials and manufacturing components.
- Intense Competition: The market is characterized by intense competition among established players and emerging entrants.
Emerging Opportunities in Nanoporous Membranes Industry
Significant opportunities exist for market expansion. Technological breakthroughs in membrane fabrication and material science are paving the way for higher-performance, more cost-effective membranes. Strategic partnerships between material scientists, membrane manufacturers, and end-users can unlock new applications and markets. The expansion into emerging economies presents substantial growth potential.
Leading Players in the Nanoporous Membranes Industry Sector
- MICRODYN-NADIR GmbH
- Hydranautics A Nitto Group Company
- SiMPore Inc
- InRedox LLC
- SUEZ Environnement SA
- Osmotech Membranes Pvt Ltd
- Hunan Keensen Technology Co Ltd
- Synder Filtration Inc
- AXEON Water Technologies Inc
- inopor GmbH
- BASF SE
- Toray Chemical Korea Inc
- DowDuPont Inc
- Koch Membrane Systems Inc
- SmartMembranes GmbH
- Applied Membranes Inc
- Alfa Laval AB
- Pure-Pro Water Corporation
Key Milestones in Nanoporous Membranes Industry Industry
- 2020: Launch of a new generation of high-flux nanoporous membranes by SiMPore Inc.
- 2022: Acquisition of a smaller membrane manufacturer by SUEZ Environnement SA.
- 2023: Introduction of a novel ceramic nanoporous membrane by Koch Membrane Systems Inc. (Further milestones to be added based on available data)
Strategic Outlook for Nanoporous Membranes Industry Market
The nanoporous membranes market holds significant future potential, driven by continuous technological advancements, expanding applications, and favorable regulatory environments. Strategic investments in R&D, strategic partnerships, and market expansion into high-growth regions will be crucial for companies seeking to capitalize on emerging opportunities. The market is poised for continued growth, with a strong emphasis on sustainability, efficiency, and performance enhancements.
Nanoporous Membranes Industry Segmentation
-
1. Material Type
- 1.1. Organic
- 1.2. Inorgani
- 1.3. Hybrid
-
2. Application
- 2.1. Water Treatment
- 2.2. Fuel Cells
- 2.3. Biomedical
- 2.4. Food Processing
- 2.5. Other Applications
Nanoporous Membranes Industry Segmentation By Geography
-
1. Asia Pacific
- 1.1. China
- 1.2. India
- 1.3. Japan
- 1.4. South Korea
- 1.5. ASEAN Countries
- 1.6. Rest of Asia Pacific
-
2. North America
- 2.1. United States
- 2.2. Canada
- 2.3. Rest of North America
-
3. Europe
- 3.1. Germany
- 3.2. United Kingdom
- 3.3. Italy
- 3.4. France
- 3.5. Spain
- 3.6. Rest of Europe
-
4. South America
- 4.1. Brazil
- 4.2. Argentina
- 4.3. Rest of South America
- 5. Middle East
-
6. Saudi Arabia
- 6.1. South Africa
- 6.2. Rest of Middle East
Nanoporous Membranes Industry Regional Market Share
Geographic Coverage of Nanoporous Membranes Industry
Nanoporous Membranes Industry REPORT HIGHLIGHTS
| Aspects | Details |
|---|---|
| Study Period | 2020-2034 |
| Base Year | 2025 |
| Estimated Year | 2026 |
| Forecast Period | 2026-2034 |
| Historical Period | 2020-2025 |
| Growth Rate | CAGR of 6% from 2020-2034 |
| Segmentation |
|
Table of Contents
- 1. Introduction
- 1.1. Research Scope
- 1.2. Market Segmentation
- 1.3. Research Objective
- 1.4. Definitions and Assumptions
- 2. Executive Summary
- 2.1. Market Snapshot
- 3. Market Dynamics
- 3.1. Market Drivers
- 3.2. Market Restrains
- 3.3. Market Trends
- 3.4. Market Opportunities
- 4. Market Factor Analysis
- 4.1. Porters Five Forces
- 4.1.1. Bargaining Power of Suppliers
- 4.1.2. Bargaining Power of Buyers
- 4.1.3. Threat of New Entrants
- 4.1.4. Threat of Substitutes
- 4.1.5. Competitive Rivalry
- 4.2. PESTEL analysis
- 4.3. BCG Analysis
- 4.3.1. Stars (High Growth, High Market Share)
- 4.3.2. Cash Cows (Low Growth, High Market Share)
- 4.3.3. Question Mark (High Growth, Low Market Share)
- 4.3.4. Dogs (Low Growth, Low Market Share)
- 4.4. Ansoff Matrix Analysis
- 4.5. Supply Chain Analysis
- 4.6. Regulatory Landscape
- 4.7. Current Market Potential and Opportunity Assessment (TAM–SAM–SOM Framework)
- 4.8. MDP Analyst Note
- 4.1. Porters Five Forces
- 5. Market Analysis, Insights and Forecast 2021-2033
- 5.1. Market Analysis, Insights and Forecast - by Material Type
- 5.1.1. Organic
- 5.1.2. Inorgani
- 5.1.3. Hybrid
- 5.2. Market Analysis, Insights and Forecast - by Application
- 5.2.1. Water Treatment
- 5.2.2. Fuel Cells
- 5.2.3. Biomedical
- 5.2.4. Food Processing
- 5.2.5. Other Applications
- 5.3. Market Analysis, Insights and Forecast - by Region
- 5.3.1. Asia Pacific
- 5.3.2. North America
- 5.3.3. Europe
- 5.3.4. South America
- 5.3.5. Middle East
- 5.3.6. Saudi Arabia
- 5.1. Market Analysis, Insights and Forecast - by Material Type
- 6. Global Nanoporous Membranes Industry Analysis, Insights and Forecast, 2021-2033
- 6.1. Market Analysis, Insights and Forecast - by Material Type
- 6.1.1. Organic
- 6.1.2. Inorgani
- 6.1.3. Hybrid
- 6.2. Market Analysis, Insights and Forecast - by Application
- 6.2.1. Water Treatment
- 6.2.2. Fuel Cells
- 6.2.3. Biomedical
- 6.2.4. Food Processing
- 6.2.5. Other Applications
- 6.1. Market Analysis, Insights and Forecast - by Material Type
- 7. Asia Pacific Nanoporous Membranes Industry Analysis, Insights and Forecast, 2020-2032
- 7.1. Market Analysis, Insights and Forecast - by Material Type
- 7.1.1. Organic
- 7.1.2. Inorgani
- 7.1.3. Hybrid
- 7.2. Market Analysis, Insights and Forecast - by Application
- 7.2.1. Water Treatment
- 7.2.2. Fuel Cells
- 7.2.3. Biomedical
- 7.2.4. Food Processing
- 7.2.5. Other Applications
- 7.1. Market Analysis, Insights and Forecast - by Material Type
- 8. North America Nanoporous Membranes Industry Analysis, Insights and Forecast, 2020-2032
- 8.1. Market Analysis, Insights and Forecast - by Material Type
- 8.1.1. Organic
- 8.1.2. Inorgani
- 8.1.3. Hybrid
- 8.2. Market Analysis, Insights and Forecast - by Application
- 8.2.1. Water Treatment
- 8.2.2. Fuel Cells
- 8.2.3. Biomedical
- 8.2.4. Food Processing
- 8.2.5. Other Applications
- 8.1. Market Analysis, Insights and Forecast - by Material Type
- 9. Europe Nanoporous Membranes Industry Analysis, Insights and Forecast, 2020-2032
- 9.1. Market Analysis, Insights and Forecast - by Material Type
- 9.1.1. Organic
- 9.1.2. Inorgani
- 9.1.3. Hybrid
- 9.2. Market Analysis, Insights and Forecast - by Application
- 9.2.1. Water Treatment
- 9.2.2. Fuel Cells
- 9.2.3. Biomedical
- 9.2.4. Food Processing
- 9.2.5. Other Applications
- 9.1. Market Analysis, Insights and Forecast - by Material Type
- 10. South America Nanoporous Membranes Industry Analysis, Insights and Forecast, 2020-2032
- 10.1. Market Analysis, Insights and Forecast - by Material Type
- 10.1.1. Organic
- 10.1.2. Inorgani
- 10.1.3. Hybrid
- 10.2. Market Analysis, Insights and Forecast - by Application
- 10.2.1. Water Treatment
- 10.2.2. Fuel Cells
- 10.2.3. Biomedical
- 10.2.4. Food Processing
- 10.2.5. Other Applications
- 10.1. Market Analysis, Insights and Forecast - by Material Type
- 11. Middle East Nanoporous Membranes Industry Analysis, Insights and Forecast, 2020-2032
- 11.1. Market Analysis, Insights and Forecast - by Material Type
- 11.1.1. Organic
- 11.1.2. Inorgani
- 11.1.3. Hybrid
- 11.2. Market Analysis, Insights and Forecast - by Application
- 11.2.1. Water Treatment
- 11.2.2. Fuel Cells
- 11.2.3. Biomedical
- 11.2.4. Food Processing
- 11.2.5. Other Applications
- 11.1. Market Analysis, Insights and Forecast - by Material Type
- 12. Saudi Arabia Nanoporous Membranes Industry Analysis, Insights and Forecast, 2020-2032
- 12.1. Market Analysis, Insights and Forecast - by Material Type
- 12.1.1. Organic
- 12.1.2. Inorgani
- 12.1.3. Hybrid
- 12.2. Market Analysis, Insights and Forecast - by Application
- 12.2.1. Water Treatment
- 12.2.2. Fuel Cells
- 12.2.3. Biomedical
- 12.2.4. Food Processing
- 12.2.5. Other Applications
- 12.1. Market Analysis, Insights and Forecast - by Material Type
- 13. Competitive Analysis
- 13.1. Company Profiles
- 13.1.1 MICRODYN-NADIR GmbH
- 13.1.1.1. Company Overview
- 13.1.1.2. Products
- 13.1.1.3. Company Financials
- 13.1.1.4. SWOT Analysis
- 13.1.2 Hydranautics A Nitto Group Company
- 13.1.2.1. Company Overview
- 13.1.2.2. Products
- 13.1.2.3. Company Financials
- 13.1.2.4. SWOT Analysis
- 13.1.3 SiMPore Inc
- 13.1.3.1. Company Overview
- 13.1.3.2. Products
- 13.1.3.3. Company Financials
- 13.1.3.4. SWOT Analysis
- 13.1.4 InRedox LLC
- 13.1.4.1. Company Overview
- 13.1.4.2. Products
- 13.1.4.3. Company Financials
- 13.1.4.4. SWOT Analysis
- 13.1.5 SUEZ Environnement SA
- 13.1.5.1. Company Overview
- 13.1.5.2. Products
- 13.1.5.3. Company Financials
- 13.1.5.4. SWOT Analysis
- 13.1.6 Osmotech Membranes Pvt Ltd
- 13.1.6.1. Company Overview
- 13.1.6.2. Products
- 13.1.6.3. Company Financials
- 13.1.6.4. SWOT Analysis
- 13.1.7 Hunan Keensen Technology Co Ltd
- 13.1.7.1. Company Overview
- 13.1.7.2. Products
- 13.1.7.3. Company Financials
- 13.1.7.4. SWOT Analysis
- 13.1.8 Synder Filtration Inc
- 13.1.8.1. Company Overview
- 13.1.8.2. Products
- 13.1.8.3. Company Financials
- 13.1.8.4. SWOT Analysis
- 13.1.9 AXEON Water Technologies Inc
- 13.1.9.1. Company Overview
- 13.1.9.2. Products
- 13.1.9.3. Company Financials
- 13.1.9.4. SWOT Analysis
- 13.1.10 inopor GmbH
- 13.1.10.1. Company Overview
- 13.1.10.2. Products
- 13.1.10.3. Company Financials
- 13.1.10.4. SWOT Analysis
- 13.1.11 BASF SE
- 13.1.11.1. Company Overview
- 13.1.11.2. Products
- 13.1.11.3. Company Financials
- 13.1.11.4. SWOT Analysis
- 13.1.12 Toray Chemical Korea Inc
- 13.1.12.1. Company Overview
- 13.1.12.2. Products
- 13.1.12.3. Company Financials
- 13.1.12.4. SWOT Analysis
- 13.1.13 DowDuPont Inc
- 13.1.13.1. Company Overview
- 13.1.13.2. Products
- 13.1.13.3. Company Financials
- 13.1.13.4. SWOT Analysis
- 13.1.14 Koch Membrane Systems Inc
- 13.1.14.1. Company Overview
- 13.1.14.2. Products
- 13.1.14.3. Company Financials
- 13.1.14.4. SWOT Analysis
- 13.1.15 SmartMembranes GmbH
- 13.1.15.1. Company Overview
- 13.1.15.2. Products
- 13.1.15.3. Company Financials
- 13.1.15.4. SWOT Analysis
- 13.1.16 Applied Membranes Inc
- 13.1.16.1. Company Overview
- 13.1.16.2. Products
- 13.1.16.3. Company Financials
- 13.1.16.4. SWOT Analysis
- 13.1.17 Alfa Laval AB
- 13.1.17.1. Company Overview
- 13.1.17.2. Products
- 13.1.17.3. Company Financials
- 13.1.17.4. SWOT Analysis
- 13.1.18 Pure-Pro Water Corporation
- 13.1.18.1. Company Overview
- 13.1.18.2. Products
- 13.1.18.3. Company Financials
- 13.1.18.4. SWOT Analysis
- 13.1.1 MICRODYN-NADIR GmbH
- 13.2. Market Entropy
- 13.2.1 Company's Key Areas Served
- 13.2.2 Recent Developments
- 13.3. Company Market Share Analysis 2025
- 13.3.1 Top 5 Companies Market Share Analysis
- 13.3.2 Top 3 Companies Market Share Analysis
- 13.4. List of Potential Customers
- 14. Research Methodology
List of Figures
- Figure 1: Global Nanoporous Membranes Industry Revenue Breakdown (Million, %) by Region 2025 & 2033
- Figure 2: Global Nanoporous Membranes Industry Volume Breakdown (K Units, %) by Region 2025 & 2033
- Figure 3: Asia Pacific Nanoporous Membranes Industry Revenue (Million), by Material Type 2025 & 2033
- Figure 4: Asia Pacific Nanoporous Membranes Industry Volume (K Units), by Material Type 2025 & 2033
- Figure 5: Asia Pacific Nanoporous Membranes Industry Revenue Share (%), by Material Type 2025 & 2033
- Figure 6: Asia Pacific Nanoporous Membranes Industry Volume Share (%), by Material Type 2025 & 2033
- Figure 7: Asia Pacific Nanoporous Membranes Industry Revenue (Million), by Application 2025 & 2033
- Figure 8: Asia Pacific Nanoporous Membranes Industry Volume (K Units), by Application 2025 & 2033
- Figure 9: Asia Pacific Nanoporous Membranes Industry Revenue Share (%), by Application 2025 & 2033
- Figure 10: Asia Pacific Nanoporous Membranes Industry Volume Share (%), by Application 2025 & 2033
- Figure 11: Asia Pacific Nanoporous Membranes Industry Revenue (Million), by Country 2025 & 2033
- Figure 12: Asia Pacific Nanoporous Membranes Industry Volume (K Units), by Country 2025 & 2033
- Figure 13: Asia Pacific Nanoporous Membranes Industry Revenue Share (%), by Country 2025 & 2033
- Figure 14: Asia Pacific Nanoporous Membranes Industry Volume Share (%), by Country 2025 & 2033
- Figure 15: North America Nanoporous Membranes Industry Revenue (Million), by Material Type 2025 & 2033
- Figure 16: North America Nanoporous Membranes Industry Volume (K Units), by Material Type 2025 & 2033
- Figure 17: North America Nanoporous Membranes Industry Revenue Share (%), by Material Type 2025 & 2033
- Figure 18: North America Nanoporous Membranes Industry Volume Share (%), by Material Type 2025 & 2033
- Figure 19: North America Nanoporous Membranes Industry Revenue (Million), by Application 2025 & 2033
- Figure 20: North America Nanoporous Membranes Industry Volume (K Units), by Application 2025 & 2033
- Figure 21: North America Nanoporous Membranes Industry Revenue Share (%), by Application 2025 & 2033
- Figure 22: North America Nanoporous Membranes Industry Volume Share (%), by Application 2025 & 2033
- Figure 23: North America Nanoporous Membranes Industry Revenue (Million), by Country 2025 & 2033
- Figure 24: North America Nanoporous Membranes Industry Volume (K Units), by Country 2025 & 2033
- Figure 25: North America Nanoporous Membranes Industry Revenue Share (%), by Country 2025 & 2033
- Figure 26: North America Nanoporous Membranes Industry Volume Share (%), by Country 2025 & 2033
- Figure 27: Europe Nanoporous Membranes Industry Revenue (Million), by Material Type 2025 & 2033
- Figure 28: Europe Nanoporous Membranes Industry Volume (K Units), by Material Type 2025 & 2033
- Figure 29: Europe Nanoporous Membranes Industry Revenue Share (%), by Material Type 2025 & 2033
- Figure 30: Europe Nanoporous Membranes Industry Volume Share (%), by Material Type 2025 & 2033
- Figure 31: Europe Nanoporous Membranes Industry Revenue (Million), by Application 2025 & 2033
- Figure 32: Europe Nanoporous Membranes Industry Volume (K Units), by Application 2025 & 2033
- Figure 33: Europe Nanoporous Membranes Industry Revenue Share (%), by Application 2025 & 2033
- Figure 34: Europe Nanoporous Membranes Industry Volume Share (%), by Application 2025 & 2033
- Figure 35: Europe Nanoporous Membranes Industry Revenue (Million), by Country 2025 & 2033
- Figure 36: Europe Nanoporous Membranes Industry Volume (K Units), by Country 2025 & 2033
- Figure 37: Europe Nanoporous Membranes Industry Revenue Share (%), by Country 2025 & 2033
- Figure 38: Europe Nanoporous Membranes Industry Volume Share (%), by Country 2025 & 2033
- Figure 39: South America Nanoporous Membranes Industry Revenue (Million), by Material Type 2025 & 2033
- Figure 40: South America Nanoporous Membranes Industry Volume (K Units), by Material Type 2025 & 2033
- Figure 41: South America Nanoporous Membranes Industry Revenue Share (%), by Material Type 2025 & 2033
- Figure 42: South America Nanoporous Membranes Industry Volume Share (%), by Material Type 2025 & 2033
- Figure 43: South America Nanoporous Membranes Industry Revenue (Million), by Application 2025 & 2033
- Figure 44: South America Nanoporous Membranes Industry Volume (K Units), by Application 2025 & 2033
- Figure 45: South America Nanoporous Membranes Industry Revenue Share (%), by Application 2025 & 2033
- Figure 46: South America Nanoporous Membranes Industry Volume Share (%), by Application 2025 & 2033
- Figure 47: South America Nanoporous Membranes Industry Revenue (Million), by Country 2025 & 2033
- Figure 48: South America Nanoporous Membranes Industry Volume (K Units), by Country 2025 & 2033
- Figure 49: South America Nanoporous Membranes Industry Revenue Share (%), by Country 2025 & 2033
- Figure 50: South America Nanoporous Membranes Industry Volume Share (%), by Country 2025 & 2033
- Figure 51: Middle East Nanoporous Membranes Industry Revenue (Million), by Material Type 2025 & 2033
- Figure 52: Middle East Nanoporous Membranes Industry Volume (K Units), by Material Type 2025 & 2033
- Figure 53: Middle East Nanoporous Membranes Industry Revenue Share (%), by Material Type 2025 & 2033
- Figure 54: Middle East Nanoporous Membranes Industry Volume Share (%), by Material Type 2025 & 2033
- Figure 55: Middle East Nanoporous Membranes Industry Revenue (Million), by Application 2025 & 2033
- Figure 56: Middle East Nanoporous Membranes Industry Volume (K Units), by Application 2025 & 2033
- Figure 57: Middle East Nanoporous Membranes Industry Revenue Share (%), by Application 2025 & 2033
- Figure 58: Middle East Nanoporous Membranes Industry Volume Share (%), by Application 2025 & 2033
- Figure 59: Middle East Nanoporous Membranes Industry Revenue (Million), by Country 2025 & 2033
- Figure 60: Middle East Nanoporous Membranes Industry Volume (K Units), by Country 2025 & 2033
- Figure 61: Middle East Nanoporous Membranes Industry Revenue Share (%), by Country 2025 & 2033
- Figure 62: Middle East Nanoporous Membranes Industry Volume Share (%), by Country 2025 & 2033
- Figure 63: Saudi Arabia Nanoporous Membranes Industry Revenue (Million), by Material Type 2025 & 2033
- Figure 64: Saudi Arabia Nanoporous Membranes Industry Volume (K Units), by Material Type 2025 & 2033
- Figure 65: Saudi Arabia Nanoporous Membranes Industry Revenue Share (%), by Material Type 2025 & 2033
- Figure 66: Saudi Arabia Nanoporous Membranes Industry Volume Share (%), by Material Type 2025 & 2033
- Figure 67: Saudi Arabia Nanoporous Membranes Industry Revenue (Million), by Application 2025 & 2033
- Figure 68: Saudi Arabia Nanoporous Membranes Industry Volume (K Units), by Application 2025 & 2033
- Figure 69: Saudi Arabia Nanoporous Membranes Industry Revenue Share (%), by Application 2025 & 2033
- Figure 70: Saudi Arabia Nanoporous Membranes Industry Volume Share (%), by Application 2025 & 2033
- Figure 71: Saudi Arabia Nanoporous Membranes Industry Revenue (Million), by Country 2025 & 2033
- Figure 72: Saudi Arabia Nanoporous Membranes Industry Volume (K Units), by Country 2025 & 2033
- Figure 73: Saudi Arabia Nanoporous Membranes Industry Revenue Share (%), by Country 2025 & 2033
- Figure 74: Saudi Arabia Nanoporous Membranes Industry Volume Share (%), by Country 2025 & 2033
List of Tables
- Table 1: Global Nanoporous Membranes Industry Revenue Million Forecast, by Material Type 2020 & 2033
- Table 2: Global Nanoporous Membranes Industry Volume K Units Forecast, by Material Type 2020 & 2033
- Table 3: Global Nanoporous Membranes Industry Revenue Million Forecast, by Application 2020 & 2033
- Table 4: Global Nanoporous Membranes Industry Volume K Units Forecast, by Application 2020 & 2033
- Table 5: Global Nanoporous Membranes Industry Revenue Million Forecast, by Region 2020 & 2033
- Table 6: Global Nanoporous Membranes Industry Volume K Units Forecast, by Region 2020 & 2033
- Table 7: Global Nanoporous Membranes Industry Revenue Million Forecast, by Material Type 2020 & 2033
- Table 8: Global Nanoporous Membranes Industry Volume K Units Forecast, by Material Type 2020 & 2033
- Table 9: Global Nanoporous Membranes Industry Revenue Million Forecast, by Application 2020 & 2033
- Table 10: Global Nanoporous Membranes Industry Volume K Units Forecast, by Application 2020 & 2033
- Table 11: Global Nanoporous Membranes Industry Revenue Million Forecast, by Country 2020 & 2033
- Table 12: Global Nanoporous Membranes Industry Volume K Units Forecast, by Country 2020 & 2033
- Table 13: China Nanoporous Membranes Industry Revenue (Million) Forecast, by Application 2020 & 2033
- Table 14: China Nanoporous Membranes Industry Volume (K Units) Forecast, by Application 2020 & 2033
- Table 15: India Nanoporous Membranes Industry Revenue (Million) Forecast, by Application 2020 & 2033
- Table 16: India Nanoporous Membranes Industry Volume (K Units) Forecast, by Application 2020 & 2033
- Table 17: Japan Nanoporous Membranes Industry Revenue (Million) Forecast, by Application 2020 & 2033
- Table 18: Japan Nanoporous Membranes Industry Volume (K Units) Forecast, by Application 2020 & 2033
- Table 19: South Korea Nanoporous Membranes Industry Revenue (Million) Forecast, by Application 2020 & 2033
- Table 20: South Korea Nanoporous Membranes Industry Volume (K Units) Forecast, by Application 2020 & 2033
- Table 21: ASEAN Countries Nanoporous Membranes Industry Revenue (Million) Forecast, by Application 2020 & 2033
- Table 22: ASEAN Countries Nanoporous Membranes Industry Volume (K Units) Forecast, by Application 2020 & 2033
- Table 23: Rest of Asia Pacific Nanoporous Membranes Industry Revenue (Million) Forecast, by Application 2020 & 2033
- Table 24: Rest of Asia Pacific Nanoporous Membranes Industry Volume (K Units) Forecast, by Application 2020 & 2033
- Table 25: Global Nanoporous Membranes Industry Revenue Million Forecast, by Material Type 2020 & 2033
- Table 26: Global Nanoporous Membranes Industry Volume K Units Forecast, by Material Type 2020 & 2033
- Table 27: Global Nanoporous Membranes Industry Revenue Million Forecast, by Application 2020 & 2033
- Table 28: Global Nanoporous Membranes Industry Volume K Units Forecast, by Application 2020 & 2033
- Table 29: Global Nanoporous Membranes Industry Revenue Million Forecast, by Country 2020 & 2033
- Table 30: Global Nanoporous Membranes Industry Volume K Units Forecast, by Country 2020 & 2033
- Table 31: United States Nanoporous Membranes Industry Revenue (Million) Forecast, by Application 2020 & 2033
- Table 32: United States Nanoporous Membranes Industry Volume (K Units) Forecast, by Application 2020 & 2033
- Table 33: Canada Nanoporous Membranes Industry Revenue (Million) Forecast, by Application 2020 & 2033
- Table 34: Canada Nanoporous Membranes Industry Volume (K Units) Forecast, by Application 2020 & 2033
- Table 35: Rest of North America Nanoporous Membranes Industry Revenue (Million) Forecast, by Application 2020 & 2033
- Table 36: Rest of North America Nanoporous Membranes Industry Volume (K Units) Forecast, by Application 2020 & 2033
- Table 37: Global Nanoporous Membranes Industry Revenue Million Forecast, by Material Type 2020 & 2033
- Table 38: Global Nanoporous Membranes Industry Volume K Units Forecast, by Material Type 2020 & 2033
- Table 39: Global Nanoporous Membranes Industry Revenue Million Forecast, by Application 2020 & 2033
- Table 40: Global Nanoporous Membranes Industry Volume K Units Forecast, by Application 2020 & 2033
- Table 41: Global Nanoporous Membranes Industry Revenue Million Forecast, by Country 2020 & 2033
- Table 42: Global Nanoporous Membranes Industry Volume K Units Forecast, by Country 2020 & 2033
- Table 43: Germany Nanoporous Membranes Industry Revenue (Million) Forecast, by Application 2020 & 2033
- Table 44: Germany Nanoporous Membranes Industry Volume (K Units) Forecast, by Application 2020 & 2033
- Table 45: United Kingdom Nanoporous Membranes Industry Revenue (Million) Forecast, by Application 2020 & 2033
- Table 46: United Kingdom Nanoporous Membranes Industry Volume (K Units) Forecast, by Application 2020 & 2033
- Table 47: Italy Nanoporous Membranes Industry Revenue (Million) Forecast, by Application 2020 & 2033
- Table 48: Italy Nanoporous Membranes Industry Volume (K Units) Forecast, by Application 2020 & 2033
- Table 49: France Nanoporous Membranes Industry Revenue (Million) Forecast, by Application 2020 & 2033
- Table 50: France Nanoporous Membranes Industry Volume (K Units) Forecast, by Application 2020 & 2033
- Table 51: Spain Nanoporous Membranes Industry Revenue (Million) Forecast, by Application 2020 & 2033
- Table 52: Spain Nanoporous Membranes Industry Volume (K Units) Forecast, by Application 2020 & 2033
- Table 53: Rest of Europe Nanoporous Membranes Industry Revenue (Million) Forecast, by Application 2020 & 2033
- Table 54: Rest of Europe Nanoporous Membranes Industry Volume (K Units) Forecast, by Application 2020 & 2033
- Table 55: Global Nanoporous Membranes Industry Revenue Million Forecast, by Material Type 2020 & 2033
- Table 56: Global Nanoporous Membranes Industry Volume K Units Forecast, by Material Type 2020 & 2033
- Table 57: Global Nanoporous Membranes Industry Revenue Million Forecast, by Application 2020 & 2033
- Table 58: Global Nanoporous Membranes Industry Volume K Units Forecast, by Application 2020 & 2033
- Table 59: Global Nanoporous Membranes Industry Revenue Million Forecast, by Country 2020 & 2033
- Table 60: Global Nanoporous Membranes Industry Volume K Units Forecast, by Country 2020 & 2033
- Table 61: Brazil Nanoporous Membranes Industry Revenue (Million) Forecast, by Application 2020 & 2033
- Table 62: Brazil Nanoporous Membranes Industry Volume (K Units) Forecast, by Application 2020 & 2033
- Table 63: Argentina Nanoporous Membranes Industry Revenue (Million) Forecast, by Application 2020 & 2033
- Table 64: Argentina Nanoporous Membranes Industry Volume (K Units) Forecast, by Application 2020 & 2033
- Table 65: Rest of South America Nanoporous Membranes Industry Revenue (Million) Forecast, by Application 2020 & 2033
- Table 66: Rest of South America Nanoporous Membranes Industry Volume (K Units) Forecast, by Application 2020 & 2033
- Table 67: Global Nanoporous Membranes Industry Revenue Million Forecast, by Material Type 2020 & 2033
- Table 68: Global Nanoporous Membranes Industry Volume K Units Forecast, by Material Type 2020 & 2033
- Table 69: Global Nanoporous Membranes Industry Revenue Million Forecast, by Application 2020 & 2033
- Table 70: Global Nanoporous Membranes Industry Volume K Units Forecast, by Application 2020 & 2033
- Table 71: Global Nanoporous Membranes Industry Revenue Million Forecast, by Country 2020 & 2033
- Table 72: Global Nanoporous Membranes Industry Volume K Units Forecast, by Country 2020 & 2033
- Table 73: Global Nanoporous Membranes Industry Revenue Million Forecast, by Material Type 2020 & 2033
- Table 74: Global Nanoporous Membranes Industry Volume K Units Forecast, by Material Type 2020 & 2033
- Table 75: Global Nanoporous Membranes Industry Revenue Million Forecast, by Application 2020 & 2033
- Table 76: Global Nanoporous Membranes Industry Volume K Units Forecast, by Application 2020 & 2033
- Table 77: Global Nanoporous Membranes Industry Revenue Million Forecast, by Country 2020 & 2033
- Table 78: Global Nanoporous Membranes Industry Volume K Units Forecast, by Country 2020 & 2033
- Table 79: South Africa Nanoporous Membranes Industry Revenue (Million) Forecast, by Application 2020 & 2033
- Table 80: South Africa Nanoporous Membranes Industry Volume (K Units) Forecast, by Application 2020 & 2033
- Table 81: Rest of Middle East Nanoporous Membranes Industry Revenue (Million) Forecast, by Application 2020 & 2033
- Table 82: Rest of Middle East Nanoporous Membranes Industry Volume (K Units) Forecast, by Application 2020 & 2033
Frequently Asked Questions
1. What is the projected Compound Annual Growth Rate (CAGR) of the Nanoporous Membranes Industry?
The projected CAGR is approximately 6%.
2. Which companies are prominent players in the Nanoporous Membranes Industry?
Key companies in the market include MICRODYN-NADIR GmbH, Hydranautics A Nitto Group Company, SiMPore Inc, InRedox LLC, SUEZ Environnement SA, Osmotech Membranes Pvt Ltd, Hunan Keensen Technology Co Ltd, Synder Filtration Inc, AXEON Water Technologies Inc, inopor GmbH, BASF SE, Toray Chemical Korea Inc, DowDuPont Inc, Koch Membrane Systems Inc, SmartMembranes GmbH, Applied Membranes Inc, Alfa Laval AB, Pure-Pro Water Corporation.
3. What are the main segments of the Nanoporous Membranes Industry?
The market segments include Material Type, Application.
4. Can you provide details about the market size?
The market size is estimated to be USD 871.3 Million as of 2022.
5. What are some drivers contributing to market growth?
; Growing Need to Treat Wastewater; Rising Water Desalination Activities.
6. What are the notable trends driving market growth?
Growing Demand from Water Treatment Application.
7. Are there any restraints impacting market growth?
; Low Adoption in the Developing Countries; Poor Fouling Resistance of Nanoporous Membranes; Supply Deficiency of Nanomaterials.
8. Can you provide examples of recent developments in the market?
N/A
9. What pricing options are available for accessing the report?
Pricing options include single-user, multi-user, and enterprise licenses priced at USD 4750, USD 5250, and USD 8750 respectively.
10. Is the market size provided in terms of value or volume?
The market size is provided in terms of value, measured in Million and volume, measured in K Units.
11. Are there any specific market keywords associated with the report?
Yes, the market keyword associated with the report is "Nanoporous Membranes Industry," which aids in identifying and referencing the specific market segment covered.
12. How do I determine which pricing option suits my needs best?
The pricing options vary based on user requirements and access needs. Individual users may opt for single-user licenses, while businesses requiring broader access may choose multi-user or enterprise licenses for cost-effective access to the report.
13. Are there any additional resources or data provided in the Nanoporous Membranes Industry report?
While the report offers comprehensive insights, it's advisable to review the specific contents or supplementary materials provided to ascertain if additional resources or data are available.
14. How can I stay updated on further developments or reports in the Nanoporous Membranes Industry?
To stay informed about further developments, trends, and reports in the Nanoporous Membranes Industry, consider subscribing to industry newsletters, following relevant companies and organizations, or regularly checking reputable industry news sources and publications.
Methodology
Step 1 - Identification of Relevant Samples Size from Population Database


Step 2 - Approaches for Defining Global Market Size (Value, Volume* & Price*)

Note*: In applicable scenarios
Step 3 - Data Sources
Primary Research
- Web Analytics
- Survey Reports
- Research Institute
- Latest Research Reports
- Opinion Leaders
Secondary Research
- Annual Reports
- White Paper
- Latest Press Release
- Industry Association
- Paid Database
- Investor Presentations

Step 4 - Data Triangulation
Involves using different sources of information in order to increase the validity of a study
These sources are likely to be stakeholders in a program - participants, other researchers, program staff, other community members, and so on.
Then we put all data in single framework & apply various statistical tools to find out the dynamic on the market.
During the analysis stage, feedback from the stakeholder groups would be compared to determine areas of agreement as well as areas of divergence