

Key Insights
The global nano paints and coatings market is experiencing robust growth, driven by increasing demand across diverse sectors. The market's Compound Annual Growth Rate (CAGR) exceeding 4% signifies a consistently expanding market size, projected to reach significant value over the forecast period (2025-2033). Key drivers include the enhanced performance characteristics of nano paints and coatings, such as improved durability, scratch resistance, and antimicrobial properties. These advantages are particularly attractive to industries like aerospace and defense, where lightweight, high-performance materials are crucial. Furthermore, the growing focus on sustainability is fueling adoption, with nano-coatings offering solutions for energy efficiency and reduced environmental impact. Technological advancements in nano-material synthesis and application methods, such as electrospinning and CVD, are further accelerating market expansion. While the market faces certain restraints, like the relatively high cost of nano-materials and potential health and safety concerns, the overall growth trajectory remains positive, bolstered by continuous innovation and broadening applications across various end-use industries.
Segment-wise, the market shows strong performance across various resin types, including graphene, carbon nanotubes, and nano-SiO2, each offering unique properties for specific applications. Similarly, different application methods cater to diverse needs, with electrospray and chemical vapor deposition witnessing increased demand. Regionally, North America and Europe currently hold significant market shares due to established industries and early adoption. However, the Asia-Pacific region is expected to exhibit considerable growth potential, fueled by rapid industrialization and expanding infrastructure development in countries like China and India. The presence of key players such as Henkel AG & Co KGaA, Evonik Industries AG, and PPG Industries Inc. is indicative of the market’s maturity and competitive landscape, further driving innovation and market expansion. The forecast period (2025-2033) offers substantial opportunities for growth within this dynamic and evolving market, promising significant returns on investment for stakeholders.
Nano Paints & Coatings Industry: A Comprehensive Market Report (2019-2033)
This comprehensive report provides an in-depth analysis of the global nano paints & coatings industry, offering invaluable insights for stakeholders seeking to navigate this rapidly evolving market. With a study period spanning 2019-2033, a base year of 2025, and a forecast period of 2025-2033, this report leverages extensive data analysis to provide actionable intelligence. Key market segments, leading players like Henkel AG & Co KGaA, PPG Industries Inc, and Evonik Industries AG, and emerging trends are thoroughly examined. The report’s findings are crucial for informed decision-making, strategic planning, and investment strategies within the nano paints and coatings sector. Download now to unlock a wealth of data and projections valued at Millions.
Nano Paints & Coatings Industry Market Dynamics & Concentration
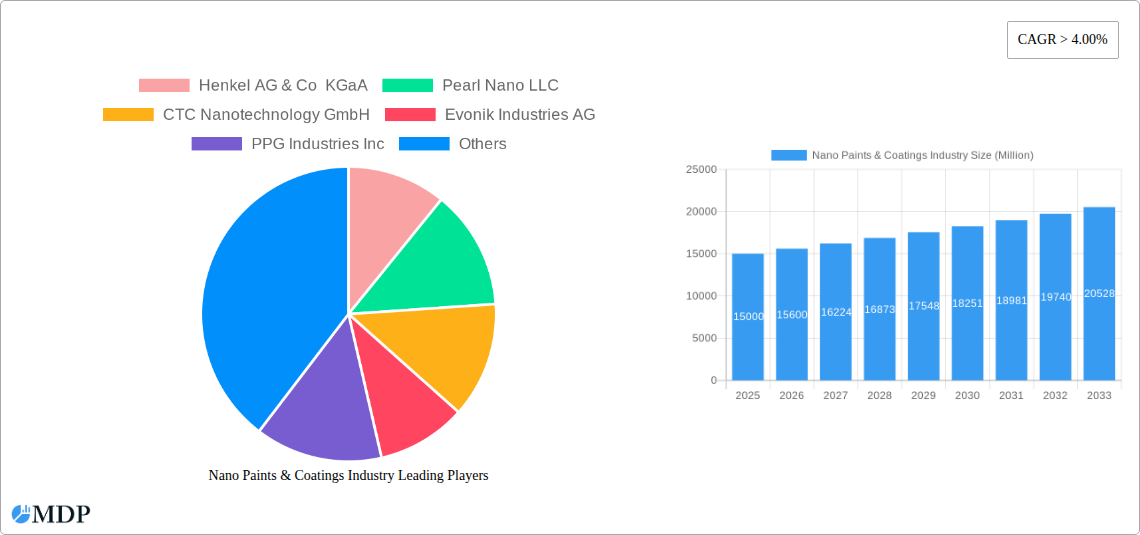
The global nano paints & coatings market, valued at $XX Million in 2024, is experiencing significant growth driven by advancements in nanotechnology and increasing demand across diverse end-user industries. Market concentration is moderate, with several key players holding significant market share, but also witnessing a rise of smaller, specialized companies.
- Market Share: Henkel AG & Co KGaA and PPG Industries Inc hold a combined market share of approximately 30%, while other players such as Evonik Industries AG and CTC Nanotechnology GmbH contribute substantially to the remaining share.
- Innovation Drivers: Continuous R&D efforts focus on developing novel nano-materials with enhanced properties like superior durability, self-cleaning capabilities, and improved corrosion resistance.
- Regulatory Frameworks: Stringent environmental regulations concerning VOC emissions are driving the adoption of eco-friendly nano-coatings. Varying regional regulations impact market dynamics.
- Product Substitutes: Traditional paints and coatings remain competitive, but the superior performance of nano-coatings is gradually shifting market share.
- End-User Trends: The increasing demand for lightweight, high-performance materials in automotive, aerospace, and electronics industries fuels market growth.
- M&A Activities: The number of M&A deals in the sector has increased in recent years, reflecting the consolidation trend and strategic expansion efforts by major players. A total of XX M&A deals were recorded between 2019 and 2024, with an anticipated XX deals projected for 2025-2033.
Nano Paints & Coatings Industry Industry Trends & Analysis
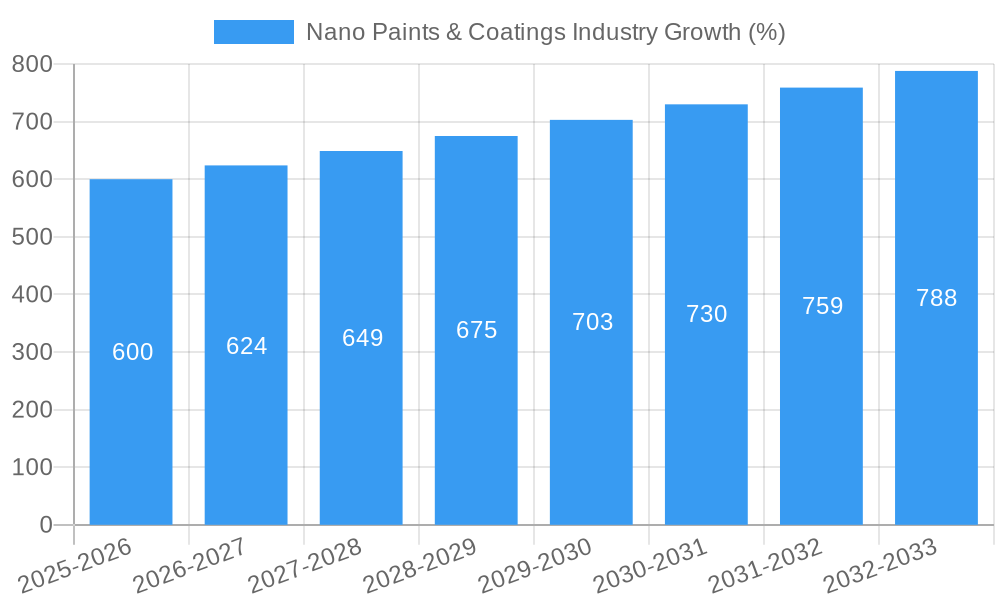
The nano paints & coatings industry is characterized by a robust CAGR of XX% during the forecast period (2025-2033). This growth is propelled by several factors:
Technological advancements leading to improved product performance, including enhanced durability, scratch resistance, and UV protection, are key drivers. The market penetration of nano-coatings is increasing steadily, particularly in niche applications requiring specialized properties. Consumer preference shifts towards sustainable and environmentally friendly products are also influencing market growth. Intense competition among existing players and the entry of new companies fuel innovation and drive prices down, further accelerating market expansion. Specific applications, such as self-healing coatings and antimicrobial coatings, are emerging as significant growth areas.
Leading Markets & Segments in Nano Paints & Coatings Industry
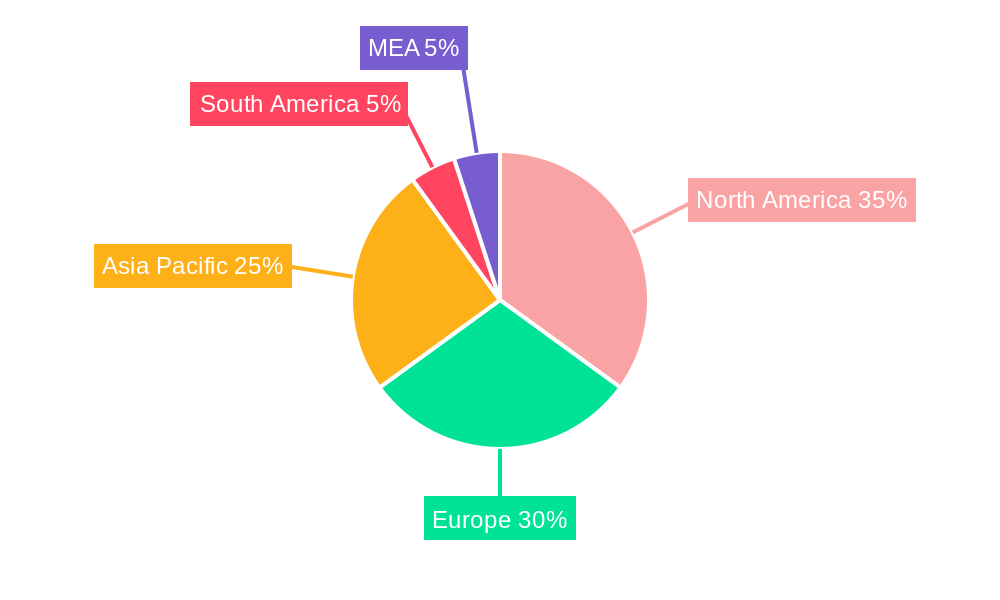
The Asia Pacific region is projected to dominate the nano paints & coatings market during the forecast period, driven by rapid industrialization and infrastructural development in countries like China and India.
Key Drivers by Region:
- Asia Pacific: Rapid industrialization, increasing disposable income, and government support for technological advancements.
- North America: High adoption in aerospace and automotive industries, coupled with strong R&D efforts.
- Europe: Stringent environmental regulations driving demand for eco-friendly coatings.
Dominant Segments:
- Resin Type: Nano-TiO2 (Titanium Dioxide) currently holds the largest market share, followed by Nano-SiO2 (Silicon Dioxide) due to their wide applicability and cost-effectiveness.
- Method: Sol-gel and Chemical Vapor Deposition (CVD) methods are widely adopted due to their versatility and suitability for different applications.
- End-user Industry: The automotive industry represents a significant segment, followed by the aerospace & defense and electronics & optics sectors. The biomedical sector is showing significant potential for future growth.
Nano Paints & Coatings Industry Product Developments
Recent product innovations include self-cleaning coatings, anti-fouling coatings, and coatings with enhanced UV resistance and thermal conductivity. These advancements cater to specific application needs across various end-user industries, providing competitive advantages through improved performance, durability, and sustainability. The focus remains on developing coatings with enhanced functionalities and reduced environmental impact.
Key Drivers of Nano Paints & Coatings Industry Growth
The industry's growth is primarily driven by advancements in nanotechnology, enabling the development of superior coatings with enhanced properties. Economic growth in key markets, particularly in developing economies, fuels demand for high-performance materials. Favorable government policies and regulations promoting sustainable technologies further accelerate market expansion.
Challenges in the Nano Paints & Coatings Industry Market
Regulatory hurdles related to the safety and environmental impact of nanomaterials pose a challenge. Supply chain complexities in sourcing raw materials and ensuring consistent quality can affect production and costs. Intense competition from established paint and coating manufacturers also creates pressure on prices and profit margins. This is estimated to impact the market by approximately XX Million by 2033.
Emerging Opportunities in Nano Paints & Coatings Industry
Technological breakthroughs in areas like graphene-based coatings and bio-inspired coatings promise to unlock new applications and enhance product performance. Strategic partnerships between nano-material manufacturers and end-user companies are expected to drive market expansion. Expanding into new and emerging markets presents substantial opportunities for growth.
Leading Players in the Nano Paints & Coatings Industry Sector
- Henkel AG & Co KGaA
- Pearl Nano LLC
- CTC Nanotechnology GmbH
- Evonik Industries AG
- PPG Industries Inc
- NanoShine Ltd
- Starshield Technologies Pvt Ltd
- icannanopaints.com (Innovation Center for Applied Nanotechnology)
- Nano-Z Coating Ltd
- Nanovere Technologies LLC
- Artekya Teknoloji
Key Milestones in Nano Paints & Coatings Industry Industry
- 2020: Launch of a new self-cleaning nano-coating by PPG Industries Inc.
- 2021: Acquisition of a smaller nano-coating company by Henkel AG & Co KGaA.
- 2022: Introduction of graphene-enhanced coatings by Evonik Industries AG.
- 2023: Development of a new eco-friendly nano-coating by CTC Nanotechnology GmbH.
- 2024: Significant investments in R&D by multiple companies focused on sustainable and high-performance nano-coatings.
Strategic Outlook for Nano Paints & Coatings Industry Market
The nano paints & coatings market is poised for sustained growth, driven by continuous technological innovation and expanding applications across diverse industries. Strategic partnerships, focused R&D efforts, and expansion into new markets will be critical for companies to capture significant market share and drive long-term success. The market is projected to reach $XX Million by 2033, representing substantial growth potential for both established players and emerging companies.
Nano Paints & Coatings Industry Segmentation
-
1. Resin Type
- 1.1. Graphene
- 1.2. Carbon Nanotubes
- 1.3. Nano-SiO2 (Silicon Dioxide)
- 1.4. Nano Silver
- 1.5. Nano-TiO2 (Titanium Dioxide)
- 1.6. Nano-ZNO
-
2. Method
- 2.1. Electrospray and Electro Spinning
- 2.2. Chemical Vapor Deposition (CVD)
- 2.3. Physical Vapor Deposition (PVD)
- 2.4. Atomic Layer Deposition (ALD)
- 2.5. Aerosol Coating
- 2.6. Self-assembly
- 2.7. Sol-gel
-
3. End-user Industry
- 3.1. Biomedical
- 3.2. Food & Packaging
- 3.3. Aerospace & Defense
- 3.4. Marine
- 3.5. Electronics & Optics
- 3.6. Automobile
- 3.7. Oil & Gas
- 3.8. Others
Nano Paints & Coatings Industry Segmentation By Geography
-
1. Asia Pacific
- 1.1. China
- 1.2. India
- 1.3. Japan
- 1.4. South Korea
- 1.5. Rest of Asia Pacific
-
2. North America
- 2.1. United States
- 2.2. Canada
- 2.3. Mexico
-
3. Europe
- 3.1. Germany
- 3.2. United Kingdom
- 3.3. Italy
- 3.4. France
- 3.5. Rest of Europe
-
4. Rest of the World
- 4.1. South America
- 4.2. Middle East
Nano Paints & Coatings Industry REPORT HIGHLIGHTS
| Aspects | Details |
|---|---|
| Study Period | 2019-2033 |
| Base Year | 2024 |
| Estimated Year | 2025 |
| Forecast Period | 2025-2033 |
| Historical Period | 2019-2024 |
| Growth Rate | CAGR of > 4.00% from 2019-2033 |
| Segmentation |
|
Table of Contents
- 1. Introduction
- 1.1. Research Scope
- 1.2. Market Segmentation
- 1.3. Research Methodology
- 1.4. Definitions and Assumptions
- 2. Executive Summary
- 2.1. Introduction
- 3. Market Dynamics
- 3.1. Introduction
- 3.2. Market Drivers
- 3.2.1. ; Growing Demand from the Aerospace & Defense Industry; Other Drivers
- 3.3. Market Restrains
- 3.3.1. ; High Price Bar of Conductive Textile Made Products; Other Restraints
- 3.4. Market Trends
- 3.4.1. Graphene to Dominate the Market
- 4. Market Factor Analysis
- 4.1. Porters Five Forces
- 4.2. Supply/Value Chain
- 4.3. PESTEL analysis
- 4.4. Market Entropy
- 4.5. Patent/Trademark Analysis
- 5. Global Nano Paints & Coatings Industry Analysis, Insights and Forecast, 2019-2031
- 5.1. Market Analysis, Insights and Forecast - by Resin Type
- 5.1.1. Graphene
- 5.1.2. Carbon Nanotubes
- 5.1.3. Nano-SiO2 (Silicon Dioxide)
- 5.1.4. Nano Silver
- 5.1.5. Nano-TiO2 (Titanium Dioxide)
- 5.1.6. Nano-ZNO
- 5.2. Market Analysis, Insights and Forecast - by Method
- 5.2.1. Electrospray and Electro Spinning
- 5.2.2. Chemical Vapor Deposition (CVD)
- 5.2.3. Physical Vapor Deposition (PVD)
- 5.2.4. Atomic Layer Deposition (ALD)
- 5.2.5. Aerosol Coating
- 5.2.6. Self-assembly
- 5.2.7. Sol-gel
- 5.3. Market Analysis, Insights and Forecast - by End-user Industry
- 5.3.1. Biomedical
- 5.3.2. Food & Packaging
- 5.3.3. Aerospace & Defense
- 5.3.4. Marine
- 5.3.5. Electronics & Optics
- 5.3.6. Automobile
- 5.3.7. Oil & Gas
- 5.3.8. Others
- 5.4. Market Analysis, Insights and Forecast - by Region
- 5.4.1. Asia Pacific
- 5.4.2. North America
- 5.4.3. Europe
- 5.4.4. Rest of the World
- 5.1. Market Analysis, Insights and Forecast - by Resin Type
- 6. Asia Pacific Nano Paints & Coatings Industry Analysis, Insights and Forecast, 2019-2031
- 6.1. Market Analysis, Insights and Forecast - by Resin Type
- 6.1.1. Graphene
- 6.1.2. Carbon Nanotubes
- 6.1.3. Nano-SiO2 (Silicon Dioxide)
- 6.1.4. Nano Silver
- 6.1.5. Nano-TiO2 (Titanium Dioxide)
- 6.1.6. Nano-ZNO
- 6.2. Market Analysis, Insights and Forecast - by Method
- 6.2.1. Electrospray and Electro Spinning
- 6.2.2. Chemical Vapor Deposition (CVD)
- 6.2.3. Physical Vapor Deposition (PVD)
- 6.2.4. Atomic Layer Deposition (ALD)
- 6.2.5. Aerosol Coating
- 6.2.6. Self-assembly
- 6.2.7. Sol-gel
- 6.3. Market Analysis, Insights and Forecast - by End-user Industry
- 6.3.1. Biomedical
- 6.3.2. Food & Packaging
- 6.3.3. Aerospace & Defense
- 6.3.4. Marine
- 6.3.5. Electronics & Optics
- 6.3.6. Automobile
- 6.3.7. Oil & Gas
- 6.3.8. Others
- 6.1. Market Analysis, Insights and Forecast - by Resin Type
- 7. North America Nano Paints & Coatings Industry Analysis, Insights and Forecast, 2019-2031
- 7.1. Market Analysis, Insights and Forecast - by Resin Type
- 7.1.1. Graphene
- 7.1.2. Carbon Nanotubes
- 7.1.3. Nano-SiO2 (Silicon Dioxide)
- 7.1.4. Nano Silver
- 7.1.5. Nano-TiO2 (Titanium Dioxide)
- 7.1.6. Nano-ZNO
- 7.2. Market Analysis, Insights and Forecast - by Method
- 7.2.1. Electrospray and Electro Spinning
- 7.2.2. Chemical Vapor Deposition (CVD)
- 7.2.3. Physical Vapor Deposition (PVD)
- 7.2.4. Atomic Layer Deposition (ALD)
- 7.2.5. Aerosol Coating
- 7.2.6. Self-assembly
- 7.2.7. Sol-gel
- 7.3. Market Analysis, Insights and Forecast - by End-user Industry
- 7.3.1. Biomedical
- 7.3.2. Food & Packaging
- 7.3.3. Aerospace & Defense
- 7.3.4. Marine
- 7.3.5. Electronics & Optics
- 7.3.6. Automobile
- 7.3.7. Oil & Gas
- 7.3.8. Others
- 7.1. Market Analysis, Insights and Forecast - by Resin Type
- 8. Europe Nano Paints & Coatings Industry Analysis, Insights and Forecast, 2019-2031
- 8.1. Market Analysis, Insights and Forecast - by Resin Type
- 8.1.1. Graphene
- 8.1.2. Carbon Nanotubes
- 8.1.3. Nano-SiO2 (Silicon Dioxide)
- 8.1.4. Nano Silver
- 8.1.5. Nano-TiO2 (Titanium Dioxide)
- 8.1.6. Nano-ZNO
- 8.2. Market Analysis, Insights and Forecast - by Method
- 8.2.1. Electrospray and Electro Spinning
- 8.2.2. Chemical Vapor Deposition (CVD)
- 8.2.3. Physical Vapor Deposition (PVD)
- 8.2.4. Atomic Layer Deposition (ALD)
- 8.2.5. Aerosol Coating
- 8.2.6. Self-assembly
- 8.2.7. Sol-gel
- 8.3. Market Analysis, Insights and Forecast - by End-user Industry
- 8.3.1. Biomedical
- 8.3.2. Food & Packaging
- 8.3.3. Aerospace & Defense
- 8.3.4. Marine
- 8.3.5. Electronics & Optics
- 8.3.6. Automobile
- 8.3.7. Oil & Gas
- 8.3.8. Others
- 8.1. Market Analysis, Insights and Forecast - by Resin Type
- 9. Rest of the World Nano Paints & Coatings Industry Analysis, Insights and Forecast, 2019-2031
- 9.1. Market Analysis, Insights and Forecast - by Resin Type
- 9.1.1. Graphene
- 9.1.2. Carbon Nanotubes
- 9.1.3. Nano-SiO2 (Silicon Dioxide)
- 9.1.4. Nano Silver
- 9.1.5. Nano-TiO2 (Titanium Dioxide)
- 9.1.6. Nano-ZNO
- 9.2. Market Analysis, Insights and Forecast - by Method
- 9.2.1. Electrospray and Electro Spinning
- 9.2.2. Chemical Vapor Deposition (CVD)
- 9.2.3. Physical Vapor Deposition (PVD)
- 9.2.4. Atomic Layer Deposition (ALD)
- 9.2.5. Aerosol Coating
- 9.2.6. Self-assembly
- 9.2.7. Sol-gel
- 9.3. Market Analysis, Insights and Forecast - by End-user Industry
- 9.3.1. Biomedical
- 9.3.2. Food & Packaging
- 9.3.3. Aerospace & Defense
- 9.3.4. Marine
- 9.3.5. Electronics & Optics
- 9.3.6. Automobile
- 9.3.7. Oil & Gas
- 9.3.8. Others
- 9.1. Market Analysis, Insights and Forecast - by Resin Type
- 10. North America Nano Paints & Coatings Industry Analysis, Insights and Forecast, 2019-2031
- 10.1. Market Analysis, Insights and Forecast - By Country/Sub-region
- 10.1.1 United States
- 10.1.2 Canada
- 10.1.3 Mexico
- 11. Europe Nano Paints & Coatings Industry Analysis, Insights and Forecast, 2019-2031
- 11.1. Market Analysis, Insights and Forecast - By Country/Sub-region
- 11.1.1 Germany
- 11.1.2 United Kingdom
- 11.1.3 France
- 11.1.4 Spain
- 11.1.5 Italy
- 11.1.6 Spain
- 11.1.7 Belgium
- 11.1.8 Netherland
- 11.1.9 Nordics
- 11.1.10 Rest of Europe
- 12. Asia Pacific Nano Paints & Coatings Industry Analysis, Insights and Forecast, 2019-2031
- 12.1. Market Analysis, Insights and Forecast - By Country/Sub-region
- 12.1.1 China
- 12.1.2 Japan
- 12.1.3 India
- 12.1.4 South Korea
- 12.1.5 Southeast Asia
- 12.1.6 Australia
- 12.1.7 Indonesia
- 12.1.8 Phillipes
- 12.1.9 Singapore
- 12.1.10 Thailandc
- 12.1.11 Rest of Asia Pacific
- 13. South America Nano Paints & Coatings Industry Analysis, Insights and Forecast, 2019-2031
- 13.1. Market Analysis, Insights and Forecast - By Country/Sub-region
- 13.1.1 Brazil
- 13.1.2 Argentina
- 13.1.3 Peru
- 13.1.4 Chile
- 13.1.5 Colombia
- 13.1.6 Ecuador
- 13.1.7 Venezuela
- 13.1.8 Rest of South America
- 14. North America Nano Paints & Coatings Industry Analysis, Insights and Forecast, 2019-2031
- 14.1. Market Analysis, Insights and Forecast - By Country/Sub-region
- 14.1.1 United States
- 14.1.2 Canada
- 14.1.3 Mexico
- 15. MEA Nano Paints & Coatings Industry Analysis, Insights and Forecast, 2019-2031
- 15.1. Market Analysis, Insights and Forecast - By Country/Sub-region
- 15.1.1 United Arab Emirates
- 15.1.2 Saudi Arabia
- 15.1.3 South Africa
- 15.1.4 Rest of Middle East and Africa
- 16. Competitive Analysis
- 16.1. Global Market Share Analysis 2024
- 16.2. Company Profiles
- 16.2.1 Henkel AG & Co KGaA
- 16.2.1.1. Overview
- 16.2.1.2. Products
- 16.2.1.3. SWOT Analysis
- 16.2.1.4. Recent Developments
- 16.2.1.5. Financials (Based on Availability)
- 16.2.2 Pearl Nano LLC
- 16.2.2.1. Overview
- 16.2.2.2. Products
- 16.2.2.3. SWOT Analysis
- 16.2.2.4. Recent Developments
- 16.2.2.5. Financials (Based on Availability)
- 16.2.3 CTC Nanotechnology GmbH
- 16.2.3.1. Overview
- 16.2.3.2. Products
- 16.2.3.3. SWOT Analysis
- 16.2.3.4. Recent Developments
- 16.2.3.5. Financials (Based on Availability)
- 16.2.4 Evonik Industries AG
- 16.2.4.1. Overview
- 16.2.4.2. Products
- 16.2.4.3. SWOT Analysis
- 16.2.4.4. Recent Developments
- 16.2.4.5. Financials (Based on Availability)
- 16.2.5 PPG Industries Inc
- 16.2.5.1. Overview
- 16.2.5.2. Products
- 16.2.5.3. SWOT Analysis
- 16.2.5.4. Recent Developments
- 16.2.5.5. Financials (Based on Availability)
- 16.2.6 NanoShine Ltd
- 16.2.6.1. Overview
- 16.2.6.2. Products
- 16.2.6.3. SWOT Analysis
- 16.2.6.4. Recent Developments
- 16.2.6.5. Financials (Based on Availability)
- 16.2.7 Starshield Technologies Pvt Ltd*List Not Exhaustive
- 16.2.7.1. Overview
- 16.2.7.2. Products
- 16.2.7.3. SWOT Analysis
- 16.2.7.4. Recent Developments
- 16.2.7.5. Financials (Based on Availability)
- 16.2.8 icannanopaints com ( Innovation Center for Applied Nanotechnology)
- 16.2.8.1. Overview
- 16.2.8.2. Products
- 16.2.8.3. SWOT Analysis
- 16.2.8.4. Recent Developments
- 16.2.8.5. Financials (Based on Availability)
- 16.2.9 Nano-Z Coating Ltd
- 16.2.9.1. Overview
- 16.2.9.2. Products
- 16.2.9.3. SWOT Analysis
- 16.2.9.4. Recent Developments
- 16.2.9.5. Financials (Based on Availability)
- 16.2.10 Nanovere Technologies LLC
- 16.2.10.1. Overview
- 16.2.10.2. Products
- 16.2.10.3. SWOT Analysis
- 16.2.10.4. Recent Developments
- 16.2.10.5. Financials (Based on Availability)
- 16.2.11 Artekya Teknoloji
- 16.2.11.1. Overview
- 16.2.11.2. Products
- 16.2.11.3. SWOT Analysis
- 16.2.11.4. Recent Developments
- 16.2.11.5. Financials (Based on Availability)
- 16.2.1 Henkel AG & Co KGaA
List of Figures
- Figure 1: Global Nano Paints & Coatings Industry Revenue Breakdown (Million, %) by Region 2024 & 2032
- Figure 2: North America Nano Paints & Coatings Industry Revenue (Million), by Country 2024 & 2032
- Figure 3: North America Nano Paints & Coatings Industry Revenue Share (%), by Country 2024 & 2032
- Figure 4: Europe Nano Paints & Coatings Industry Revenue (Million), by Country 2024 & 2032
- Figure 5: Europe Nano Paints & Coatings Industry Revenue Share (%), by Country 2024 & 2032
- Figure 6: Asia Pacific Nano Paints & Coatings Industry Revenue (Million), by Country 2024 & 2032
- Figure 7: Asia Pacific Nano Paints & Coatings Industry Revenue Share (%), by Country 2024 & 2032
- Figure 8: South America Nano Paints & Coatings Industry Revenue (Million), by Country 2024 & 2032
- Figure 9: South America Nano Paints & Coatings Industry Revenue Share (%), by Country 2024 & 2032
- Figure 10: North America Nano Paints & Coatings Industry Revenue (Million), by Country 2024 & 2032
- Figure 11: North America Nano Paints & Coatings Industry Revenue Share (%), by Country 2024 & 2032
- Figure 12: MEA Nano Paints & Coatings Industry Revenue (Million), by Country 2024 & 2032
- Figure 13: MEA Nano Paints & Coatings Industry Revenue Share (%), by Country 2024 & 2032
- Figure 14: Asia Pacific Nano Paints & Coatings Industry Revenue (Million), by Resin Type 2024 & 2032
- Figure 15: Asia Pacific Nano Paints & Coatings Industry Revenue Share (%), by Resin Type 2024 & 2032
- Figure 16: Asia Pacific Nano Paints & Coatings Industry Revenue (Million), by Method 2024 & 2032
- Figure 17: Asia Pacific Nano Paints & Coatings Industry Revenue Share (%), by Method 2024 & 2032
- Figure 18: Asia Pacific Nano Paints & Coatings Industry Revenue (Million), by End-user Industry 2024 & 2032
- Figure 19: Asia Pacific Nano Paints & Coatings Industry Revenue Share (%), by End-user Industry 2024 & 2032
- Figure 20: Asia Pacific Nano Paints & Coatings Industry Revenue (Million), by Country 2024 & 2032
- Figure 21: Asia Pacific Nano Paints & Coatings Industry Revenue Share (%), by Country 2024 & 2032
- Figure 22: North America Nano Paints & Coatings Industry Revenue (Million), by Resin Type 2024 & 2032
- Figure 23: North America Nano Paints & Coatings Industry Revenue Share (%), by Resin Type 2024 & 2032
- Figure 24: North America Nano Paints & Coatings Industry Revenue (Million), by Method 2024 & 2032
- Figure 25: North America Nano Paints & Coatings Industry Revenue Share (%), by Method 2024 & 2032
- Figure 26: North America Nano Paints & Coatings Industry Revenue (Million), by End-user Industry 2024 & 2032
- Figure 27: North America Nano Paints & Coatings Industry Revenue Share (%), by End-user Industry 2024 & 2032
- Figure 28: North America Nano Paints & Coatings Industry Revenue (Million), by Country 2024 & 2032
- Figure 29: North America Nano Paints & Coatings Industry Revenue Share (%), by Country 2024 & 2032
- Figure 30: Europe Nano Paints & Coatings Industry Revenue (Million), by Resin Type 2024 & 2032
- Figure 31: Europe Nano Paints & Coatings Industry Revenue Share (%), by Resin Type 2024 & 2032
- Figure 32: Europe Nano Paints & Coatings Industry Revenue (Million), by Method 2024 & 2032
- Figure 33: Europe Nano Paints & Coatings Industry Revenue Share (%), by Method 2024 & 2032
- Figure 34: Europe Nano Paints & Coatings Industry Revenue (Million), by End-user Industry 2024 & 2032
- Figure 35: Europe Nano Paints & Coatings Industry Revenue Share (%), by End-user Industry 2024 & 2032
- Figure 36: Europe Nano Paints & Coatings Industry Revenue (Million), by Country 2024 & 2032
- Figure 37: Europe Nano Paints & Coatings Industry Revenue Share (%), by Country 2024 & 2032
- Figure 38: Rest of the World Nano Paints & Coatings Industry Revenue (Million), by Resin Type 2024 & 2032
- Figure 39: Rest of the World Nano Paints & Coatings Industry Revenue Share (%), by Resin Type 2024 & 2032
- Figure 40: Rest of the World Nano Paints & Coatings Industry Revenue (Million), by Method 2024 & 2032
- Figure 41: Rest of the World Nano Paints & Coatings Industry Revenue Share (%), by Method 2024 & 2032
- Figure 42: Rest of the World Nano Paints & Coatings Industry Revenue (Million), by End-user Industry 2024 & 2032
- Figure 43: Rest of the World Nano Paints & Coatings Industry Revenue Share (%), by End-user Industry 2024 & 2032
- Figure 44: Rest of the World Nano Paints & Coatings Industry Revenue (Million), by Country 2024 & 2032
- Figure 45: Rest of the World Nano Paints & Coatings Industry Revenue Share (%), by Country 2024 & 2032
List of Tables
- Table 1: Global Nano Paints & Coatings Industry Revenue Million Forecast, by Region 2019 & 2032
- Table 2: Global Nano Paints & Coatings Industry Revenue Million Forecast, by Resin Type 2019 & 2032
- Table 3: Global Nano Paints & Coatings Industry Revenue Million Forecast, by Method 2019 & 2032
- Table 4: Global Nano Paints & Coatings Industry Revenue Million Forecast, by End-user Industry 2019 & 2032
- Table 5: Global Nano Paints & Coatings Industry Revenue Million Forecast, by Region 2019 & 2032
- Table 6: Global Nano Paints & Coatings Industry Revenue Million Forecast, by Country 2019 & 2032
- Table 7: United States Nano Paints & Coatings Industry Revenue (Million) Forecast, by Application 2019 & 2032
- Table 8: Canada Nano Paints & Coatings Industry Revenue (Million) Forecast, by Application 2019 & 2032
- Table 9: Mexico Nano Paints & Coatings Industry Revenue (Million) Forecast, by Application 2019 & 2032
- Table 10: Global Nano Paints & Coatings Industry Revenue Million Forecast, by Country 2019 & 2032
- Table 11: Germany Nano Paints & Coatings Industry Revenue (Million) Forecast, by Application 2019 & 2032
- Table 12: United Kingdom Nano Paints & Coatings Industry Revenue (Million) Forecast, by Application 2019 & 2032
- Table 13: France Nano Paints & Coatings Industry Revenue (Million) Forecast, by Application 2019 & 2032
- Table 14: Spain Nano Paints & Coatings Industry Revenue (Million) Forecast, by Application 2019 & 2032
- Table 15: Italy Nano Paints & Coatings Industry Revenue (Million) Forecast, by Application 2019 & 2032
- Table 16: Spain Nano Paints & Coatings Industry Revenue (Million) Forecast, by Application 2019 & 2032
- Table 17: Belgium Nano Paints & Coatings Industry Revenue (Million) Forecast, by Application 2019 & 2032
- Table 18: Netherland Nano Paints & Coatings Industry Revenue (Million) Forecast, by Application 2019 & 2032
- Table 19: Nordics Nano Paints & Coatings Industry Revenue (Million) Forecast, by Application 2019 & 2032
- Table 20: Rest of Europe Nano Paints & Coatings Industry Revenue (Million) Forecast, by Application 2019 & 2032
- Table 21: Global Nano Paints & Coatings Industry Revenue Million Forecast, by Country 2019 & 2032
- Table 22: China Nano Paints & Coatings Industry Revenue (Million) Forecast, by Application 2019 & 2032
- Table 23: Japan Nano Paints & Coatings Industry Revenue (Million) Forecast, by Application 2019 & 2032
- Table 24: India Nano Paints & Coatings Industry Revenue (Million) Forecast, by Application 2019 & 2032
- Table 25: South Korea Nano Paints & Coatings Industry Revenue (Million) Forecast, by Application 2019 & 2032
- Table 26: Southeast Asia Nano Paints & Coatings Industry Revenue (Million) Forecast, by Application 2019 & 2032
- Table 27: Australia Nano Paints & Coatings Industry Revenue (Million) Forecast, by Application 2019 & 2032
- Table 28: Indonesia Nano Paints & Coatings Industry Revenue (Million) Forecast, by Application 2019 & 2032
- Table 29: Phillipes Nano Paints & Coatings Industry Revenue (Million) Forecast, by Application 2019 & 2032
- Table 30: Singapore Nano Paints & Coatings Industry Revenue (Million) Forecast, by Application 2019 & 2032
- Table 31: Thailandc Nano Paints & Coatings Industry Revenue (Million) Forecast, by Application 2019 & 2032
- Table 32: Rest of Asia Pacific Nano Paints & Coatings Industry Revenue (Million) Forecast, by Application 2019 & 2032
- Table 33: Global Nano Paints & Coatings Industry Revenue Million Forecast, by Country 2019 & 2032
- Table 34: Brazil Nano Paints & Coatings Industry Revenue (Million) Forecast, by Application 2019 & 2032
- Table 35: Argentina Nano Paints & Coatings Industry Revenue (Million) Forecast, by Application 2019 & 2032
- Table 36: Peru Nano Paints & Coatings Industry Revenue (Million) Forecast, by Application 2019 & 2032
- Table 37: Chile Nano Paints & Coatings Industry Revenue (Million) Forecast, by Application 2019 & 2032
- Table 38: Colombia Nano Paints & Coatings Industry Revenue (Million) Forecast, by Application 2019 & 2032
- Table 39: Ecuador Nano Paints & Coatings Industry Revenue (Million) Forecast, by Application 2019 & 2032
- Table 40: Venezuela Nano Paints & Coatings Industry Revenue (Million) Forecast, by Application 2019 & 2032
- Table 41: Rest of South America Nano Paints & Coatings Industry Revenue (Million) Forecast, by Application 2019 & 2032
- Table 42: Global Nano Paints & Coatings Industry Revenue Million Forecast, by Country 2019 & 2032
- Table 43: United States Nano Paints & Coatings Industry Revenue (Million) Forecast, by Application 2019 & 2032
- Table 44: Canada Nano Paints & Coatings Industry Revenue (Million) Forecast, by Application 2019 & 2032
- Table 45: Mexico Nano Paints & Coatings Industry Revenue (Million) Forecast, by Application 2019 & 2032
- Table 46: Global Nano Paints & Coatings Industry Revenue Million Forecast, by Country 2019 & 2032
- Table 47: United Arab Emirates Nano Paints & Coatings Industry Revenue (Million) Forecast, by Application 2019 & 2032
- Table 48: Saudi Arabia Nano Paints & Coatings Industry Revenue (Million) Forecast, by Application 2019 & 2032
- Table 49: South Africa Nano Paints & Coatings Industry Revenue (Million) Forecast, by Application 2019 & 2032
- Table 50: Rest of Middle East and Africa Nano Paints & Coatings Industry Revenue (Million) Forecast, by Application 2019 & 2032
- Table 51: Global Nano Paints & Coatings Industry Revenue Million Forecast, by Resin Type 2019 & 2032
- Table 52: Global Nano Paints & Coatings Industry Revenue Million Forecast, by Method 2019 & 2032
- Table 53: Global Nano Paints & Coatings Industry Revenue Million Forecast, by End-user Industry 2019 & 2032
- Table 54: Global Nano Paints & Coatings Industry Revenue Million Forecast, by Country 2019 & 2032
- Table 55: China Nano Paints & Coatings Industry Revenue (Million) Forecast, by Application 2019 & 2032
- Table 56: India Nano Paints & Coatings Industry Revenue (Million) Forecast, by Application 2019 & 2032
- Table 57: Japan Nano Paints & Coatings Industry Revenue (Million) Forecast, by Application 2019 & 2032
- Table 58: South Korea Nano Paints & Coatings Industry Revenue (Million) Forecast, by Application 2019 & 2032
- Table 59: Rest of Asia Pacific Nano Paints & Coatings Industry Revenue (Million) Forecast, by Application 2019 & 2032
- Table 60: Global Nano Paints & Coatings Industry Revenue Million Forecast, by Resin Type 2019 & 2032
- Table 61: Global Nano Paints & Coatings Industry Revenue Million Forecast, by Method 2019 & 2032
- Table 62: Global Nano Paints & Coatings Industry Revenue Million Forecast, by End-user Industry 2019 & 2032
- Table 63: Global Nano Paints & Coatings Industry Revenue Million Forecast, by Country 2019 & 2032
- Table 64: United States Nano Paints & Coatings Industry Revenue (Million) Forecast, by Application 2019 & 2032
- Table 65: Canada Nano Paints & Coatings Industry Revenue (Million) Forecast, by Application 2019 & 2032
- Table 66: Mexico Nano Paints & Coatings Industry Revenue (Million) Forecast, by Application 2019 & 2032
- Table 67: Global Nano Paints & Coatings Industry Revenue Million Forecast, by Resin Type 2019 & 2032
- Table 68: Global Nano Paints & Coatings Industry Revenue Million Forecast, by Method 2019 & 2032
- Table 69: Global Nano Paints & Coatings Industry Revenue Million Forecast, by End-user Industry 2019 & 2032
- Table 70: Global Nano Paints & Coatings Industry Revenue Million Forecast, by Country 2019 & 2032
- Table 71: Germany Nano Paints & Coatings Industry Revenue (Million) Forecast, by Application 2019 & 2032
- Table 72: United Kingdom Nano Paints & Coatings Industry Revenue (Million) Forecast, by Application 2019 & 2032
- Table 73: Italy Nano Paints & Coatings Industry Revenue (Million) Forecast, by Application 2019 & 2032
- Table 74: France Nano Paints & Coatings Industry Revenue (Million) Forecast, by Application 2019 & 2032
- Table 75: Rest of Europe Nano Paints & Coatings Industry Revenue (Million) Forecast, by Application 2019 & 2032
- Table 76: Global Nano Paints & Coatings Industry Revenue Million Forecast, by Resin Type 2019 & 2032
- Table 77: Global Nano Paints & Coatings Industry Revenue Million Forecast, by Method 2019 & 2032
- Table 78: Global Nano Paints & Coatings Industry Revenue Million Forecast, by End-user Industry 2019 & 2032
- Table 79: Global Nano Paints & Coatings Industry Revenue Million Forecast, by Country 2019 & 2032
- Table 80: South America Nano Paints & Coatings Industry Revenue (Million) Forecast, by Application 2019 & 2032
- Table 81: Middle East Nano Paints & Coatings Industry Revenue (Million) Forecast, by Application 2019 & 2032
Frequently Asked Questions
1. What is the projected Compound Annual Growth Rate (CAGR) of the Nano Paints & Coatings Industry?
The projected CAGR is approximately > 4.00%.
2. Which companies are prominent players in the Nano Paints & Coatings Industry?
Key companies in the market include Henkel AG & Co KGaA, Pearl Nano LLC, CTC Nanotechnology GmbH, Evonik Industries AG, PPG Industries Inc, NanoShine Ltd, Starshield Technologies Pvt Ltd*List Not Exhaustive, icannanopaints com ( Innovation Center for Applied Nanotechnology), Nano-Z Coating Ltd, Nanovere Technologies LLC, Artekya Teknoloji.
3. What are the main segments of the Nano Paints & Coatings Industry?
The market segments include Resin Type, Method, End-user Industry.
4. Can you provide details about the market size?
The market size is estimated to be USD XX Million as of 2022.
5. What are some drivers contributing to market growth?
; Growing Demand from the Aerospace & Defense Industry; Other Drivers.
6. What are the notable trends driving market growth?
Graphene to Dominate the Market.
7. Are there any restraints impacting market growth?
; High Price Bar of Conductive Textile Made Products; Other Restraints.
8. Can you provide examples of recent developments in the market?
N/A
9. What pricing options are available for accessing the report?
Pricing options include single-user, multi-user, and enterprise licenses priced at USD 4750, USD 5250, and USD 8750 respectively.
10. Is the market size provided in terms of value or volume?
The market size is provided in terms of value, measured in Million.
11. Are there any specific market keywords associated with the report?
Yes, the market keyword associated with the report is "Nano Paints & Coatings Industry," which aids in identifying and referencing the specific market segment covered.
12. How do I determine which pricing option suits my needs best?
The pricing options vary based on user requirements and access needs. Individual users may opt for single-user licenses, while businesses requiring broader access may choose multi-user or enterprise licenses for cost-effective access to the report.
13. Are there any additional resources or data provided in the Nano Paints & Coatings Industry report?
While the report offers comprehensive insights, it's advisable to review the specific contents or supplementary materials provided to ascertain if additional resources or data are available.
14. How can I stay updated on further developments or reports in the Nano Paints & Coatings Industry?
To stay informed about further developments, trends, and reports in the Nano Paints & Coatings Industry, consider subscribing to industry newsletters, following relevant companies and organizations, or regularly checking reputable industry news sources and publications.
Methodology
Step 1 - Identification of Relevant Samples Size from Population Database


Step 2 - Approaches for Defining Global Market Size (Value, Volume* & Price*)

Note*: In applicable scenarios
Step 3 - Data Sources
Primary Research
- Web Analytics
- Survey Reports
- Research Institute
- Latest Research Reports
- Opinion Leaders
Secondary Research
- Annual Reports
- White Paper
- Latest Press Release
- Industry Association
- Paid Database
- Investor Presentations

Step 4 - Data Triangulation
Involves using different sources of information in order to increase the validity of a study
These sources are likely to be stakeholders in a program - participants, other researchers, program staff, other community members, and so on.
Then we put all data in single framework & apply various statistical tools to find out the dynamic on the market.
During the analysis stage, feedback from the stakeholder groups would be compared to determine areas of agreement as well as areas of divergence
