

Key Insights
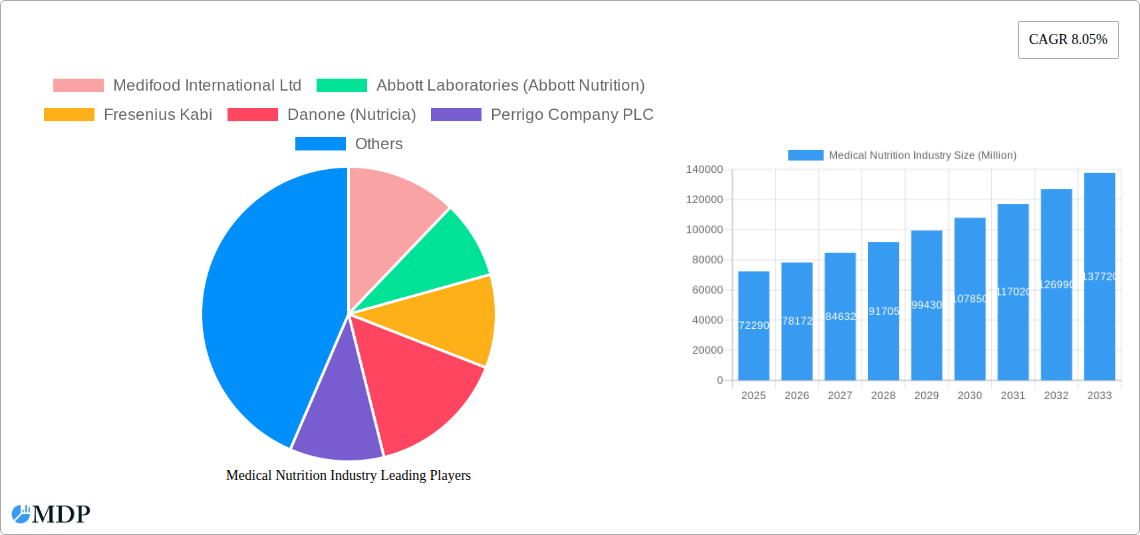
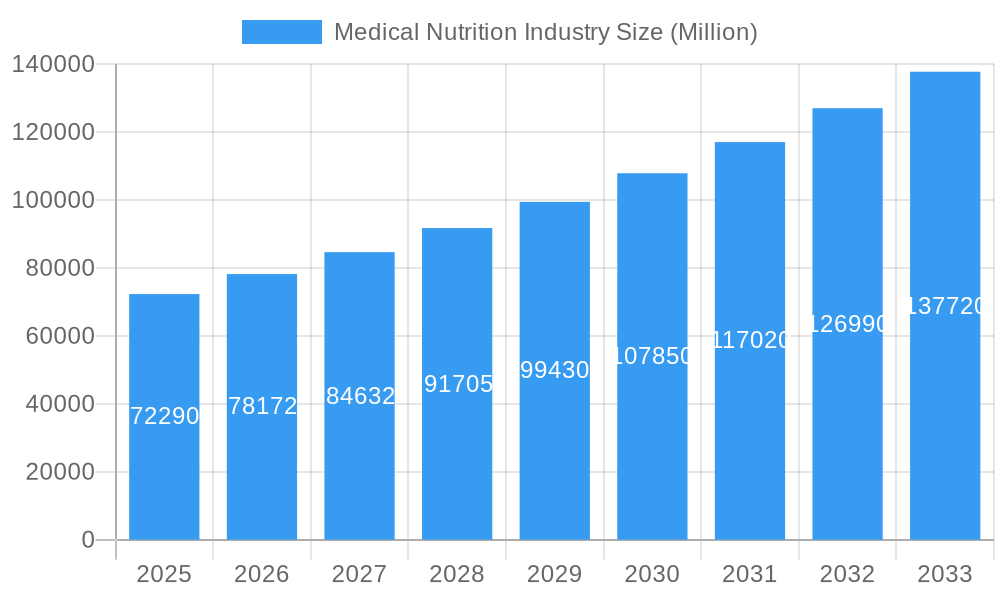
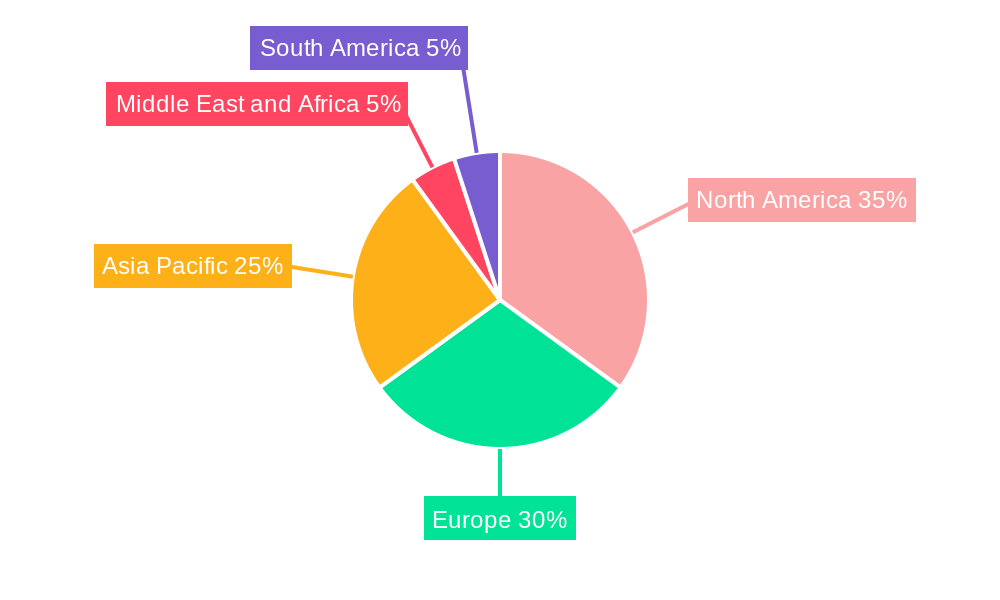
The medical nutrition industry, valued at $72.29 billion in 2025, is experiencing robust growth, projected to expand at a compound annual growth rate (CAGR) of 8.05% from 2025 to 2033. This growth is fueled by several key factors. The rising prevalence of chronic diseases like diabetes, cancer, and gastrointestinal disorders necessitates specialized nutritional support, driving demand for medical nutrition products. An aging global population, with its increased susceptibility to age-related health issues requiring nutritional intervention, further contributes to market expansion. Advancements in product formulations, focusing on improved palatability, nutrient absorption, and customized solutions for specific conditions, are also significant growth drivers. Furthermore, increasing healthcare expenditure and rising awareness regarding the importance of nutrition in disease management are bolstering market expansion. The market is segmented by application (nutritional support for malnutrition, metabolic disorders, gastrointestinal diseases, cancer, neurological diseases, and other diseases), end-user (pediatric and adult), and route of administration (oral and enteral, parenteral). North America and Europe currently hold significant market shares due to advanced healthcare infrastructure and high healthcare spending, but the Asia-Pacific region is poised for substantial growth owing to rising disposable incomes and improving healthcare access.
Medical Nutrition Industry Market Size (In Billion)
The competitive landscape is characterized by a mix of large multinational corporations and specialized medical nutrition companies. Key players like Abbott Laboratories, Nestle Health Science, and Fresenius Kabi dominate the market, leveraging their established distribution networks and strong research and development capabilities. However, smaller, specialized companies are also gaining traction by focusing on niche applications and innovative product development. The industry faces challenges such as stringent regulatory requirements, high research and development costs, and the need for effective distribution strategies to reach target patient populations. Despite these challenges, the long-term outlook for the medical nutrition industry remains positive, driven by the increasing prevalence of chronic diseases and the growing recognition of the critical role of nutrition in overall health and well-being. Future growth will likely be influenced by the development of personalized nutrition solutions, technological advancements in product delivery, and an increasing focus on preventative healthcare.
Medical Nutrition Industry Company Market Share
Medical Nutrition Industry Market Report: 2019-2033
This comprehensive report provides a detailed analysis of the Medical Nutrition Industry, projecting a market value exceeding $XX Billion by 2033. It offers in-depth insights into market dynamics, leading players, emerging trends, and future growth opportunities, covering the period from 2019 to 2033. This report is essential for industry stakeholders, investors, and businesses seeking to navigate and capitalize on the growth potential within this dynamic sector. The study period is 2019-2033, with 2025 as the base and estimated year. The forecast period is 2025-2033, and the historical period is 2019-2024.
Medical Nutrition Industry Market Dynamics & Concentration
The Medical Nutrition Industry is characterized by a moderately concentrated market landscape, with key players like Abbott Laboratories (Abbott Nutrition), Nestle Health Science, and Fresenius Kabi holding significant market share. The market size is estimated at $XX Billion in 2025. However, the presence of numerous smaller specialized companies also contributes to the market's dynamism.
Innovation is a major driver, fueled by advancements in nutritional science, personalized medicine, and technological improvements in product delivery systems. Stringent regulatory frameworks, varying across different geographies, impact product development and market entry. Product substitutes, such as home-prepared diets or alternative therapies, pose a competitive challenge. End-user preferences, particularly towards convenient and palatable products, are shaping product development.
Mergers and acquisitions (M&A) activities have been significant, with an estimated xx M&A deals in the last 5 years, reflecting the industry's consolidation trends. This activity aims to expand product portfolios, enhance market reach, and secure access to innovative technologies.
- Market Concentration: Moderately concentrated, with top 5 players holding approximately xx% market share in 2025.
- Innovation Drivers: Advancements in nutritional science, personalized medicine, and delivery systems.
- Regulatory Framework: Stringent regulations impacting product development and market access.
- Product Substitutes: Home-prepared diets, alternative therapies.
- End-user Trends: Preference for convenient, palatable products.
- M&A Activity: Approximately xx deals in the last 5 years, driven by expansion and innovation goals.
Medical Nutrition Industry Industry Trends & Analysis
The Medical Nutrition Industry is experiencing robust growth, driven by increasing prevalence of chronic diseases like diabetes, obesity, and cancer, leading to a higher demand for specialized nutritional support. The market is projected to achieve a CAGR of xx% during the forecast period (2025-2033). This growth is further fueled by rising healthcare expenditure, aging populations, and increasing awareness regarding the role of nutrition in disease management. Technological advancements, such as the development of personalized nutrition solutions and innovative delivery systems, are disrupting traditional approaches and enhancing market penetration. Consumer preferences are shifting towards convenient, palatable, and scientifically-backed products. Intense competition among established players and emerging companies is shaping market dynamics, fostering innovation and enhancing product offerings. Market penetration of specialized medical nutrition products in developing countries remains relatively low, presenting significant growth opportunities.
Leading Markets & Segments in Medical Nutrition Industry
The North American market currently dominates the medical nutrition industry, driven by high healthcare expenditure, advanced healthcare infrastructure, and high prevalence of chronic diseases. However, the Asia-Pacific region is anticipated to witness significant growth during the forecast period due to the increasing prevalence of chronic diseases and rising disposable incomes.
- Dominant Region: North America
- Fastest-Growing Region: Asia-Pacific
- Leading Application Segment: Nutritional Support for Malnutrition (with xx% market share in 2025). Other significant segments include Nutritional Support for Metabolic Disorders, Gastrointestinal Diseases, and Cancer.
- Leading End-User Segment: Adult (with xx% market share in 2025), followed by Pediatric.
- Leading Route of Administration: Oral and Enteral (dominating the market due to convenience and cost-effectiveness). Parenteral administration remains a crucial segment for specific clinical needs.
- Key Drivers (North America): Robust healthcare infrastructure, high prevalence of chronic diseases, and high healthcare expenditure.
- Key Drivers (Asia-Pacific): Increasing prevalence of chronic diseases, rising disposable incomes, and expanding healthcare infrastructure.
Medical Nutrition Industry Product Developments
Recent product innovations focus on personalized nutrition, improved palatability, enhanced nutrient absorption, and convenient delivery systems. Companies are leveraging advancements in nutritional science and technology to develop products tailored to specific patient needs and clinical conditions. This includes the introduction of products with advanced nutrient profiles, specialized formulations for specific diseases, and technologically advanced delivery systems such as smart packaging. These innovations contribute to improved patient outcomes, increased compliance, and competitive advantages in the market.
Key Drivers of Medical Nutrition Industry Growth
Several factors propel the growth of the medical nutrition industry:
- Technological Advancements: Development of personalized nutrition solutions, innovative delivery systems, and improved formulations.
- Rising Prevalence of Chronic Diseases: Growing incidence of diabetes, obesity, cancer, and other chronic conditions.
- Favorable Regulatory Environment: Approvals for new products and increased awareness about the importance of nutrition in disease management.
Challenges in the Medical Nutrition Industry Market
The medical nutrition market faces key challenges:
- Stringent Regulatory Hurdles: Complex regulatory pathways increase the time and cost for product approvals.
- Supply Chain Disruptions: Global events can impact the availability of raw materials and affect production.
- Intense Competition: The market is competitive, with established players and emerging companies vying for market share. This pressure keeps profit margins constrained.
Emerging Opportunities in Medical Nutrition Industry
The industry holds substantial potential for future growth, driven by technological breakthroughs in personalized nutrition and the growing demand for innovative solutions in disease management. Strategic partnerships between medical nutrition companies and healthcare providers, coupled with expansion into emerging markets, are promising avenues for long-term growth.
Leading Players in the Medical Nutrition Industry Sector
- Abbott Laboratories (Abbott Nutrition)
- Fresenius Kabi
- Danone (Nutricia)
- Perrigo Company PLC
- Nestle Health Science
- Ajinomoto Cambrooke Inc (Nualtra Ltd)
- AYMES International Ltd
- Baxter Healthcare
- B Braun SE
- Reckitt Benckiser
- Medifood International Ltd
Key Milestones in Medical Nutrition Industry Industry
- October 2022: Hologram Sciences and Maeil Health Nutrition partnered to deliver personalized nutrition solutions in the Korean market. This highlights a growing trend towards customized nutrition.
- April 2022: Glanbia Nutritionals launched TechVantage, a functionally optimized nutrient technology platform. This showcases the importance of technological advancements in product development.
Strategic Outlook for Medical Nutrition Industry Market
The Medical Nutrition Industry is poised for continued growth, driven by the increasing prevalence of chronic diseases, technological advancements, and expanding healthcare infrastructure globally. Strategic opportunities exist in personalized nutrition, innovative product development, and market expansion into emerging economies. Focus on research and development, strategic partnerships, and effective marketing strategies will be crucial for success in this dynamic and evolving market.
Medical Nutrition Industry Segmentation
-
1. Route of Administration
- 1.1. Oral and Enteral
- 1.2. Parenteral
-
2. Application
- 2.1. Nutritional Support for Malnutrition
- 2.2. Nutritional Support for Metabolic Disorders
- 2.3. Nutritional Support for Gastrointestinal Diseases
- 2.4. Nutritional Support for Cancer
- 2.5. Nutritional Support in Neurological Diseases
- 2.6. Nutritional Support in Other Diseases
-
3. End User
- 3.1. Pediatric
- 3.2. Adult
Medical Nutrition Industry Segmentation By Geography
-
1. North America
- 1.1. United States
- 1.2. Canada
- 1.3. Mexico
-
2. Europe
- 2.1. Germany
- 2.2. United Kingdom
- 2.3. France
- 2.4. Italy
- 2.5. Spain
- 2.6. Rest of Europe
-
3. Asia Pacific
- 3.1. China
- 3.2. Japan
- 3.3. India
- 3.4. Australia
- 3.5. South Korea
- 3.6. Rest of Asia Pacific
-
4. Middle East and Africa
- 4.1. GCC
- 4.2. South Africa
- 4.3. Rest of Middle East and Africa
-
5. South America
- 5.1. Brazil
- 5.2. Argentina
- 5.3. Rest of South America
Medical Nutrition Industry Regional Market Share
Geographic Coverage of Medical Nutrition Industry
Medical Nutrition Industry REPORT HIGHLIGHTS
| Aspects | Details |
|---|---|
| Study Period | 2020-2034 |
| Base Year | 2025 |
| Estimated Year | 2026 |
| Forecast Period | 2026-2034 |
| Historical Period | 2020-2025 |
| Growth Rate | CAGR of 8.05% from 2020-2034 |
| Segmentation |
|
Table of Contents
- 1. Introduction
- 1.1. Research Scope
- 1.2. Market Segmentation
- 1.3. Research Objective
- 1.4. Definitions and Assumptions
- 2. Executive Summary
- 2.1. Market Snapshot
- 3. Market Dynamics
- 3.1. Market Drivers
- 3.2. Market Restrains
- 3.3. Market Trends
- 3.4. Market Opportunities
- 4. Market Factor Analysis
- 4.1. Porters Five Forces
- 4.1.1. Bargaining Power of Suppliers
- 4.1.2. Bargaining Power of Buyers
- 4.1.3. Threat of New Entrants
- 4.1.4. Threat of Substitutes
- 4.1.5. Competitive Rivalry
- 4.2. PESTEL analysis
- 4.3. BCG Analysis
- 4.3.1. Stars (High Growth, High Market Share)
- 4.3.2. Cash Cows (Low Growth, High Market Share)
- 4.3.3. Question Mark (High Growth, Low Market Share)
- 4.3.4. Dogs (Low Growth, Low Market Share)
- 4.4. Ansoff Matrix Analysis
- 4.5. Supply Chain Analysis
- 4.6. Regulatory Landscape
- 4.7. Current Market Potential and Opportunity Assessment (TAM–SAM–SOM Framework)
- 4.8. MDP Analyst Note
- 4.1. Porters Five Forces
- 5. Market Analysis, Insights and Forecast 2021-2033
- 5.1. Market Analysis, Insights and Forecast - by Route of Administration
- 5.1.1. Oral and Enteral
- 5.1.2. Parenteral
- 5.2. Market Analysis, Insights and Forecast - by Application
- 5.2.1. Nutritional Support for Malnutrition
- 5.2.2. Nutritional Support for Metabolic Disorders
- 5.2.3. Nutritional Support for Gastrointestinal Diseases
- 5.2.4. Nutritional Support for Cancer
- 5.2.5. Nutritional Support in Neurological Diseases
- 5.2.6. Nutritional Support in Other Diseases
- 5.3. Market Analysis, Insights and Forecast - by End User
- 5.3.1. Pediatric
- 5.3.2. Adult
- 5.4. Market Analysis, Insights and Forecast - by Region
- 5.4.1. North America
- 5.4.2. Europe
- 5.4.3. Asia Pacific
- 5.4.4. Middle East and Africa
- 5.4.5. South America
- 5.1. Market Analysis, Insights and Forecast - by Route of Administration
- 6. Global Medical Nutrition Industry Analysis, Insights and Forecast, 2021-2033
- 6.1. Market Analysis, Insights and Forecast - by Route of Administration
- 6.1.1. Oral and Enteral
- 6.1.2. Parenteral
- 6.2. Market Analysis, Insights and Forecast - by Application
- 6.2.1. Nutritional Support for Malnutrition
- 6.2.2. Nutritional Support for Metabolic Disorders
- 6.2.3. Nutritional Support for Gastrointestinal Diseases
- 6.2.4. Nutritional Support for Cancer
- 6.2.5. Nutritional Support in Neurological Diseases
- 6.2.6. Nutritional Support in Other Diseases
- 6.3. Market Analysis, Insights and Forecast - by End User
- 6.3.1. Pediatric
- 6.3.2. Adult
- 6.1. Market Analysis, Insights and Forecast - by Route of Administration
- 7. North America Medical Nutrition Industry Analysis, Insights and Forecast, 2020-2032
- 7.1. Market Analysis, Insights and Forecast - by Route of Administration
- 7.1.1. Oral and Enteral
- 7.1.2. Parenteral
- 7.2. Market Analysis, Insights and Forecast - by Application
- 7.2.1. Nutritional Support for Malnutrition
- 7.2.2. Nutritional Support for Metabolic Disorders
- 7.2.3. Nutritional Support for Gastrointestinal Diseases
- 7.2.4. Nutritional Support for Cancer
- 7.2.5. Nutritional Support in Neurological Diseases
- 7.2.6. Nutritional Support in Other Diseases
- 7.3. Market Analysis, Insights and Forecast - by End User
- 7.3.1. Pediatric
- 7.3.2. Adult
- 7.1. Market Analysis, Insights and Forecast - by Route of Administration
- 8. Europe Medical Nutrition Industry Analysis, Insights and Forecast, 2020-2032
- 8.1. Market Analysis, Insights and Forecast - by Route of Administration
- 8.1.1. Oral and Enteral
- 8.1.2. Parenteral
- 8.2. Market Analysis, Insights and Forecast - by Application
- 8.2.1. Nutritional Support for Malnutrition
- 8.2.2. Nutritional Support for Metabolic Disorders
- 8.2.3. Nutritional Support for Gastrointestinal Diseases
- 8.2.4. Nutritional Support for Cancer
- 8.2.5. Nutritional Support in Neurological Diseases
- 8.2.6. Nutritional Support in Other Diseases
- 8.3. Market Analysis, Insights and Forecast - by End User
- 8.3.1. Pediatric
- 8.3.2. Adult
- 8.1. Market Analysis, Insights and Forecast - by Route of Administration
- 9. Asia Pacific Medical Nutrition Industry Analysis, Insights and Forecast, 2020-2032
- 9.1. Market Analysis, Insights and Forecast - by Route of Administration
- 9.1.1. Oral and Enteral
- 9.1.2. Parenteral
- 9.2. Market Analysis, Insights and Forecast - by Application
- 9.2.1. Nutritional Support for Malnutrition
- 9.2.2. Nutritional Support for Metabolic Disorders
- 9.2.3. Nutritional Support for Gastrointestinal Diseases
- 9.2.4. Nutritional Support for Cancer
- 9.2.5. Nutritional Support in Neurological Diseases
- 9.2.6. Nutritional Support in Other Diseases
- 9.3. Market Analysis, Insights and Forecast - by End User
- 9.3.1. Pediatric
- 9.3.2. Adult
- 9.1. Market Analysis, Insights and Forecast - by Route of Administration
- 10. Middle East and Africa Medical Nutrition Industry Analysis, Insights and Forecast, 2020-2032
- 10.1. Market Analysis, Insights and Forecast - by Route of Administration
- 10.1.1. Oral and Enteral
- 10.1.2. Parenteral
- 10.2. Market Analysis, Insights and Forecast - by Application
- 10.2.1. Nutritional Support for Malnutrition
- 10.2.2. Nutritional Support for Metabolic Disorders
- 10.2.3. Nutritional Support for Gastrointestinal Diseases
- 10.2.4. Nutritional Support for Cancer
- 10.2.5. Nutritional Support in Neurological Diseases
- 10.2.6. Nutritional Support in Other Diseases
- 10.3. Market Analysis, Insights and Forecast - by End User
- 10.3.1. Pediatric
- 10.3.2. Adult
- 10.1. Market Analysis, Insights and Forecast - by Route of Administration
- 11. South America Medical Nutrition Industry Analysis, Insights and Forecast, 2020-2032
- 11.1. Market Analysis, Insights and Forecast - by Route of Administration
- 11.1.1. Oral and Enteral
- 11.1.2. Parenteral
- 11.2. Market Analysis, Insights and Forecast - by Application
- 11.2.1. Nutritional Support for Malnutrition
- 11.2.2. Nutritional Support for Metabolic Disorders
- 11.2.3. Nutritional Support for Gastrointestinal Diseases
- 11.2.4. Nutritional Support for Cancer
- 11.2.5. Nutritional Support in Neurological Diseases
- 11.2.6. Nutritional Support in Other Diseases
- 11.3. Market Analysis, Insights and Forecast - by End User
- 11.3.1. Pediatric
- 11.3.2. Adult
- 11.1. Market Analysis, Insights and Forecast - by Route of Administration
- 12. Competitive Analysis
- 12.1. Company Profiles
- 12.1.1 Medifood International Ltd
- 12.1.1.1. Company Overview
- 12.1.1.2. Products
- 12.1.1.3. Company Financials
- 12.1.1.4. SWOT Analysis
- 12.1.2 Abbott Laboratories (Abbott Nutrition)
- 12.1.2.1. Company Overview
- 12.1.2.2. Products
- 12.1.2.3. Company Financials
- 12.1.2.4. SWOT Analysis
- 12.1.3 Fresenius Kabi
- 12.1.3.1. Company Overview
- 12.1.3.2. Products
- 12.1.3.3. Company Financials
- 12.1.3.4. SWOT Analysis
- 12.1.4 Danone (Nutricia)
- 12.1.4.1. Company Overview
- 12.1.4.2. Products
- 12.1.4.3. Company Financials
- 12.1.4.4. SWOT Analysis
- 12.1.5 Perrigo Company PLC
- 12.1.5.1. Company Overview
- 12.1.5.2. Products
- 12.1.5.3. Company Financials
- 12.1.5.4. SWOT Analysis
- 12.1.6 Nestle Health Science
- 12.1.6.1. Company Overview
- 12.1.6.2. Products
- 12.1.6.3. Company Financials
- 12.1.6.4. SWOT Analysis
- 12.1.7 Ajinomoto Cambrooke Inc (Nualtra Ltd)
- 12.1.7.1. Company Overview
- 12.1.7.2. Products
- 12.1.7.3. Company Financials
- 12.1.7.4. SWOT Analysis
- 12.1.8 AYMES International Ltd
- 12.1.8.1. Company Overview
- 12.1.8.2. Products
- 12.1.8.3. Company Financials
- 12.1.8.4. SWOT Analysis
- 12.1.9 Baxter Healthcare
- 12.1.9.1. Company Overview
- 12.1.9.2. Products
- 12.1.9.3. Company Financials
- 12.1.9.4. SWOT Analysis
- 12.1.10 B Braun SE
- 12.1.10.1. Company Overview
- 12.1.10.2. Products
- 12.1.10.3. Company Financials
- 12.1.10.4. SWOT Analysis
- 12.1.11 Reckitt Benckiser
- 12.1.11.1. Company Overview
- 12.1.11.2. Products
- 12.1.11.3. Company Financials
- 12.1.11.4. SWOT Analysis
- 12.1.1 Medifood International Ltd
- 12.2. Market Entropy
- 12.2.1 Company's Key Areas Served
- 12.2.2 Recent Developments
- 12.3. Company Market Share Analysis 2025
- 12.3.1 Top 5 Companies Market Share Analysis
- 12.3.2 Top 3 Companies Market Share Analysis
- 12.4. List of Potential Customers
- 13. Research Methodology
List of Figures
- Figure 1: Global Medical Nutrition Industry Revenue Breakdown (Million, %) by Region 2025 & 2033
- Figure 2: Global Medical Nutrition Industry Volume Breakdown (K Unit, %) by Region 2025 & 2033
- Figure 3: North America Medical Nutrition Industry Revenue (Million), by Route of Administration 2025 & 2033
- Figure 4: North America Medical Nutrition Industry Volume (K Unit), by Route of Administration 2025 & 2033
- Figure 5: North America Medical Nutrition Industry Revenue Share (%), by Route of Administration 2025 & 2033
- Figure 6: North America Medical Nutrition Industry Volume Share (%), by Route of Administration 2025 & 2033
- Figure 7: North America Medical Nutrition Industry Revenue (Million), by Application 2025 & 2033
- Figure 8: North America Medical Nutrition Industry Volume (K Unit), by Application 2025 & 2033
- Figure 9: North America Medical Nutrition Industry Revenue Share (%), by Application 2025 & 2033
- Figure 10: North America Medical Nutrition Industry Volume Share (%), by Application 2025 & 2033
- Figure 11: North America Medical Nutrition Industry Revenue (Million), by End User 2025 & 2033
- Figure 12: North America Medical Nutrition Industry Volume (K Unit), by End User 2025 & 2033
- Figure 13: North America Medical Nutrition Industry Revenue Share (%), by End User 2025 & 2033
- Figure 14: North America Medical Nutrition Industry Volume Share (%), by End User 2025 & 2033
- Figure 15: North America Medical Nutrition Industry Revenue (Million), by Country 2025 & 2033
- Figure 16: North America Medical Nutrition Industry Volume (K Unit), by Country 2025 & 2033
- Figure 17: North America Medical Nutrition Industry Revenue Share (%), by Country 2025 & 2033
- Figure 18: North America Medical Nutrition Industry Volume Share (%), by Country 2025 & 2033
- Figure 19: Europe Medical Nutrition Industry Revenue (Million), by Route of Administration 2025 & 2033
- Figure 20: Europe Medical Nutrition Industry Volume (K Unit), by Route of Administration 2025 & 2033
- Figure 21: Europe Medical Nutrition Industry Revenue Share (%), by Route of Administration 2025 & 2033
- Figure 22: Europe Medical Nutrition Industry Volume Share (%), by Route of Administration 2025 & 2033
- Figure 23: Europe Medical Nutrition Industry Revenue (Million), by Application 2025 & 2033
- Figure 24: Europe Medical Nutrition Industry Volume (K Unit), by Application 2025 & 2033
- Figure 25: Europe Medical Nutrition Industry Revenue Share (%), by Application 2025 & 2033
- Figure 26: Europe Medical Nutrition Industry Volume Share (%), by Application 2025 & 2033
- Figure 27: Europe Medical Nutrition Industry Revenue (Million), by End User 2025 & 2033
- Figure 28: Europe Medical Nutrition Industry Volume (K Unit), by End User 2025 & 2033
- Figure 29: Europe Medical Nutrition Industry Revenue Share (%), by End User 2025 & 2033
- Figure 30: Europe Medical Nutrition Industry Volume Share (%), by End User 2025 & 2033
- Figure 31: Europe Medical Nutrition Industry Revenue (Million), by Country 2025 & 2033
- Figure 32: Europe Medical Nutrition Industry Volume (K Unit), by Country 2025 & 2033
- Figure 33: Europe Medical Nutrition Industry Revenue Share (%), by Country 2025 & 2033
- Figure 34: Europe Medical Nutrition Industry Volume Share (%), by Country 2025 & 2033
- Figure 35: Asia Pacific Medical Nutrition Industry Revenue (Million), by Route of Administration 2025 & 2033
- Figure 36: Asia Pacific Medical Nutrition Industry Volume (K Unit), by Route of Administration 2025 & 2033
- Figure 37: Asia Pacific Medical Nutrition Industry Revenue Share (%), by Route of Administration 2025 & 2033
- Figure 38: Asia Pacific Medical Nutrition Industry Volume Share (%), by Route of Administration 2025 & 2033
- Figure 39: Asia Pacific Medical Nutrition Industry Revenue (Million), by Application 2025 & 2033
- Figure 40: Asia Pacific Medical Nutrition Industry Volume (K Unit), by Application 2025 & 2033
- Figure 41: Asia Pacific Medical Nutrition Industry Revenue Share (%), by Application 2025 & 2033
- Figure 42: Asia Pacific Medical Nutrition Industry Volume Share (%), by Application 2025 & 2033
- Figure 43: Asia Pacific Medical Nutrition Industry Revenue (Million), by End User 2025 & 2033
- Figure 44: Asia Pacific Medical Nutrition Industry Volume (K Unit), by End User 2025 & 2033
- Figure 45: Asia Pacific Medical Nutrition Industry Revenue Share (%), by End User 2025 & 2033
- Figure 46: Asia Pacific Medical Nutrition Industry Volume Share (%), by End User 2025 & 2033
- Figure 47: Asia Pacific Medical Nutrition Industry Revenue (Million), by Country 2025 & 2033
- Figure 48: Asia Pacific Medical Nutrition Industry Volume (K Unit), by Country 2025 & 2033
- Figure 49: Asia Pacific Medical Nutrition Industry Revenue Share (%), by Country 2025 & 2033
- Figure 50: Asia Pacific Medical Nutrition Industry Volume Share (%), by Country 2025 & 2033
- Figure 51: Middle East and Africa Medical Nutrition Industry Revenue (Million), by Route of Administration 2025 & 2033
- Figure 52: Middle East and Africa Medical Nutrition Industry Volume (K Unit), by Route of Administration 2025 & 2033
- Figure 53: Middle East and Africa Medical Nutrition Industry Revenue Share (%), by Route of Administration 2025 & 2033
- Figure 54: Middle East and Africa Medical Nutrition Industry Volume Share (%), by Route of Administration 2025 & 2033
- Figure 55: Middle East and Africa Medical Nutrition Industry Revenue (Million), by Application 2025 & 2033
- Figure 56: Middle East and Africa Medical Nutrition Industry Volume (K Unit), by Application 2025 & 2033
- Figure 57: Middle East and Africa Medical Nutrition Industry Revenue Share (%), by Application 2025 & 2033
- Figure 58: Middle East and Africa Medical Nutrition Industry Volume Share (%), by Application 2025 & 2033
- Figure 59: Middle East and Africa Medical Nutrition Industry Revenue (Million), by End User 2025 & 2033
- Figure 60: Middle East and Africa Medical Nutrition Industry Volume (K Unit), by End User 2025 & 2033
- Figure 61: Middle East and Africa Medical Nutrition Industry Revenue Share (%), by End User 2025 & 2033
- Figure 62: Middle East and Africa Medical Nutrition Industry Volume Share (%), by End User 2025 & 2033
- Figure 63: Middle East and Africa Medical Nutrition Industry Revenue (Million), by Country 2025 & 2033
- Figure 64: Middle East and Africa Medical Nutrition Industry Volume (K Unit), by Country 2025 & 2033
- Figure 65: Middle East and Africa Medical Nutrition Industry Revenue Share (%), by Country 2025 & 2033
- Figure 66: Middle East and Africa Medical Nutrition Industry Volume Share (%), by Country 2025 & 2033
- Figure 67: South America Medical Nutrition Industry Revenue (Million), by Route of Administration 2025 & 2033
- Figure 68: South America Medical Nutrition Industry Volume (K Unit), by Route of Administration 2025 & 2033
- Figure 69: South America Medical Nutrition Industry Revenue Share (%), by Route of Administration 2025 & 2033
- Figure 70: South America Medical Nutrition Industry Volume Share (%), by Route of Administration 2025 & 2033
- Figure 71: South America Medical Nutrition Industry Revenue (Million), by Application 2025 & 2033
- Figure 72: South America Medical Nutrition Industry Volume (K Unit), by Application 2025 & 2033
- Figure 73: South America Medical Nutrition Industry Revenue Share (%), by Application 2025 & 2033
- Figure 74: South America Medical Nutrition Industry Volume Share (%), by Application 2025 & 2033
- Figure 75: South America Medical Nutrition Industry Revenue (Million), by End User 2025 & 2033
- Figure 76: South America Medical Nutrition Industry Volume (K Unit), by End User 2025 & 2033
- Figure 77: South America Medical Nutrition Industry Revenue Share (%), by End User 2025 & 2033
- Figure 78: South America Medical Nutrition Industry Volume Share (%), by End User 2025 & 2033
- Figure 79: South America Medical Nutrition Industry Revenue (Million), by Country 2025 & 2033
- Figure 80: South America Medical Nutrition Industry Volume (K Unit), by Country 2025 & 2033
- Figure 81: South America Medical Nutrition Industry Revenue Share (%), by Country 2025 & 2033
- Figure 82: South America Medical Nutrition Industry Volume Share (%), by Country 2025 & 2033
List of Tables
- Table 1: Global Medical Nutrition Industry Revenue Million Forecast, by Route of Administration 2020 & 2033
- Table 2: Global Medical Nutrition Industry Volume K Unit Forecast, by Route of Administration 2020 & 2033
- Table 3: Global Medical Nutrition Industry Revenue Million Forecast, by Application 2020 & 2033
- Table 4: Global Medical Nutrition Industry Volume K Unit Forecast, by Application 2020 & 2033
- Table 5: Global Medical Nutrition Industry Revenue Million Forecast, by End User 2020 & 2033
- Table 6: Global Medical Nutrition Industry Volume K Unit Forecast, by End User 2020 & 2033
- Table 7: Global Medical Nutrition Industry Revenue Million Forecast, by Region 2020 & 2033
- Table 8: Global Medical Nutrition Industry Volume K Unit Forecast, by Region 2020 & 2033
- Table 9: Global Medical Nutrition Industry Revenue Million Forecast, by Route of Administration 2020 & 2033
- Table 10: Global Medical Nutrition Industry Volume K Unit Forecast, by Route of Administration 2020 & 2033
- Table 11: Global Medical Nutrition Industry Revenue Million Forecast, by Application 2020 & 2033
- Table 12: Global Medical Nutrition Industry Volume K Unit Forecast, by Application 2020 & 2033
- Table 13: Global Medical Nutrition Industry Revenue Million Forecast, by End User 2020 & 2033
- Table 14: Global Medical Nutrition Industry Volume K Unit Forecast, by End User 2020 & 2033
- Table 15: Global Medical Nutrition Industry Revenue Million Forecast, by Country 2020 & 2033
- Table 16: Global Medical Nutrition Industry Volume K Unit Forecast, by Country 2020 & 2033
- Table 17: United States Medical Nutrition Industry Revenue (Million) Forecast, by Application 2020 & 2033
- Table 18: United States Medical Nutrition Industry Volume (K Unit) Forecast, by Application 2020 & 2033
- Table 19: Canada Medical Nutrition Industry Revenue (Million) Forecast, by Application 2020 & 2033
- Table 20: Canada Medical Nutrition Industry Volume (K Unit) Forecast, by Application 2020 & 2033
- Table 21: Mexico Medical Nutrition Industry Revenue (Million) Forecast, by Application 2020 & 2033
- Table 22: Mexico Medical Nutrition Industry Volume (K Unit) Forecast, by Application 2020 & 2033
- Table 23: Global Medical Nutrition Industry Revenue Million Forecast, by Route of Administration 2020 & 2033
- Table 24: Global Medical Nutrition Industry Volume K Unit Forecast, by Route of Administration 2020 & 2033
- Table 25: Global Medical Nutrition Industry Revenue Million Forecast, by Application 2020 & 2033
- Table 26: Global Medical Nutrition Industry Volume K Unit Forecast, by Application 2020 & 2033
- Table 27: Global Medical Nutrition Industry Revenue Million Forecast, by End User 2020 & 2033
- Table 28: Global Medical Nutrition Industry Volume K Unit Forecast, by End User 2020 & 2033
- Table 29: Global Medical Nutrition Industry Revenue Million Forecast, by Country 2020 & 2033
- Table 30: Global Medical Nutrition Industry Volume K Unit Forecast, by Country 2020 & 2033
- Table 31: Germany Medical Nutrition Industry Revenue (Million) Forecast, by Application 2020 & 2033
- Table 32: Germany Medical Nutrition Industry Volume (K Unit) Forecast, by Application 2020 & 2033
- Table 33: United Kingdom Medical Nutrition Industry Revenue (Million) Forecast, by Application 2020 & 2033
- Table 34: United Kingdom Medical Nutrition Industry Volume (K Unit) Forecast, by Application 2020 & 2033
- Table 35: France Medical Nutrition Industry Revenue (Million) Forecast, by Application 2020 & 2033
- Table 36: France Medical Nutrition Industry Volume (K Unit) Forecast, by Application 2020 & 2033
- Table 37: Italy Medical Nutrition Industry Revenue (Million) Forecast, by Application 2020 & 2033
- Table 38: Italy Medical Nutrition Industry Volume (K Unit) Forecast, by Application 2020 & 2033
- Table 39: Spain Medical Nutrition Industry Revenue (Million) Forecast, by Application 2020 & 2033
- Table 40: Spain Medical Nutrition Industry Volume (K Unit) Forecast, by Application 2020 & 2033
- Table 41: Rest of Europe Medical Nutrition Industry Revenue (Million) Forecast, by Application 2020 & 2033
- Table 42: Rest of Europe Medical Nutrition Industry Volume (K Unit) Forecast, by Application 2020 & 2033
- Table 43: Global Medical Nutrition Industry Revenue Million Forecast, by Route of Administration 2020 & 2033
- Table 44: Global Medical Nutrition Industry Volume K Unit Forecast, by Route of Administration 2020 & 2033
- Table 45: Global Medical Nutrition Industry Revenue Million Forecast, by Application 2020 & 2033
- Table 46: Global Medical Nutrition Industry Volume K Unit Forecast, by Application 2020 & 2033
- Table 47: Global Medical Nutrition Industry Revenue Million Forecast, by End User 2020 & 2033
- Table 48: Global Medical Nutrition Industry Volume K Unit Forecast, by End User 2020 & 2033
- Table 49: Global Medical Nutrition Industry Revenue Million Forecast, by Country 2020 & 2033
- Table 50: Global Medical Nutrition Industry Volume K Unit Forecast, by Country 2020 & 2033
- Table 51: China Medical Nutrition Industry Revenue (Million) Forecast, by Application 2020 & 2033
- Table 52: China Medical Nutrition Industry Volume (K Unit) Forecast, by Application 2020 & 2033
- Table 53: Japan Medical Nutrition Industry Revenue (Million) Forecast, by Application 2020 & 2033
- Table 54: Japan Medical Nutrition Industry Volume (K Unit) Forecast, by Application 2020 & 2033
- Table 55: India Medical Nutrition Industry Revenue (Million) Forecast, by Application 2020 & 2033
- Table 56: India Medical Nutrition Industry Volume (K Unit) Forecast, by Application 2020 & 2033
- Table 57: Australia Medical Nutrition Industry Revenue (Million) Forecast, by Application 2020 & 2033
- Table 58: Australia Medical Nutrition Industry Volume (K Unit) Forecast, by Application 2020 & 2033
- Table 59: South Korea Medical Nutrition Industry Revenue (Million) Forecast, by Application 2020 & 2033
- Table 60: South Korea Medical Nutrition Industry Volume (K Unit) Forecast, by Application 2020 & 2033
- Table 61: Rest of Asia Pacific Medical Nutrition Industry Revenue (Million) Forecast, by Application 2020 & 2033
- Table 62: Rest of Asia Pacific Medical Nutrition Industry Volume (K Unit) Forecast, by Application 2020 & 2033
- Table 63: Global Medical Nutrition Industry Revenue Million Forecast, by Route of Administration 2020 & 2033
- Table 64: Global Medical Nutrition Industry Volume K Unit Forecast, by Route of Administration 2020 & 2033
- Table 65: Global Medical Nutrition Industry Revenue Million Forecast, by Application 2020 & 2033
- Table 66: Global Medical Nutrition Industry Volume K Unit Forecast, by Application 2020 & 2033
- Table 67: Global Medical Nutrition Industry Revenue Million Forecast, by End User 2020 & 2033
- Table 68: Global Medical Nutrition Industry Volume K Unit Forecast, by End User 2020 & 2033
- Table 69: Global Medical Nutrition Industry Revenue Million Forecast, by Country 2020 & 2033
- Table 70: Global Medical Nutrition Industry Volume K Unit Forecast, by Country 2020 & 2033
- Table 71: GCC Medical Nutrition Industry Revenue (Million) Forecast, by Application 2020 & 2033
- Table 72: GCC Medical Nutrition Industry Volume (K Unit) Forecast, by Application 2020 & 2033
- Table 73: South Africa Medical Nutrition Industry Revenue (Million) Forecast, by Application 2020 & 2033
- Table 74: South Africa Medical Nutrition Industry Volume (K Unit) Forecast, by Application 2020 & 2033
- Table 75: Rest of Middle East and Africa Medical Nutrition Industry Revenue (Million) Forecast, by Application 2020 & 2033
- Table 76: Rest of Middle East and Africa Medical Nutrition Industry Volume (K Unit) Forecast, by Application 2020 & 2033
- Table 77: Global Medical Nutrition Industry Revenue Million Forecast, by Route of Administration 2020 & 2033
- Table 78: Global Medical Nutrition Industry Volume K Unit Forecast, by Route of Administration 2020 & 2033
- Table 79: Global Medical Nutrition Industry Revenue Million Forecast, by Application 2020 & 2033
- Table 80: Global Medical Nutrition Industry Volume K Unit Forecast, by Application 2020 & 2033
- Table 81: Global Medical Nutrition Industry Revenue Million Forecast, by End User 2020 & 2033
- Table 82: Global Medical Nutrition Industry Volume K Unit Forecast, by End User 2020 & 2033
- Table 83: Global Medical Nutrition Industry Revenue Million Forecast, by Country 2020 & 2033
- Table 84: Global Medical Nutrition Industry Volume K Unit Forecast, by Country 2020 & 2033
- Table 85: Brazil Medical Nutrition Industry Revenue (Million) Forecast, by Application 2020 & 2033
- Table 86: Brazil Medical Nutrition Industry Volume (K Unit) Forecast, by Application 2020 & 2033
- Table 87: Argentina Medical Nutrition Industry Revenue (Million) Forecast, by Application 2020 & 2033
- Table 88: Argentina Medical Nutrition Industry Volume (K Unit) Forecast, by Application 2020 & 2033
- Table 89: Rest of South America Medical Nutrition Industry Revenue (Million) Forecast, by Application 2020 & 2033
- Table 90: Rest of South America Medical Nutrition Industry Volume (K Unit) Forecast, by Application 2020 & 2033
Frequently Asked Questions
1. What is the projected Compound Annual Growth Rate (CAGR) of the Medical Nutrition Industry?
The projected CAGR is approximately 8.05%.
2. Which companies are prominent players in the Medical Nutrition Industry?
Key companies in the market include Medifood International Ltd, Abbott Laboratories (Abbott Nutrition), Fresenius Kabi, Danone (Nutricia), Perrigo Company PLC, Nestle Health Science, Ajinomoto Cambrooke Inc (Nualtra Ltd), AYMES International Ltd, Baxter Healthcare, B Braun SE, Reckitt Benckiser.
3. What are the main segments of the Medical Nutrition Industry?
The market segments include Route of Administration, Application, End User.
4. Can you provide details about the market size?
The market size is estimated to be USD 72.29 Million as of 2022.
5. What are some drivers contributing to market growth?
Increasing Prevalence of Metabolic Disorders; High Spending on Healthcare; Growing Geriatric Population.
6. What are the notable trends driving market growth?
Oral and Enteral Segment is Expected to Hold a Significant Market Share Over the Forecast Period.
7. Are there any restraints impacting market growth?
Imprecise Perception About Clinical Nutrition; Reduction in Birth Rates.
8. Can you provide examples of recent developments in the market?
October 2022: Hologram Sciences, and Maeil Health Nutrition entered into a strategic partnership to deliver personalized nutrition solutions to the Korean market.
9. What pricing options are available for accessing the report?
Pricing options include single-user, multi-user, and enterprise licenses priced at USD 4750, USD 5250, and USD 8750 respectively.
10. Is the market size provided in terms of value or volume?
The market size is provided in terms of value, measured in Million and volume, measured in K Unit.
11. Are there any specific market keywords associated with the report?
Yes, the market keyword associated with the report is "Medical Nutrition Industry," which aids in identifying and referencing the specific market segment covered.
12. How do I determine which pricing option suits my needs best?
The pricing options vary based on user requirements and access needs. Individual users may opt for single-user licenses, while businesses requiring broader access may choose multi-user or enterprise licenses for cost-effective access to the report.
13. Are there any additional resources or data provided in the Medical Nutrition Industry report?
While the report offers comprehensive insights, it's advisable to review the specific contents or supplementary materials provided to ascertain if additional resources or data are available.
14. How can I stay updated on further developments or reports in the Medical Nutrition Industry?
To stay informed about further developments, trends, and reports in the Medical Nutrition Industry, consider subscribing to industry newsletters, following relevant companies and organizations, or regularly checking reputable industry news sources and publications.
Methodology
Step 1 - Identification of Relevant Samples Size from Population Database


Step 2 - Approaches for Defining Global Market Size (Value, Volume* & Price*)

Note*: In applicable scenarios
Step 3 - Data Sources
Primary Research
- Web Analytics
- Survey Reports
- Research Institute
- Latest Research Reports
- Opinion Leaders
Secondary Research
- Annual Reports
- White Paper
- Latest Press Release
- Industry Association
- Paid Database
- Investor Presentations

Step 4 - Data Triangulation
Involves using different sources of information in order to increase the validity of a study
These sources are likely to be stakeholders in a program - participants, other researchers, program staff, other community members, and so on.
Then we put all data in single framework & apply various statistical tools to find out the dynamic on the market.
During the analysis stage, feedback from the stakeholder groups would be compared to determine areas of agreement as well as areas of divergence