

Key Insights
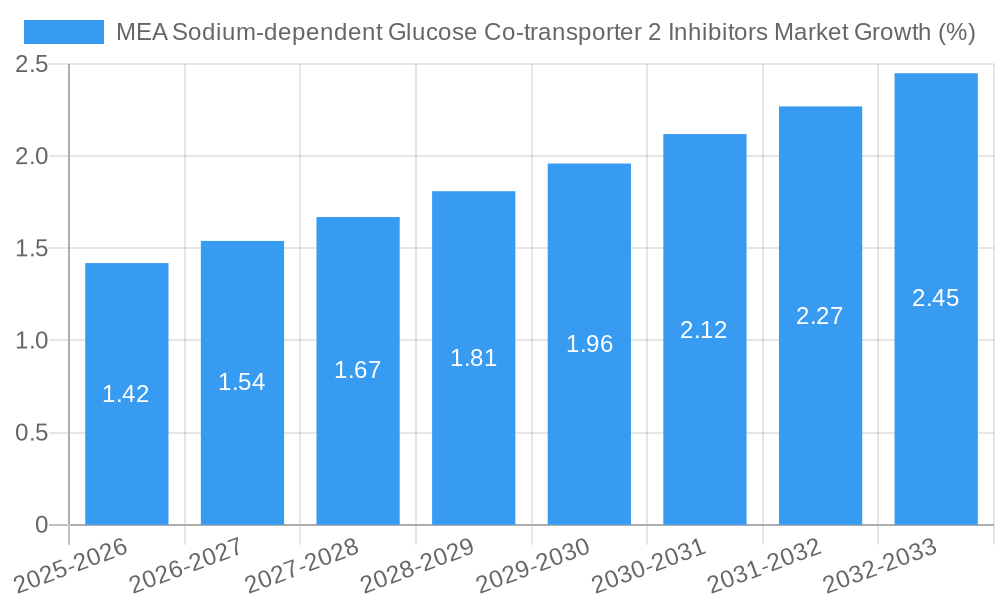
The Middle East and Africa (MEA) Sodium-dependent Glucose Co-transporter 2 (SGLT2) Inhibitors market is poised for significant growth, driven by rising prevalence of diabetes and related complications like cardiovascular disease and chronic kidney disease. The increasing awareness of SGLT2 inhibitors' effectiveness in managing these conditions, coupled with improving healthcare infrastructure and expanding access to advanced medications, will fuel market expansion. While the overall global market exhibits a Compound Annual Growth Rate (CAGR) of 9.15%, the MEA region, though currently smaller, is expected to experience a slightly higher growth rate due to a younger, rapidly growing population, increased urbanization, and a shift towards Westernized lifestyles leading to higher incidences of diabetes. However, factors such as limited healthcare access in certain regions, high medication costs, and a lack of awareness among the general population may act as restraints. Nevertheless, the market is likely to see considerable growth as pharmaceutical companies increase their investment in market penetration initiatives, educational campaigns, and improved patient affordability programs.
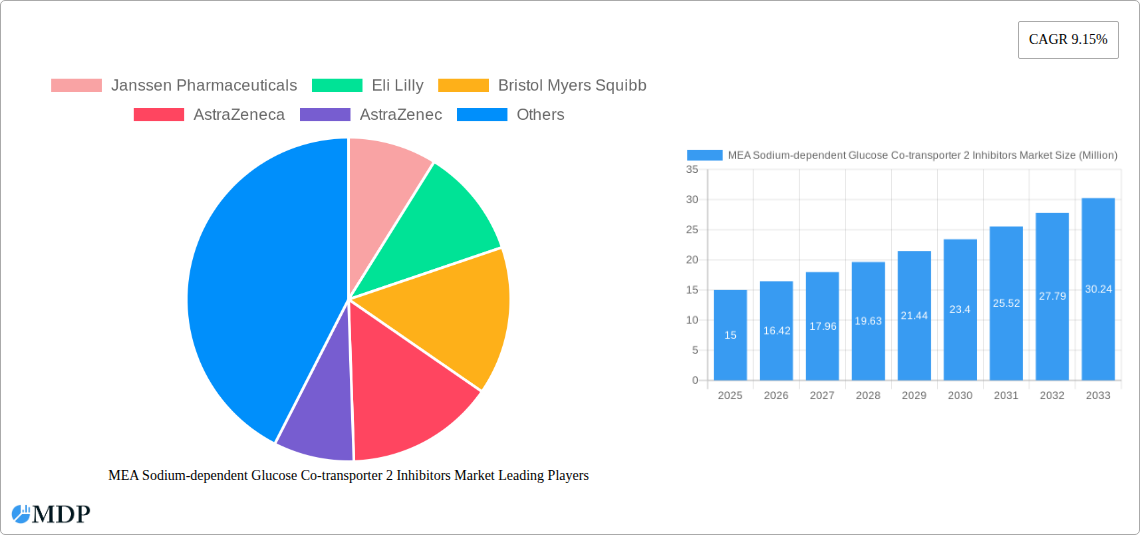
The competitive landscape in the MEA region features major global players like Janssen Pharmaceuticals, Eli Lilly, Bristol Myers Squibb, AstraZeneca, and Boehringer Ingelheim, among others. These companies are likely to compete intensely through strategies such as strategic partnerships, mergers and acquisitions, and product diversification to gain market share. The regional segmentation will predominantly follow the global trends, with significant focus on specific countries with higher diabetes prevalence and improved healthcare access. Specific growth opportunities will lie in tailoring strategies to address unique healthcare challenges and access barriers within different MEA sub-regions. Future growth will also be contingent upon regulatory approvals, successful clinical trials for improved formulations, and governmental initiatives to tackle the increasing burden of diabetes.
MEA Sodium-dependent Glucose Co-transporter 2 Inhibitors Market: A Comprehensive Report (2019-2033)
This in-depth report provides a comprehensive analysis of the Middle East and Africa (MEA) Sodium-dependent Glucose Co-transporter 2 (SGLT2) Inhibitors market, covering market dynamics, industry trends, leading players, and future growth prospects. The study period spans 2019-2033, with 2025 serving as the base and estimated year. This report is crucial for stakeholders seeking actionable insights to navigate this dynamic market.
MEA Sodium-dependent Glucose Co-transporter 2 Inhibitors Market Market Dynamics & Concentration
This section analyzes the MEA SGLT2 inhibitors market concentration, identifying key drivers of innovation, regulatory influences, substitute products, and end-user trends. It further explores mergers and acquisitions (M&A) activity within the industry.
The MEA SGLT2 inhibitor market exhibits a moderately concentrated structure, with a few major players holding significant market share. The market share distribution among top players is estimated to be as follows in 2025: Janssen Pharmaceuticals (xx%), Eli Lilly (xx%), Bristol Myers Squibb (xx%), AstraZeneca (xx%), Boehringer Ingelheim (xx%), with remaining share held by other companies. The overall market concentration ratio (CR4) is estimated at xx%.
Market Dynamics:
- Innovation Drivers: Ongoing research and development efforts focused on improving efficacy, safety, and convenience of SGLT2 inhibitors are driving market growth. Development of novel formulations and combination therapies are key aspects.
- Regulatory Frameworks: Stringent regulatory approvals and pricing policies across different MEA countries influence market access and growth. Variations in regulatory pathways across different nations within the MEA region influence market penetration.
- Product Substitutes: Other anti-diabetic medications and treatments for cardiovascular diseases present competitive challenges for SGLT2 inhibitors. The presence of alternative therapies impacts market share and growth trajectories.
- End-User Trends: The increasing prevalence of diabetes and cardiovascular diseases in the MEA region is driving demand for SGLT2 inhibitors. Growing awareness regarding the benefits of SGLT2 inhibitors among healthcare professionals and patients is contributing to market expansion.
- M&A Activities: The number of M&A deals in the MEA SGLT2 inhibitor market between 2019 and 2024 is estimated at xx, reflecting strategic efforts by pharmaceutical companies to expand their market presence and portfolios.
MEA Sodium-dependent Glucose Co-transporter 2 Inhibitors Market Industry Trends & Analysis
This section delves into the market growth drivers, technological advancements, evolving consumer preferences, and competitive landscape influencing the MEA SGLT2 inhibitor market.
The MEA SGLT2 inhibitor market is projected to witness a Compound Annual Growth Rate (CAGR) of xx% during the forecast period (2025-2033). This growth is fueled by factors such as increasing prevalence of diabetes and cardiovascular diseases, rising healthcare expenditure, and growing awareness among patients and healthcare providers. Market penetration of SGLT2 inhibitors in the MEA region is currently estimated at xx%, with significant potential for further expansion.
Technological disruptions, including the development of innovative formulations and combination therapies, are altering the competitive landscape. Consumer preferences are shifting towards more convenient and efficacious treatment options, influencing product development and marketing strategies. The competitive dynamics are characterized by intense rivalry among established pharmaceutical companies and emerging players.
Leading Markets & Segments in MEA Sodium-dependent Glucose Co-transporter 2 Inhibitors Market
This section highlights the leading regions, countries, and segments within the MEA SGLT2 inhibitor market. The analysis focuses on the drug segment, specifically Sodium-dependent Glucose Co-transporter 2 (SGLT2) Inhibitors.
Dominant Region/Country: Currently, [Name of country with largest market share - e.g., Egypt or South Africa] holds the dominant position in the MEA SGLT2 inhibitor market due to [reason for dominance - e.g., high prevalence of diabetes, established healthcare infrastructure, strong pharmaceutical industry].
Key Drivers:
- Economic Policies: Government initiatives promoting healthcare access and affordability play a significant role in market growth within the dominant region.
- Healthcare Infrastructure: Well-developed healthcare infrastructure, including hospitals and clinics, facilitates market penetration and accessibility.
- Disease Prevalence: High prevalence of target diseases (diabetes, heart failure) contributes significantly to market demand.
A detailed dominance analysis, including market size, growth rate, and contributing factors, provides insight into the market’s regional distribution and characteristics. [Expand with further detailed analysis of specific regional markets]
MEA Sodium-dependent Glucose Co-transporter 2 Inhibitors Market Product Developments
The MEA SGLT2 inhibitor market is witnessing continuous product innovation. Recent advancements include the development of novel formulations designed to enhance patient adherence and improve efficacy. The focus on combination therapies, integrating SGLT2 inhibitors with other diabetes medications, offers enhanced therapeutic benefits and a competitive edge. These developments address unmet clinical needs and contribute to the market's expansion.
Key Drivers of MEA Sodium-dependent Glucose Co-transporter 2 Inhibitors Market Growth
Several factors are driving the growth of the MEA SGLT2 inhibitor market. These include the rising prevalence of chronic diseases such as type 2 diabetes and heart failure, increased healthcare expenditure, growing awareness about the benefits of SGLT2 inhibitors, and supportive regulatory frameworks. Government initiatives to improve access to healthcare also contribute significantly. Technological advancements, such as development of novel formulations and combination therapies, are further enhancing market growth.
Challenges in the MEA Sodium-dependent Glucose Co-transporter 2 Inhibitors Market Market
The MEA SGLT2 inhibitor market faces challenges, including high cost of treatment limiting affordability and accessibility. Variations in healthcare infrastructure across the region hinder market penetration. Competition from existing and emerging anti-diabetic and cardiovascular medications also presents a challenge. The reimbursement policies and regulatory approval processes can vary significantly across different countries, creating complexity and potential delays for market entry.
Emerging Opportunities in MEA Sodium-dependent Glucose Co-transporter 2 Inhibitors Market
The long-term growth of the MEA SGLT2 inhibitor market is supported by several emerging opportunities. These include the potential for increased market penetration in underserved regions with high disease prevalence, expansion into new indications, and development of innovative combination therapies. Strategic partnerships and collaborations among pharmaceutical companies will create opportunities for faster adoption. Focus on patient education and improved access are crucial in maximizing the market's potential.
Leading Players in the MEA Sodium-dependent Glucose Co-transporter 2 Inhibitors Market Sector
- Janssen Pharmaceuticals
- Eli Lilly
- Bristol Myers Squibb
- AstraZeneca
- Boehringer Ingelheim
Key Milestones in MEA Sodium-dependent Glucose Co-transporter 2 Inhibitors Market Industry
- April 2022: Approval of Jardiance (SGLT2 inhibitor) for use in heart failure, expanding its therapeutic application and market potential.
- March 2022: A cost-effectiveness study in Egypt demonstrated the significant value of Dapagliflozin in treating heart failure, supporting its wider adoption.
Strategic Outlook for MEA Sodium-dependent Glucose Co-transporter 2 Inhibitors Market Market
The MEA SGLT2 inhibitor market holds substantial future potential, driven by a growing prevalence of chronic diseases, supportive government policies, and ongoing technological advancements. Strategic opportunities lie in focusing on improving patient access through innovative pricing and distribution models. Investing in research and development of next-generation SGLT2 inhibitors and combination therapies will be crucial for sustained growth and market leadership. Strategic partnerships and collaborations can accelerate market penetration and expand the reach of these life-changing medications.
MEA Sodium-dependent Glucose Co-transporter 2 Inhibitors Market Segmentation
-
1. Drug
-
1.1. Sodium-d
- 1.1.1. Invokana (Canagliflozin)
- 1.1.2. Jardiance (Empagliflozin)
- 1.1.3. Farxiga/Forxiga (Dapagliflozin)
-
1.1. Sodium-d
-
2. Geography
- 2.1. Saudi Arabia
- 2.2. Iran
- 2.3. Egypt
- 2.4. Oman
- 2.5. South Africa
- 2.6. Rest of Middle-East and Africa
MEA Sodium-dependent Glucose Co-transporter 2 Inhibitors Market Segmentation By Geography
- 1. Saudi Arabia
- 2. Iran
- 3. Egypt
- 4. Oman
- 5. South Africa
- 6. Rest of Middle East and Africa
MEA Sodium-dependent Glucose Co-transporter 2 Inhibitors Market REPORT HIGHLIGHTS
| Aspects | Details |
|---|---|
| Study Period | 2019-2033 |
| Base Year | 2024 |
| Estimated Year | 2025 |
| Forecast Period | 2025-2033 |
| Historical Period | 2019-2024 |
| Growth Rate | CAGR of 9.15% from 2019-2033 |
| Segmentation |
|
Table of Contents
- 1. Introduction
- 1.1. Research Scope
- 1.2. Market Segmentation
- 1.3. Research Methodology
- 1.4. Definitions and Assumptions
- 2. Executive Summary
- 2.1. Introduction
- 3. Market Dynamics
- 3.1. Introduction
- 3.2. Market Drivers
- 3.2.1. Increasing Prevalence of Genitourinary Disorders; Increasing Number of Pipeline Products
- 3.3. Market Restrains
- 3.3.1. Lack of Therapy Compliance; Increasing Advent of Counterfeit Drugs
- 3.4. Market Trends
- 3.4.1. Increasing Diabetic Population is Supporting the SGLT 2 Inhibitors Market to Grow in the Middle-East and Africa Region
- 4. Market Factor Analysis
- 4.1. Porters Five Forces
- 4.2. Supply/Value Chain
- 4.3. PESTEL analysis
- 4.4. Market Entropy
- 4.5. Patent/Trademark Analysis
- 5. Global MEA Sodium-dependent Glucose Co-transporter 2 Inhibitors Market Analysis, Insights and Forecast, 2019-2031
- 5.1. Market Analysis, Insights and Forecast - by Drug
- 5.1.1. Sodium-d
- 5.1.1.1. Invokana (Canagliflozin)
- 5.1.1.2. Jardiance (Empagliflozin)
- 5.1.1.3. Farxiga/Forxiga (Dapagliflozin)
- 5.1.1. Sodium-d
- 5.2. Market Analysis, Insights and Forecast - by Geography
- 5.2.1. Saudi Arabia
- 5.2.2. Iran
- 5.2.3. Egypt
- 5.2.4. Oman
- 5.2.5. South Africa
- 5.2.6. Rest of Middle-East and Africa
- 5.3. Market Analysis, Insights and Forecast - by Region
- 5.3.1. Saudi Arabia
- 5.3.2. Iran
- 5.3.3. Egypt
- 5.3.4. Oman
- 5.3.5. South Africa
- 5.3.6. Rest of Middle East and Africa
- 5.1. Market Analysis, Insights and Forecast - by Drug
- 6. Saudi Arabia MEA Sodium-dependent Glucose Co-transporter 2 Inhibitors Market Analysis, Insights and Forecast, 2019-2031
- 6.1. Market Analysis, Insights and Forecast - by Drug
- 6.1.1. Sodium-d
- 6.1.1.1. Invokana (Canagliflozin)
- 6.1.1.2. Jardiance (Empagliflozin)
- 6.1.1.3. Farxiga/Forxiga (Dapagliflozin)
- 6.1.1. Sodium-d
- 6.2. Market Analysis, Insights and Forecast - by Geography
- 6.2.1. Saudi Arabia
- 6.2.2. Iran
- 6.2.3. Egypt
- 6.2.4. Oman
- 6.2.5. South Africa
- 6.2.6. Rest of Middle-East and Africa
- 6.1. Market Analysis, Insights and Forecast - by Drug
- 7. Iran MEA Sodium-dependent Glucose Co-transporter 2 Inhibitors Market Analysis, Insights and Forecast, 2019-2031
- 7.1. Market Analysis, Insights and Forecast - by Drug
- 7.1.1. Sodium-d
- 7.1.1.1. Invokana (Canagliflozin)
- 7.1.1.2. Jardiance (Empagliflozin)
- 7.1.1.3. Farxiga/Forxiga (Dapagliflozin)
- 7.1.1. Sodium-d
- 7.2. Market Analysis, Insights and Forecast - by Geography
- 7.2.1. Saudi Arabia
- 7.2.2. Iran
- 7.2.3. Egypt
- 7.2.4. Oman
- 7.2.5. South Africa
- 7.2.6. Rest of Middle-East and Africa
- 7.1. Market Analysis, Insights and Forecast - by Drug
- 8. Egypt MEA Sodium-dependent Glucose Co-transporter 2 Inhibitors Market Analysis, Insights and Forecast, 2019-2031
- 8.1. Market Analysis, Insights and Forecast - by Drug
- 8.1.1. Sodium-d
- 8.1.1.1. Invokana (Canagliflozin)
- 8.1.1.2. Jardiance (Empagliflozin)
- 8.1.1.3. Farxiga/Forxiga (Dapagliflozin)
- 8.1.1. Sodium-d
- 8.2. Market Analysis, Insights and Forecast - by Geography
- 8.2.1. Saudi Arabia
- 8.2.2. Iran
- 8.2.3. Egypt
- 8.2.4. Oman
- 8.2.5. South Africa
- 8.2.6. Rest of Middle-East and Africa
- 8.1. Market Analysis, Insights and Forecast - by Drug
- 9. Oman MEA Sodium-dependent Glucose Co-transporter 2 Inhibitors Market Analysis, Insights and Forecast, 2019-2031
- 9.1. Market Analysis, Insights and Forecast - by Drug
- 9.1.1. Sodium-d
- 9.1.1.1. Invokana (Canagliflozin)
- 9.1.1.2. Jardiance (Empagliflozin)
- 9.1.1.3. Farxiga/Forxiga (Dapagliflozin)
- 9.1.1. Sodium-d
- 9.2. Market Analysis, Insights and Forecast - by Geography
- 9.2.1. Saudi Arabia
- 9.2.2. Iran
- 9.2.3. Egypt
- 9.2.4. Oman
- 9.2.5. South Africa
- 9.2.6. Rest of Middle-East and Africa
- 9.1. Market Analysis, Insights and Forecast - by Drug
- 10. South Africa MEA Sodium-dependent Glucose Co-transporter 2 Inhibitors Market Analysis, Insights and Forecast, 2019-2031
- 10.1. Market Analysis, Insights and Forecast - by Drug
- 10.1.1. Sodium-d
- 10.1.1.1. Invokana (Canagliflozin)
- 10.1.1.2. Jardiance (Empagliflozin)
- 10.1.1.3. Farxiga/Forxiga (Dapagliflozin)
- 10.1.1. Sodium-d
- 10.2. Market Analysis, Insights and Forecast - by Geography
- 10.2.1. Saudi Arabia
- 10.2.2. Iran
- 10.2.3. Egypt
- 10.2.4. Oman
- 10.2.5. South Africa
- 10.2.6. Rest of Middle-East and Africa
- 10.1. Market Analysis, Insights and Forecast - by Drug
- 11. Rest of Middle East and Africa MEA Sodium-dependent Glucose Co-transporter 2 Inhibitors Market Analysis, Insights and Forecast, 2019-2031
- 11.1. Market Analysis, Insights and Forecast - by Drug
- 11.1.1. Sodium-d
- 11.1.1.1. Invokana (Canagliflozin)
- 11.1.1.2. Jardiance (Empagliflozin)
- 11.1.1.3. Farxiga/Forxiga (Dapagliflozin)
- 11.1.1. Sodium-d
- 11.2. Market Analysis, Insights and Forecast - by Geography
- 11.2.1. Saudi Arabia
- 11.2.2. Iran
- 11.2.3. Egypt
- 11.2.4. Oman
- 11.2.5. South Africa
- 11.2.6. Rest of Middle-East and Africa
- 11.1. Market Analysis, Insights and Forecast - by Drug
- 12. North America MEA Sodium-dependent Glucose Co-transporter 2 Inhibitors Market Analysis, Insights and Forecast, 2019-2031
- 12.1. Market Analysis, Insights and Forecast - By Country/Sub-region
- 12.1.1 United States
- 12.1.2 Canada
- 12.1.3 Mexico
- 13. Europe MEA Sodium-dependent Glucose Co-transporter 2 Inhibitors Market Analysis, Insights and Forecast, 2019-2031
- 13.1. Market Analysis, Insights and Forecast - By Country/Sub-region
- 13.1.1 Germany
- 13.1.2 United Kingdom
- 13.1.3 France
- 13.1.4 Spain
- 13.1.5 Italy
- 13.1.6 Spain
- 13.1.7 Belgium
- 13.1.8 Netherland
- 13.1.9 Nordics
- 13.1.10 Rest of Europe
- 14. Asia Pacific MEA Sodium-dependent Glucose Co-transporter 2 Inhibitors Market Analysis, Insights and Forecast, 2019-2031
- 14.1. Market Analysis, Insights and Forecast - By Country/Sub-region
- 14.1.1 China
- 14.1.2 Japan
- 14.1.3 India
- 14.1.4 South Korea
- 14.1.5 Southeast Asia
- 14.1.6 Australia
- 14.1.7 Indonesia
- 14.1.8 Phillipes
- 14.1.9 Singapore
- 14.1.10 Thailandc
- 14.1.11 Rest of Asia Pacific
- 15. South America MEA Sodium-dependent Glucose Co-transporter 2 Inhibitors Market Analysis, Insights and Forecast, 2019-2031
- 15.1. Market Analysis, Insights and Forecast - By Country/Sub-region
- 15.1.1 Brazil
- 15.1.2 Argentina
- 15.1.3 Peru
- 15.1.4 Chile
- 15.1.5 Colombia
- 15.1.6 Ecuador
- 15.1.7 Venezuela
- 15.1.8 Rest of South America
- 16. MEA MEA Sodium-dependent Glucose Co-transporter 2 Inhibitors Market Analysis, Insights and Forecast, 2019-2031
- 16.1. Market Analysis, Insights and Forecast - By Country/Sub-region
- 16.1.1 United Arab Emirates
- 16.1.2 Saudi Arabia
- 16.1.3 South Africa
- 16.1.4 Rest of Middle East and Africa
- 17. Competitive Analysis
- 17.1. Global Market Share Analysis 2024
- 17.2. Company Profiles
- 17.2.1 Janssen Pharmaceuticals
- 17.2.1.1. Overview
- 17.2.1.2. Products
- 17.2.1.3. SWOT Analysis
- 17.2.1.4. Recent Developments
- 17.2.1.5. Financials (Based on Availability)
- 17.2.2 Eli Lilly
- 17.2.2.1. Overview
- 17.2.2.2. Products
- 17.2.2.3. SWOT Analysis
- 17.2.2.4. Recent Developments
- 17.2.2.5. Financials (Based on Availability)
- 17.2.3 Bristol Myers Squibb
- 17.2.3.1. Overview
- 17.2.3.2. Products
- 17.2.3.3. SWOT Analysis
- 17.2.3.4. Recent Developments
- 17.2.3.5. Financials (Based on Availability)
- 17.2.4 AstraZeneca
- 17.2.4.1. Overview
- 17.2.4.2. Products
- 17.2.4.3. SWOT Analysis
- 17.2.4.4. Recent Developments
- 17.2.4.5. Financials (Based on Availability)
- 17.2.5 AstraZenec
- 17.2.5.1. Overview
- 17.2.5.2. Products
- 17.2.5.3. SWOT Analysis
- 17.2.5.4. Recent Developments
- 17.2.5.5. Financials (Based on Availability)
- 17.2.6 Boehringer Ingelheim
- 17.2.6.1. Overview
- 17.2.6.2. Products
- 17.2.6.3. SWOT Analysis
- 17.2.6.4. Recent Developments
- 17.2.6.5. Financials (Based on Availability)
- 17.2.7 7 COMPETITIVE LANDSCAPE7 1 COMPANY PROFILES
- 17.2.7.1. Overview
- 17.2.7.2. Products
- 17.2.7.3. SWOT Analysis
- 17.2.7.4. Recent Developments
- 17.2.7.5. Financials (Based on Availability)
- 17.2.1 Janssen Pharmaceuticals
List of Figures
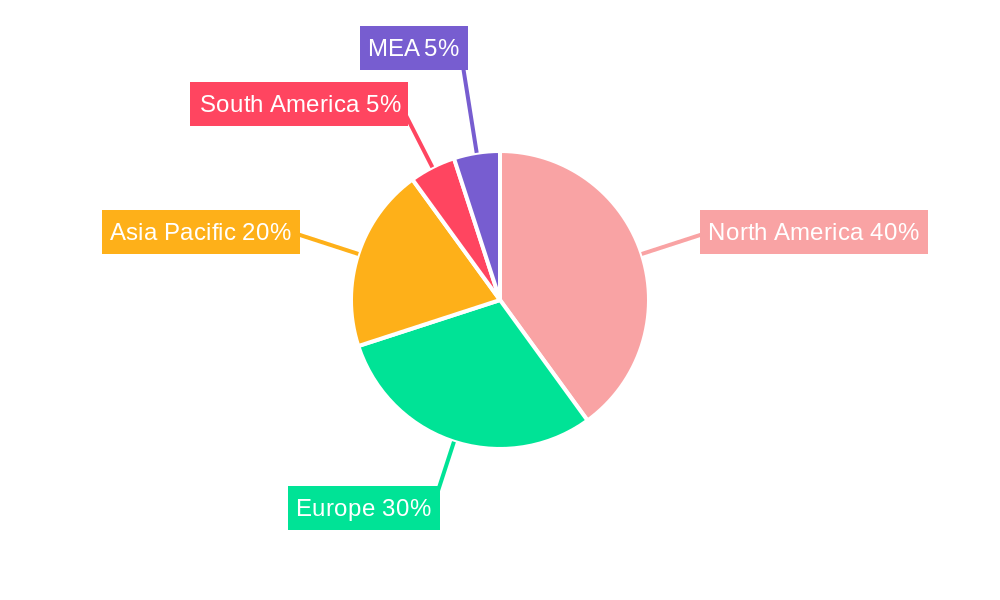
- Figure 1: Global MEA Sodium-dependent Glucose Co-transporter 2 Inhibitors Market Revenue Breakdown (Million, %) by Region 2024 & 2032
- Figure 2: North America MEA Sodium-dependent Glucose Co-transporter 2 Inhibitors Market Revenue (Million), by Country 2024 & 2032
- Figure 3: North America MEA Sodium-dependent Glucose Co-transporter 2 Inhibitors Market Revenue Share (%), by Country 2024 & 2032
- Figure 4: Europe MEA Sodium-dependent Glucose Co-transporter 2 Inhibitors Market Revenue (Million), by Country 2024 & 2032
- Figure 5: Europe MEA Sodium-dependent Glucose Co-transporter 2 Inhibitors Market Revenue Share (%), by Country 2024 & 2032
- Figure 6: Asia Pacific MEA Sodium-dependent Glucose Co-transporter 2 Inhibitors Market Revenue (Million), by Country 2024 & 2032
- Figure 7: Asia Pacific MEA Sodium-dependent Glucose Co-transporter 2 Inhibitors Market Revenue Share (%), by Country 2024 & 2032
- Figure 8: South America MEA Sodium-dependent Glucose Co-transporter 2 Inhibitors Market Revenue (Million), by Country 2024 & 2032
- Figure 9: South America MEA Sodium-dependent Glucose Co-transporter 2 Inhibitors Market Revenue Share (%), by Country 2024 & 2032
- Figure 10: MEA MEA Sodium-dependent Glucose Co-transporter 2 Inhibitors Market Revenue (Million), by Country 2024 & 2032
- Figure 11: MEA MEA Sodium-dependent Glucose Co-transporter 2 Inhibitors Market Revenue Share (%), by Country 2024 & 2032
- Figure 12: Saudi Arabia MEA Sodium-dependent Glucose Co-transporter 2 Inhibitors Market Revenue (Million), by Drug 2024 & 2032
- Figure 13: Saudi Arabia MEA Sodium-dependent Glucose Co-transporter 2 Inhibitors Market Revenue Share (%), by Drug 2024 & 2032
- Figure 14: Saudi Arabia MEA Sodium-dependent Glucose Co-transporter 2 Inhibitors Market Revenue (Million), by Geography 2024 & 2032
- Figure 15: Saudi Arabia MEA Sodium-dependent Glucose Co-transporter 2 Inhibitors Market Revenue Share (%), by Geography 2024 & 2032
- Figure 16: Saudi Arabia MEA Sodium-dependent Glucose Co-transporter 2 Inhibitors Market Revenue (Million), by Country 2024 & 2032
- Figure 17: Saudi Arabia MEA Sodium-dependent Glucose Co-transporter 2 Inhibitors Market Revenue Share (%), by Country 2024 & 2032
- Figure 18: Iran MEA Sodium-dependent Glucose Co-transporter 2 Inhibitors Market Revenue (Million), by Drug 2024 & 2032
- Figure 19: Iran MEA Sodium-dependent Glucose Co-transporter 2 Inhibitors Market Revenue Share (%), by Drug 2024 & 2032
- Figure 20: Iran MEA Sodium-dependent Glucose Co-transporter 2 Inhibitors Market Revenue (Million), by Geography 2024 & 2032
- Figure 21: Iran MEA Sodium-dependent Glucose Co-transporter 2 Inhibitors Market Revenue Share (%), by Geography 2024 & 2032
- Figure 22: Iran MEA Sodium-dependent Glucose Co-transporter 2 Inhibitors Market Revenue (Million), by Country 2024 & 2032
- Figure 23: Iran MEA Sodium-dependent Glucose Co-transporter 2 Inhibitors Market Revenue Share (%), by Country 2024 & 2032
- Figure 24: Egypt MEA Sodium-dependent Glucose Co-transporter 2 Inhibitors Market Revenue (Million), by Drug 2024 & 2032
- Figure 25: Egypt MEA Sodium-dependent Glucose Co-transporter 2 Inhibitors Market Revenue Share (%), by Drug 2024 & 2032
- Figure 26: Egypt MEA Sodium-dependent Glucose Co-transporter 2 Inhibitors Market Revenue (Million), by Geography 2024 & 2032
- Figure 27: Egypt MEA Sodium-dependent Glucose Co-transporter 2 Inhibitors Market Revenue Share (%), by Geography 2024 & 2032
- Figure 28: Egypt MEA Sodium-dependent Glucose Co-transporter 2 Inhibitors Market Revenue (Million), by Country 2024 & 2032
- Figure 29: Egypt MEA Sodium-dependent Glucose Co-transporter 2 Inhibitors Market Revenue Share (%), by Country 2024 & 2032
- Figure 30: Oman MEA Sodium-dependent Glucose Co-transporter 2 Inhibitors Market Revenue (Million), by Drug 2024 & 2032
- Figure 31: Oman MEA Sodium-dependent Glucose Co-transporter 2 Inhibitors Market Revenue Share (%), by Drug 2024 & 2032
- Figure 32: Oman MEA Sodium-dependent Glucose Co-transporter 2 Inhibitors Market Revenue (Million), by Geography 2024 & 2032
- Figure 33: Oman MEA Sodium-dependent Glucose Co-transporter 2 Inhibitors Market Revenue Share (%), by Geography 2024 & 2032
- Figure 34: Oman MEA Sodium-dependent Glucose Co-transporter 2 Inhibitors Market Revenue (Million), by Country 2024 & 2032
- Figure 35: Oman MEA Sodium-dependent Glucose Co-transporter 2 Inhibitors Market Revenue Share (%), by Country 2024 & 2032
- Figure 36: South Africa MEA Sodium-dependent Glucose Co-transporter 2 Inhibitors Market Revenue (Million), by Drug 2024 & 2032
- Figure 37: South Africa MEA Sodium-dependent Glucose Co-transporter 2 Inhibitors Market Revenue Share (%), by Drug 2024 & 2032
- Figure 38: South Africa MEA Sodium-dependent Glucose Co-transporter 2 Inhibitors Market Revenue (Million), by Geography 2024 & 2032
- Figure 39: South Africa MEA Sodium-dependent Glucose Co-transporter 2 Inhibitors Market Revenue Share (%), by Geography 2024 & 2032
- Figure 40: South Africa MEA Sodium-dependent Glucose Co-transporter 2 Inhibitors Market Revenue (Million), by Country 2024 & 2032
- Figure 41: South Africa MEA Sodium-dependent Glucose Co-transporter 2 Inhibitors Market Revenue Share (%), by Country 2024 & 2032
- Figure 42: Rest of Middle East and Africa MEA Sodium-dependent Glucose Co-transporter 2 Inhibitors Market Revenue (Million), by Drug 2024 & 2032
- Figure 43: Rest of Middle East and Africa MEA Sodium-dependent Glucose Co-transporter 2 Inhibitors Market Revenue Share (%), by Drug 2024 & 2032
- Figure 44: Rest of Middle East and Africa MEA Sodium-dependent Glucose Co-transporter 2 Inhibitors Market Revenue (Million), by Geography 2024 & 2032
- Figure 45: Rest of Middle East and Africa MEA Sodium-dependent Glucose Co-transporter 2 Inhibitors Market Revenue Share (%), by Geography 2024 & 2032
- Figure 46: Rest of Middle East and Africa MEA Sodium-dependent Glucose Co-transporter 2 Inhibitors Market Revenue (Million), by Country 2024 & 2032
- Figure 47: Rest of Middle East and Africa MEA Sodium-dependent Glucose Co-transporter 2 Inhibitors Market Revenue Share (%), by Country 2024 & 2032
List of Tables
- Table 1: Global MEA Sodium-dependent Glucose Co-transporter 2 Inhibitors Market Revenue Million Forecast, by Region 2019 & 2032
- Table 2: Global MEA Sodium-dependent Glucose Co-transporter 2 Inhibitors Market Revenue Million Forecast, by Drug 2019 & 2032
- Table 3: Global MEA Sodium-dependent Glucose Co-transporter 2 Inhibitors Market Revenue Million Forecast, by Geography 2019 & 2032
- Table 4: Global MEA Sodium-dependent Glucose Co-transporter 2 Inhibitors Market Revenue Million Forecast, by Region 2019 & 2032
- Table 5: Global MEA Sodium-dependent Glucose Co-transporter 2 Inhibitors Market Revenue Million Forecast, by Country 2019 & 2032
- Table 6: United States MEA Sodium-dependent Glucose Co-transporter 2 Inhibitors Market Revenue (Million) Forecast, by Application 2019 & 2032
- Table 7: Canada MEA Sodium-dependent Glucose Co-transporter 2 Inhibitors Market Revenue (Million) Forecast, by Application 2019 & 2032
- Table 8: Mexico MEA Sodium-dependent Glucose Co-transporter 2 Inhibitors Market Revenue (Million) Forecast, by Application 2019 & 2032
- Table 9: Global MEA Sodium-dependent Glucose Co-transporter 2 Inhibitors Market Revenue Million Forecast, by Country 2019 & 2032
- Table 10: Germany MEA Sodium-dependent Glucose Co-transporter 2 Inhibitors Market Revenue (Million) Forecast, by Application 2019 & 2032
- Table 11: United Kingdom MEA Sodium-dependent Glucose Co-transporter 2 Inhibitors Market Revenue (Million) Forecast, by Application 2019 & 2032
- Table 12: France MEA Sodium-dependent Glucose Co-transporter 2 Inhibitors Market Revenue (Million) Forecast, by Application 2019 & 2032
- Table 13: Spain MEA Sodium-dependent Glucose Co-transporter 2 Inhibitors Market Revenue (Million) Forecast, by Application 2019 & 2032
- Table 14: Italy MEA Sodium-dependent Glucose Co-transporter 2 Inhibitors Market Revenue (Million) Forecast, by Application 2019 & 2032
- Table 15: Spain MEA Sodium-dependent Glucose Co-transporter 2 Inhibitors Market Revenue (Million) Forecast, by Application 2019 & 2032
- Table 16: Belgium MEA Sodium-dependent Glucose Co-transporter 2 Inhibitors Market Revenue (Million) Forecast, by Application 2019 & 2032
- Table 17: Netherland MEA Sodium-dependent Glucose Co-transporter 2 Inhibitors Market Revenue (Million) Forecast, by Application 2019 & 2032
- Table 18: Nordics MEA Sodium-dependent Glucose Co-transporter 2 Inhibitors Market Revenue (Million) Forecast, by Application 2019 & 2032
- Table 19: Rest of Europe MEA Sodium-dependent Glucose Co-transporter 2 Inhibitors Market Revenue (Million) Forecast, by Application 2019 & 2032
- Table 20: Global MEA Sodium-dependent Glucose Co-transporter 2 Inhibitors Market Revenue Million Forecast, by Country 2019 & 2032
- Table 21: China MEA Sodium-dependent Glucose Co-transporter 2 Inhibitors Market Revenue (Million) Forecast, by Application 2019 & 2032
- Table 22: Japan MEA Sodium-dependent Glucose Co-transporter 2 Inhibitors Market Revenue (Million) Forecast, by Application 2019 & 2032
- Table 23: India MEA Sodium-dependent Glucose Co-transporter 2 Inhibitors Market Revenue (Million) Forecast, by Application 2019 & 2032
- Table 24: South Korea MEA Sodium-dependent Glucose Co-transporter 2 Inhibitors Market Revenue (Million) Forecast, by Application 2019 & 2032
- Table 25: Southeast Asia MEA Sodium-dependent Glucose Co-transporter 2 Inhibitors Market Revenue (Million) Forecast, by Application 2019 & 2032
- Table 26: Australia MEA Sodium-dependent Glucose Co-transporter 2 Inhibitors Market Revenue (Million) Forecast, by Application 2019 & 2032
- Table 27: Indonesia MEA Sodium-dependent Glucose Co-transporter 2 Inhibitors Market Revenue (Million) Forecast, by Application 2019 & 2032
- Table 28: Phillipes MEA Sodium-dependent Glucose Co-transporter 2 Inhibitors Market Revenue (Million) Forecast, by Application 2019 & 2032
- Table 29: Singapore MEA Sodium-dependent Glucose Co-transporter 2 Inhibitors Market Revenue (Million) Forecast, by Application 2019 & 2032
- Table 30: Thailandc MEA Sodium-dependent Glucose Co-transporter 2 Inhibitors Market Revenue (Million) Forecast, by Application 2019 & 2032
- Table 31: Rest of Asia Pacific MEA Sodium-dependent Glucose Co-transporter 2 Inhibitors Market Revenue (Million) Forecast, by Application 2019 & 2032
- Table 32: Global MEA Sodium-dependent Glucose Co-transporter 2 Inhibitors Market Revenue Million Forecast, by Country 2019 & 2032
- Table 33: Brazil MEA Sodium-dependent Glucose Co-transporter 2 Inhibitors Market Revenue (Million) Forecast, by Application 2019 & 2032
- Table 34: Argentina MEA Sodium-dependent Glucose Co-transporter 2 Inhibitors Market Revenue (Million) Forecast, by Application 2019 & 2032
- Table 35: Peru MEA Sodium-dependent Glucose Co-transporter 2 Inhibitors Market Revenue (Million) Forecast, by Application 2019 & 2032
- Table 36: Chile MEA Sodium-dependent Glucose Co-transporter 2 Inhibitors Market Revenue (Million) Forecast, by Application 2019 & 2032
- Table 37: Colombia MEA Sodium-dependent Glucose Co-transporter 2 Inhibitors Market Revenue (Million) Forecast, by Application 2019 & 2032
- Table 38: Ecuador MEA Sodium-dependent Glucose Co-transporter 2 Inhibitors Market Revenue (Million) Forecast, by Application 2019 & 2032
- Table 39: Venezuela MEA Sodium-dependent Glucose Co-transporter 2 Inhibitors Market Revenue (Million) Forecast, by Application 2019 & 2032
- Table 40: Rest of South America MEA Sodium-dependent Glucose Co-transporter 2 Inhibitors Market Revenue (Million) Forecast, by Application 2019 & 2032
- Table 41: Global MEA Sodium-dependent Glucose Co-transporter 2 Inhibitors Market Revenue Million Forecast, by Country 2019 & 2032
- Table 42: United Arab Emirates MEA Sodium-dependent Glucose Co-transporter 2 Inhibitors Market Revenue (Million) Forecast, by Application 2019 & 2032
- Table 43: Saudi Arabia MEA Sodium-dependent Glucose Co-transporter 2 Inhibitors Market Revenue (Million) Forecast, by Application 2019 & 2032
- Table 44: South Africa MEA Sodium-dependent Glucose Co-transporter 2 Inhibitors Market Revenue (Million) Forecast, by Application 2019 & 2032
- Table 45: Rest of Middle East and Africa MEA Sodium-dependent Glucose Co-transporter 2 Inhibitors Market Revenue (Million) Forecast, by Application 2019 & 2032
- Table 46: Global MEA Sodium-dependent Glucose Co-transporter 2 Inhibitors Market Revenue Million Forecast, by Drug 2019 & 2032
- Table 47: Global MEA Sodium-dependent Glucose Co-transporter 2 Inhibitors Market Revenue Million Forecast, by Geography 2019 & 2032
- Table 48: Global MEA Sodium-dependent Glucose Co-transporter 2 Inhibitors Market Revenue Million Forecast, by Country 2019 & 2032
- Table 49: Global MEA Sodium-dependent Glucose Co-transporter 2 Inhibitors Market Revenue Million Forecast, by Drug 2019 & 2032
- Table 50: Global MEA Sodium-dependent Glucose Co-transporter 2 Inhibitors Market Revenue Million Forecast, by Geography 2019 & 2032
- Table 51: Global MEA Sodium-dependent Glucose Co-transporter 2 Inhibitors Market Revenue Million Forecast, by Country 2019 & 2032
- Table 52: Global MEA Sodium-dependent Glucose Co-transporter 2 Inhibitors Market Revenue Million Forecast, by Drug 2019 & 2032
- Table 53: Global MEA Sodium-dependent Glucose Co-transporter 2 Inhibitors Market Revenue Million Forecast, by Geography 2019 & 2032
- Table 54: Global MEA Sodium-dependent Glucose Co-transporter 2 Inhibitors Market Revenue Million Forecast, by Country 2019 & 2032
- Table 55: Global MEA Sodium-dependent Glucose Co-transporter 2 Inhibitors Market Revenue Million Forecast, by Drug 2019 & 2032
- Table 56: Global MEA Sodium-dependent Glucose Co-transporter 2 Inhibitors Market Revenue Million Forecast, by Geography 2019 & 2032
- Table 57: Global MEA Sodium-dependent Glucose Co-transporter 2 Inhibitors Market Revenue Million Forecast, by Country 2019 & 2032
- Table 58: Global MEA Sodium-dependent Glucose Co-transporter 2 Inhibitors Market Revenue Million Forecast, by Drug 2019 & 2032
- Table 59: Global MEA Sodium-dependent Glucose Co-transporter 2 Inhibitors Market Revenue Million Forecast, by Geography 2019 & 2032
- Table 60: Global MEA Sodium-dependent Glucose Co-transporter 2 Inhibitors Market Revenue Million Forecast, by Country 2019 & 2032
- Table 61: Global MEA Sodium-dependent Glucose Co-transporter 2 Inhibitors Market Revenue Million Forecast, by Drug 2019 & 2032
- Table 62: Global MEA Sodium-dependent Glucose Co-transporter 2 Inhibitors Market Revenue Million Forecast, by Geography 2019 & 2032
- Table 63: Global MEA Sodium-dependent Glucose Co-transporter 2 Inhibitors Market Revenue Million Forecast, by Country 2019 & 2032
Frequently Asked Questions
1. What is the projected Compound Annual Growth Rate (CAGR) of the MEA Sodium-dependent Glucose Co-transporter 2 Inhibitors Market?
The projected CAGR is approximately 9.15%.
2. Which companies are prominent players in the MEA Sodium-dependent Glucose Co-transporter 2 Inhibitors Market?
Key companies in the market include Janssen Pharmaceuticals, Eli Lilly, Bristol Myers Squibb, AstraZeneca, AstraZenec, Boehringer Ingelheim, 7 COMPETITIVE LANDSCAPE7 1 COMPANY PROFILES.
3. What are the main segments of the MEA Sodium-dependent Glucose Co-transporter 2 Inhibitors Market?
The market segments include Drug, Geography.
4. Can you provide details about the market size?
The market size is estimated to be USD 165.50 Million as of 2022.
5. What are some drivers contributing to market growth?
Increasing Prevalence of Genitourinary Disorders; Increasing Number of Pipeline Products.
6. What are the notable trends driving market growth?
Increasing Diabetic Population is Supporting the SGLT 2 Inhibitors Market to Grow in the Middle-East and Africa Region.
7. Are there any restraints impacting market growth?
Lack of Therapy Compliance; Increasing Advent of Counterfeit Drugs.
8. Can you provide examples of recent developments in the market?
April 2022: The sodium-glucose co-transporter-2 (SGLT2) inhibitor, sold as Jardiance, joins Dapagliflozin (sold as Forxiga) as the second medicine of this class to be approved for use in heart failure (HF).
9. What pricing options are available for accessing the report?
Pricing options include single-user, multi-user, and enterprise licenses priced at USD 4750, USD 5250, and USD 8750 respectively.
10. Is the market size provided in terms of value or volume?
The market size is provided in terms of value, measured in Million.
11. Are there any specific market keywords associated with the report?
Yes, the market keyword associated with the report is "MEA Sodium-dependent Glucose Co-transporter 2 Inhibitors Market," which aids in identifying and referencing the specific market segment covered.
12. How do I determine which pricing option suits my needs best?
The pricing options vary based on user requirements and access needs. Individual users may opt for single-user licenses, while businesses requiring broader access may choose multi-user or enterprise licenses for cost-effective access to the report.
13. Are there any additional resources or data provided in the MEA Sodium-dependent Glucose Co-transporter 2 Inhibitors Market report?
While the report offers comprehensive insights, it's advisable to review the specific contents or supplementary materials provided to ascertain if additional resources or data are available.
14. How can I stay updated on further developments or reports in the MEA Sodium-dependent Glucose Co-transporter 2 Inhibitors Market?
To stay informed about further developments, trends, and reports in the MEA Sodium-dependent Glucose Co-transporter 2 Inhibitors Market, consider subscribing to industry newsletters, following relevant companies and organizations, or regularly checking reputable industry news sources and publications.
Methodology
Step 1 - Identification of Relevant Samples Size from Population Database


Step 2 - Approaches for Defining Global Market Size (Value, Volume* & Price*)

Note*: In applicable scenarios
Step 3 - Data Sources
Primary Research
- Web Analytics
- Survey Reports
- Research Institute
- Latest Research Reports
- Opinion Leaders
Secondary Research
- Annual Reports
- White Paper
- Latest Press Release
- Industry Association
- Paid Database
- Investor Presentations

Step 4 - Data Triangulation
Involves using different sources of information in order to increase the validity of a study
These sources are likely to be stakeholders in a program - participants, other researchers, program staff, other community members, and so on.
Then we put all data in single framework & apply various statistical tools to find out the dynamic on the market.
During the analysis stage, feedback from the stakeholder groups would be compared to determine areas of agreement as well as areas of divergence
