

Key Insights
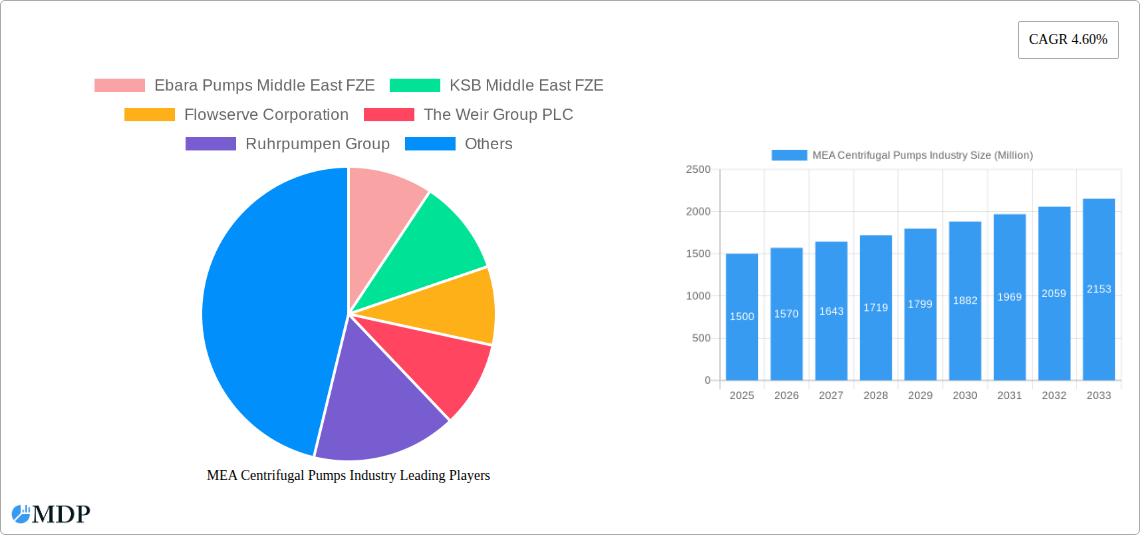
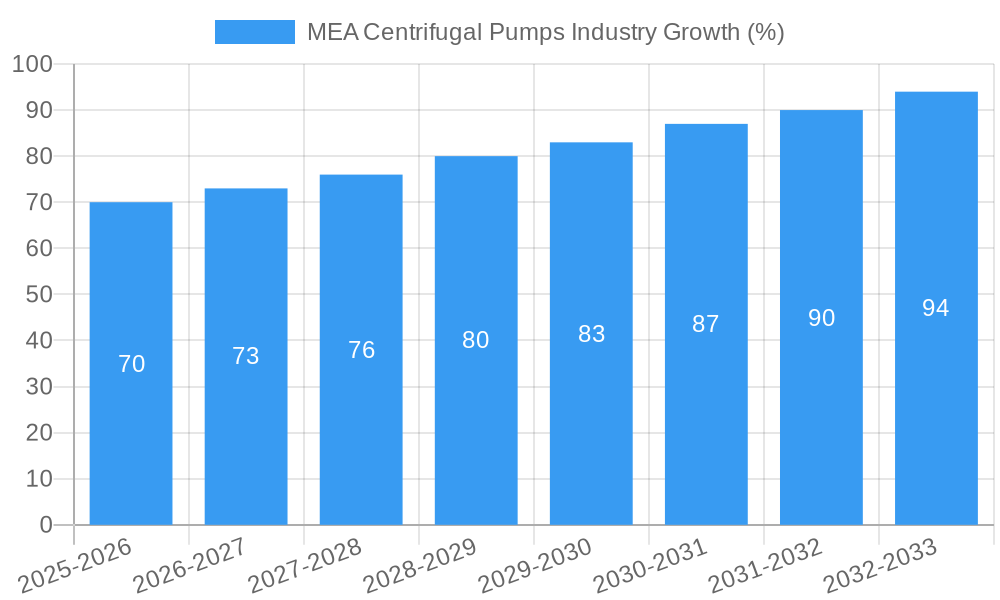
The Middle East and Africa (MEA) centrifugal pumps market is experiencing robust growth, driven by significant investments in infrastructure development, particularly within the oil and gas, water and wastewater, and construction sectors. A compound annual growth rate (CAGR) of 4.60% from 2019-2024 indicates a healthy expansion, projected to continue into the forecast period (2025-2033). This growth is fueled by increasing urbanization, industrialization, and the rising demand for efficient fluid handling solutions across various industries. The market is segmented by flow type (axial, radial, mixed), number of stages (single, multi-stage), end-user industry (oil & gas, food & beverage, water & wastewater, pharma, power, construction, metal & mining), and geography (Saudi Arabia, UAE, South Africa, and the rest of MEA). The dominance of specific segments may shift based on regional infrastructure projects and industrial growth patterns. For example, the oil & gas sector's substantial investments will likely continue to drive demand for high-capacity, robust centrifugal pumps in Saudi Arabia and the UAE. Similarly, expanding water infrastructure projects across the region will boost demand in the water & wastewater segment. Major players like Ebara Pumps, KSB, Flowserve, Weir Group, and others are vying for market share through technological innovation, strategic partnerships, and expansion into key regional markets. The market's future growth trajectory will largely depend on sustained government investment in infrastructure, economic stability within MEA countries, and the successful implementation of large-scale industrial projects.
The competitive landscape is characterized by a mix of global and regional players. While global giants benefit from established brand recognition and technological prowess, local players often offer cost-effective solutions and tailored services to meet specific regional needs. This dynamic competition is driving innovation and enhancing the quality and affordability of centrifugal pumps within the MEA region. Technological advancements, such as the development of energy-efficient pumps and smart monitoring systems, are further shaping the market, driving adoption and enhancing operational efficiency. Factors such as fluctuating oil prices and potential geopolitical instability present challenges, but the overall outlook for the MEA centrifugal pumps market remains positive, offering considerable growth opportunities for both established and emerging companies.
MEA Centrifugal Pumps Industry: A Comprehensive Market Report (2019-2033)
This in-depth report provides a comprehensive analysis of the Middle East and Africa (MEA) centrifugal pumps industry, covering market dynamics, leading players, key trends, and future growth prospects. With a study period spanning 2019-2033, a base year of 2025, and a forecast period of 2025-2033, this report is an invaluable resource for industry stakeholders, investors, and strategic decision-makers. The market size in 2025 is estimated at xx Million and is projected to reach xx Million by 2033, exhibiting a CAGR of xx%.
MEA Centrifugal Pumps Industry Market Dynamics & Concentration
The MEA centrifugal pumps market is characterized by a moderately concentrated landscape, with several multinational corporations and regional players vying for market share. Market concentration is influenced by factors such as technological advancements, stringent regulatory frameworks (e.g., environmental regulations impacting pump efficiency), and the emergence of substitute technologies. End-user trends, particularly in the Oil & Gas and Water & Wastewater sectors, significantly impact demand. Mergers and acquisitions (M&A) activity has played a role in shaping the competitive landscape, with xx M&A deals recorded between 2019 and 2024. Key players have focused on strategic acquisitions to enhance their product portfolios, expand geographic reach, and improve service offerings. Market share distribution is as follows: Top 5 players hold approximately xx% of the market share, while the remaining share is dispersed among numerous smaller players.
- Innovation Drivers: Focus on energy efficiency, smart pumps, and digitalization.
- Regulatory Frameworks: Emphasis on environmental compliance and safety standards.
- Product Substitutes: Limited, but alternative pumping technologies are emerging.
- End-User Trends: Growing demand from infrastructure development and industrial expansion.
- M&A Activity: xx deals recorded from 2019-2024.
MEA Centrifugal Pumps Industry Industry Trends & Analysis
The MEA centrifugal pumps market is experiencing robust growth, driven by factors such as increasing industrialization, urbanization, and infrastructure development across the region. Technological advancements, particularly in energy-efficient pump designs and smart pump technologies, are further stimulating market expansion. Consumer preferences are shifting towards sustainable and cost-effective solutions, leading to increased demand for energy-efficient and low-maintenance pumps. The competitive landscape is dynamic, with established players facing increasing pressure from emerging regional players and innovative technologies. The market penetration of energy-efficient pumps is gradually increasing, driven by stringent environmental regulations and cost-saving incentives. The CAGR for the forecast period (2025-2033) is projected at xx%, indicating significant growth potential.
Leading Markets & Segments in MEA Centrifugal Pumps Industry
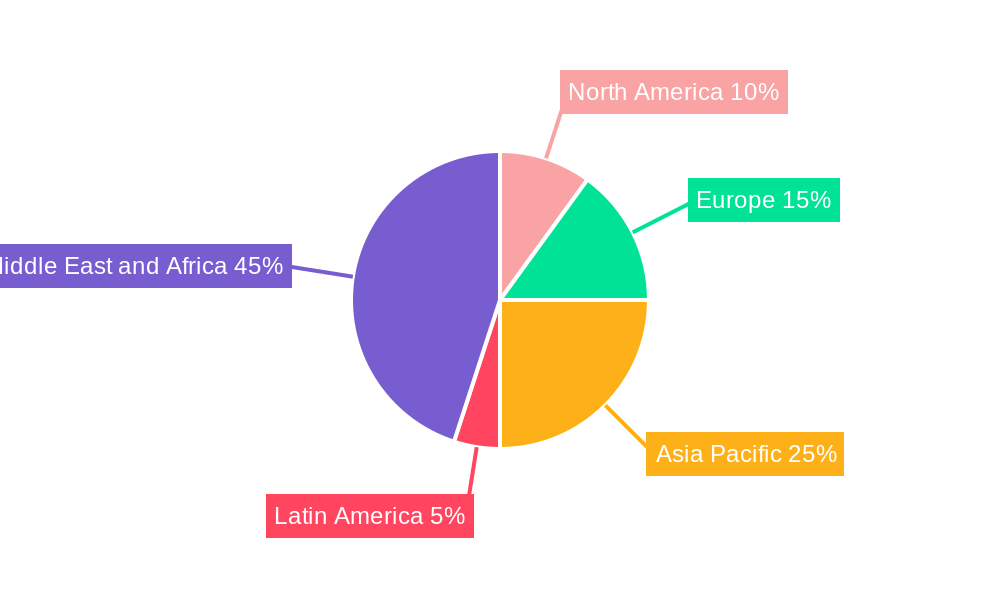
The Saudi Arabia and the United Arab Emirates represent the largest markets within the MEA region, driven by significant investments in infrastructure projects, particularly in the Oil & Gas and Water & Wastewater sectors. Within the segmentation analysis, the radial flow type segment dominates the market, followed by mixed flow and axial flow types. Multi-stage pumps also hold a larger market share compared to single-stage pumps due to their higher pressure capabilities.
Key Drivers:
- Saudi Arabia & UAE: Large-scale infrastructure projects, rising oil & gas production, and government investments in water management.
- South Africa: Growth in mining and industrial activities.
- Rest of MEA: Expanding industrial sectors and urbanization.
Dominant Segments:
- By Flow Type: Radial flow pumps are the most widely used due to their versatility and high-pressure capabilities.
- By Number of Stages: Multi-stage pumps cater to higher pressure applications.
- By End-User Industry: Oil & Gas, Water & Wastewater, and Power Generation are significant end-users.
MEA Centrifugal Pumps Industry Product Developments
Recent product innovations focus on enhancing energy efficiency, improving reliability, and incorporating smart technologies. Manufacturers are introducing pumps with variable speed drives, advanced materials, and integrated sensors for real-time monitoring and predictive maintenance. These advancements address the increasing demand for cost-effective, environmentally friendly, and digitally enabled pump solutions. The market fit of these innovative products is high, particularly in sectors with stringent environmental regulations and a demand for operational efficiency.
Key Drivers of MEA Centrifugal Pumps Industry Growth
The MEA centrifugal pumps market is propelled by several key factors: rapid industrialization and urbanization driving demand across various sectors; substantial investments in infrastructure projects, particularly in water management and energy; technological advancements leading to energy-efficient and smart pump solutions; increasing adoption of stringent environmental regulations promoting energy-efficient pumps; and government initiatives promoting energy efficiency and water conservation.
Challenges in the MEA Centrifugal Pumps Industry Market
The MEA centrifugal pumps market faces several challenges: fluctuating oil prices impacting the Oil & Gas sector; volatile currency exchange rates affecting import costs and profitability; competition from low-cost manufacturers; supply chain disruptions affecting availability of raw materials and components; and the complexities of navigating regional regulations and standards. These factors can contribute to xx Million in revenue loss annually (estimated).
Emerging Opportunities in MEA Centrifugal Pumps Industry
Significant growth opportunities exist through technological advancements in areas such as artificial intelligence and machine learning for pump optimization; strategic partnerships and joint ventures to expand market reach and access new technologies; and market expansion into emerging economies within the MEA region with high growth potential in sectors like renewable energy and desalination.
Leading Players in the MEA Centrifugal Pumps Industry Sector
- Ebara Pumps Middle East FZE
- KSB Middle East FZE
- Flowserve Corporation
- The Weir Group PLC
- Ruhrpumpen Group
- Dover Corporation
- Baker Hughes Company
- Xylem Inc
- Schlumberger Limited
- Parker Hannifin Corp
Key Milestones in MEA Centrifugal Pumps Industry Industry
- June 2021: Amarinth secures a significant order for vertical pumps from ISCCO for the ADNOC Ruwais Refinery East, UAE, highlighting growing demand in the Oil & Gas sector.
- February 2021: Wilo Middle East acquires PumpsPro, strengthening its position as a complete solution provider in the UAE and the wider Middle East region.
Strategic Outlook for MEA Centrifugal Pumps Industry Market
The MEA centrifugal pumps market is poised for continued growth, driven by sustained infrastructure development, technological innovation, and favorable government policies. Strategic opportunities lie in focusing on energy-efficient and smart pump technologies, expanding into high-growth market segments, and forging strategic partnerships to strengthen market presence and access new technologies. The long-term market outlook remains positive, with potential for significant expansion across various end-user industries.
MEA Centrifugal Pumps Industry Segmentation
-
1. Flow Type
- 1.1. Axial
- 1.2. Radial
- 1.3. Mixed
-
2. Number of Stages
- 2.1. Single Stage
- 2.2. Multi Stage
-
3. End-User Industry
- 3.1. Oil & Gas
- 3.2. Food & Beverages
- 3.3. Water & Wastewater
- 3.4. Pharma
- 3.5. Power
- 3.6. Construction
- 3.7. Metal & Mining
- 3.8. Others
MEA Centrifugal Pumps Industry Segmentation By Geography
-
1. North America
- 1.1. United States
- 1.2. Canada
- 1.3. Mexico
-
2. South America
- 2.1. Brazil
- 2.2. Argentina
- 2.3. Rest of South America
-
3. Europe
- 3.1. United Kingdom
- 3.2. Germany
- 3.3. France
- 3.4. Italy
- 3.5. Spain
- 3.6. Russia
- 3.7. Benelux
- 3.8. Nordics
- 3.9. Rest of Europe
-
4. Middle East & Africa
- 4.1. Turkey
- 4.2. Israel
- 4.3. GCC
- 4.4. North Africa
- 4.5. South Africa
- 4.6. Rest of Middle East & Africa
-
5. Asia Pacific
- 5.1. China
- 5.2. India
- 5.3. Japan
- 5.4. South Korea
- 5.5. ASEAN
- 5.6. Oceania
- 5.7. Rest of Asia Pacific
MEA Centrifugal Pumps Industry REPORT HIGHLIGHTS
| Aspects | Details |
|---|---|
| Study Period | 2019-2033 |
| Base Year | 2024 |
| Estimated Year | 2025 |
| Forecast Period | 2025-2033 |
| Historical Period | 2019-2024 |
| Growth Rate | CAGR of 4.60% from 2019-2033 |
| Segmentation |
|
Table of Contents
- 1. Introduction
- 1.1. Research Scope
- 1.2. Market Segmentation
- 1.3. Research Methodology
- 1.4. Definitions and Assumptions
- 2. Executive Summary
- 2.1. Introduction
- 3. Market Dynamics
- 3.1. Introduction
- 3.2. Market Drivers
- 3.2.1. Rapid Industrialization & Urbanization; Increasing Investments in Urban Waste-Water Sector
- 3.3. Market Restrains
- 3.3.1. High Acquisition and Maintenace Cost of Industrial CT systems
- 3.4. Market Trends
- 3.4.1. Water and Wastewater Management to Drive the Demand for Centrifugal Pumps
- 4. Market Factor Analysis
- 4.1. Porters Five Forces
- 4.2. Supply/Value Chain
- 4.3. PESTEL analysis
- 4.4. Market Entropy
- 4.5. Patent/Trademark Analysis
- 5. Global MEA Centrifugal Pumps Industry Analysis, Insights and Forecast, 2019-2031
- 5.1. Market Analysis, Insights and Forecast - by Flow Type
- 5.1.1. Axial
- 5.1.2. Radial
- 5.1.3. Mixed
- 5.2. Market Analysis, Insights and Forecast - by Number of Stages
- 5.2.1. Single Stage
- 5.2.2. Multi Stage
- 5.3. Market Analysis, Insights and Forecast - by End-User Industry
- 5.3.1. Oil & Gas
- 5.3.2. Food & Beverages
- 5.3.3. Water & Wastewater
- 5.3.4. Pharma
- 5.3.5. Power
- 5.3.6. Construction
- 5.3.7. Metal & Mining
- 5.3.8. Others
- 5.4. Market Analysis, Insights and Forecast - by Region
- 5.4.1. North America
- 5.4.2. South America
- 5.4.3. Europe
- 5.4.4. Middle East & Africa
- 5.4.5. Asia Pacific
- 5.1. Market Analysis, Insights and Forecast - by Flow Type
- 6. North America MEA Centrifugal Pumps Industry Analysis, Insights and Forecast, 2019-2031
- 6.1. Market Analysis, Insights and Forecast - by Flow Type
- 6.1.1. Axial
- 6.1.2. Radial
- 6.1.3. Mixed
- 6.2. Market Analysis, Insights and Forecast - by Number of Stages
- 6.2.1. Single Stage
- 6.2.2. Multi Stage
- 6.3. Market Analysis, Insights and Forecast - by End-User Industry
- 6.3.1. Oil & Gas
- 6.3.2. Food & Beverages
- 6.3.3. Water & Wastewater
- 6.3.4. Pharma
- 6.3.5. Power
- 6.3.6. Construction
- 6.3.7. Metal & Mining
- 6.3.8. Others
- 6.1. Market Analysis, Insights and Forecast - by Flow Type
- 7. South America MEA Centrifugal Pumps Industry Analysis, Insights and Forecast, 2019-2031
- 7.1. Market Analysis, Insights and Forecast - by Flow Type
- 7.1.1. Axial
- 7.1.2. Radial
- 7.1.3. Mixed
- 7.2. Market Analysis, Insights and Forecast - by Number of Stages
- 7.2.1. Single Stage
- 7.2.2. Multi Stage
- 7.3. Market Analysis, Insights and Forecast - by End-User Industry
- 7.3.1. Oil & Gas
- 7.3.2. Food & Beverages
- 7.3.3. Water & Wastewater
- 7.3.4. Pharma
- 7.3.5. Power
- 7.3.6. Construction
- 7.3.7. Metal & Mining
- 7.3.8. Others
- 7.1. Market Analysis, Insights and Forecast - by Flow Type
- 8. Europe MEA Centrifugal Pumps Industry Analysis, Insights and Forecast, 2019-2031
- 8.1. Market Analysis, Insights and Forecast - by Flow Type
- 8.1.1. Axial
- 8.1.2. Radial
- 8.1.3. Mixed
- 8.2. Market Analysis, Insights and Forecast - by Number of Stages
- 8.2.1. Single Stage
- 8.2.2. Multi Stage
- 8.3. Market Analysis, Insights and Forecast - by End-User Industry
- 8.3.1. Oil & Gas
- 8.3.2. Food & Beverages
- 8.3.3. Water & Wastewater
- 8.3.4. Pharma
- 8.3.5. Power
- 8.3.6. Construction
- 8.3.7. Metal & Mining
- 8.3.8. Others
- 8.1. Market Analysis, Insights and Forecast - by Flow Type
- 9. Middle East & Africa MEA Centrifugal Pumps Industry Analysis, Insights and Forecast, 2019-2031
- 9.1. Market Analysis, Insights and Forecast - by Flow Type
- 9.1.1. Axial
- 9.1.2. Radial
- 9.1.3. Mixed
- 9.2. Market Analysis, Insights and Forecast - by Number of Stages
- 9.2.1. Single Stage
- 9.2.2. Multi Stage
- 9.3. Market Analysis, Insights and Forecast - by End-User Industry
- 9.3.1. Oil & Gas
- 9.3.2. Food & Beverages
- 9.3.3. Water & Wastewater
- 9.3.4. Pharma
- 9.3.5. Power
- 9.3.6. Construction
- 9.3.7. Metal & Mining
- 9.3.8. Others
- 9.1. Market Analysis, Insights and Forecast - by Flow Type
- 10. Asia Pacific MEA Centrifugal Pumps Industry Analysis, Insights and Forecast, 2019-2031
- 10.1. Market Analysis, Insights and Forecast - by Flow Type
- 10.1.1. Axial
- 10.1.2. Radial
- 10.1.3. Mixed
- 10.2. Market Analysis, Insights and Forecast - by Number of Stages
- 10.2.1. Single Stage
- 10.2.2. Multi Stage
- 10.3. Market Analysis, Insights and Forecast - by End-User Industry
- 10.3.1. Oil & Gas
- 10.3.2. Food & Beverages
- 10.3.3. Water & Wastewater
- 10.3.4. Pharma
- 10.3.5. Power
- 10.3.6. Construction
- 10.3.7. Metal & Mining
- 10.3.8. Others
- 10.1. Market Analysis, Insights and Forecast - by Flow Type
- 11. North America MEA Centrifugal Pumps Industry Analysis, Insights and Forecast, 2019-2031
- 11.1. Market Analysis, Insights and Forecast - By Country/Sub-region
- 11.1.1.
- 12. Europe MEA Centrifugal Pumps Industry Analysis, Insights and Forecast, 2019-2031
- 12.1. Market Analysis, Insights and Forecast - By Country/Sub-region
- 12.1.1.
- 13. Asia Pacific MEA Centrifugal Pumps Industry Analysis, Insights and Forecast, 2019-2031
- 13.1. Market Analysis, Insights and Forecast - By Country/Sub-region
- 13.1.1.
- 14. Latin America MEA Centrifugal Pumps Industry Analysis, Insights and Forecast, 2019-2031
- 14.1. Market Analysis, Insights and Forecast - By Country/Sub-region
- 14.1.1.
- 15. Middle East and Africa MEA Centrifugal Pumps Industry Analysis, Insights and Forecast, 2019-2031
- 15.1. Market Analysis, Insights and Forecast - By Country/Sub-region
- 15.1.1.
- 16. Competitive Analysis
- 16.1. Global Market Share Analysis 2024
- 16.2. Company Profiles
- 16.2.1 Ebara Pumps Middle East FZE
- 16.2.1.1. Overview
- 16.2.1.2. Products
- 16.2.1.3. SWOT Analysis
- 16.2.1.4. Recent Developments
- 16.2.1.5. Financials (Based on Availability)
- 16.2.2 KSB Middle East FZE
- 16.2.2.1. Overview
- 16.2.2.2. Products
- 16.2.2.3. SWOT Analysis
- 16.2.2.4. Recent Developments
- 16.2.2.5. Financials (Based on Availability)
- 16.2.3 Flowserve Corporation
- 16.2.3.1. Overview
- 16.2.3.2. Products
- 16.2.3.3. SWOT Analysis
- 16.2.3.4. Recent Developments
- 16.2.3.5. Financials (Based on Availability)
- 16.2.4 The Weir Group PLC
- 16.2.4.1. Overview
- 16.2.4.2. Products
- 16.2.4.3. SWOT Analysis
- 16.2.4.4. Recent Developments
- 16.2.4.5. Financials (Based on Availability)
- 16.2.5 Ruhrpumpen Group
- 16.2.5.1. Overview
- 16.2.5.2. Products
- 16.2.5.3. SWOT Analysis
- 16.2.5.4. Recent Developments
- 16.2.5.5. Financials (Based on Availability)
- 16.2.6 Dover Corporation
- 16.2.6.1. Overview
- 16.2.6.2. Products
- 16.2.6.3. SWOT Analysis
- 16.2.6.4. Recent Developments
- 16.2.6.5. Financials (Based on Availability)
- 16.2.7 Baker Hughes Company
- 16.2.7.1. Overview
- 16.2.7.2. Products
- 16.2.7.3. SWOT Analysis
- 16.2.7.4. Recent Developments
- 16.2.7.5. Financials (Based on Availability)
- 16.2.8 Xylem Inc
- 16.2.8.1. Overview
- 16.2.8.2. Products
- 16.2.8.3. SWOT Analysis
- 16.2.8.4. Recent Developments
- 16.2.8.5. Financials (Based on Availability)
- 16.2.9 Schlumberger Limited
- 16.2.9.1. Overview
- 16.2.9.2. Products
- 16.2.9.3. SWOT Analysis
- 16.2.9.4. Recent Developments
- 16.2.9.5. Financials (Based on Availability)
- 16.2.10 Parker Hannifin Corp
- 16.2.10.1. Overview
- 16.2.10.2. Products
- 16.2.10.3. SWOT Analysis
- 16.2.10.4. Recent Developments
- 16.2.10.5. Financials (Based on Availability)
- 16.2.1 Ebara Pumps Middle East FZE
List of Figures
- Figure 1: Global MEA Centrifugal Pumps Industry Revenue Breakdown (Million, %) by Region 2024 & 2032
- Figure 2: Global MEA Centrifugal Pumps Industry Volume Breakdown (K Unit, %) by Region 2024 & 2032
- Figure 3: North America MEA Centrifugal Pumps Industry Revenue (Million), by Country 2024 & 2032
- Figure 4: North America MEA Centrifugal Pumps Industry Volume (K Unit), by Country 2024 & 2032
- Figure 5: North America MEA Centrifugal Pumps Industry Revenue Share (%), by Country 2024 & 2032
- Figure 6: North America MEA Centrifugal Pumps Industry Volume Share (%), by Country 2024 & 2032
- Figure 7: Europe MEA Centrifugal Pumps Industry Revenue (Million), by Country 2024 & 2032
- Figure 8: Europe MEA Centrifugal Pumps Industry Volume (K Unit), by Country 2024 & 2032
- Figure 9: Europe MEA Centrifugal Pumps Industry Revenue Share (%), by Country 2024 & 2032
- Figure 10: Europe MEA Centrifugal Pumps Industry Volume Share (%), by Country 2024 & 2032
- Figure 11: Asia Pacific MEA Centrifugal Pumps Industry Revenue (Million), by Country 2024 & 2032
- Figure 12: Asia Pacific MEA Centrifugal Pumps Industry Volume (K Unit), by Country 2024 & 2032
- Figure 13: Asia Pacific MEA Centrifugal Pumps Industry Revenue Share (%), by Country 2024 & 2032
- Figure 14: Asia Pacific MEA Centrifugal Pumps Industry Volume Share (%), by Country 2024 & 2032
- Figure 15: Latin America MEA Centrifugal Pumps Industry Revenue (Million), by Country 2024 & 2032
- Figure 16: Latin America MEA Centrifugal Pumps Industry Volume (K Unit), by Country 2024 & 2032
- Figure 17: Latin America MEA Centrifugal Pumps Industry Revenue Share (%), by Country 2024 & 2032
- Figure 18: Latin America MEA Centrifugal Pumps Industry Volume Share (%), by Country 2024 & 2032
- Figure 19: Middle East and Africa MEA Centrifugal Pumps Industry Revenue (Million), by Country 2024 & 2032
- Figure 20: Middle East and Africa MEA Centrifugal Pumps Industry Volume (K Unit), by Country 2024 & 2032
- Figure 21: Middle East and Africa MEA Centrifugal Pumps Industry Revenue Share (%), by Country 2024 & 2032
- Figure 22: Middle East and Africa MEA Centrifugal Pumps Industry Volume Share (%), by Country 2024 & 2032
- Figure 23: North America MEA Centrifugal Pumps Industry Revenue (Million), by Flow Type 2024 & 2032
- Figure 24: North America MEA Centrifugal Pumps Industry Volume (K Unit), by Flow Type 2024 & 2032
- Figure 25: North America MEA Centrifugal Pumps Industry Revenue Share (%), by Flow Type 2024 & 2032
- Figure 26: North America MEA Centrifugal Pumps Industry Volume Share (%), by Flow Type 2024 & 2032
- Figure 27: North America MEA Centrifugal Pumps Industry Revenue (Million), by Number of Stages 2024 & 2032
- Figure 28: North America MEA Centrifugal Pumps Industry Volume (K Unit), by Number of Stages 2024 & 2032
- Figure 29: North America MEA Centrifugal Pumps Industry Revenue Share (%), by Number of Stages 2024 & 2032
- Figure 30: North America MEA Centrifugal Pumps Industry Volume Share (%), by Number of Stages 2024 & 2032
- Figure 31: North America MEA Centrifugal Pumps Industry Revenue (Million), by End-User Industry 2024 & 2032
- Figure 32: North America MEA Centrifugal Pumps Industry Volume (K Unit), by End-User Industry 2024 & 2032
- Figure 33: North America MEA Centrifugal Pumps Industry Revenue Share (%), by End-User Industry 2024 & 2032
- Figure 34: North America MEA Centrifugal Pumps Industry Volume Share (%), by End-User Industry 2024 & 2032
- Figure 35: North America MEA Centrifugal Pumps Industry Revenue (Million), by Country 2024 & 2032
- Figure 36: North America MEA Centrifugal Pumps Industry Volume (K Unit), by Country 2024 & 2032
- Figure 37: North America MEA Centrifugal Pumps Industry Revenue Share (%), by Country 2024 & 2032
- Figure 38: North America MEA Centrifugal Pumps Industry Volume Share (%), by Country 2024 & 2032
- Figure 39: South America MEA Centrifugal Pumps Industry Revenue (Million), by Flow Type 2024 & 2032
- Figure 40: South America MEA Centrifugal Pumps Industry Volume (K Unit), by Flow Type 2024 & 2032
- Figure 41: South America MEA Centrifugal Pumps Industry Revenue Share (%), by Flow Type 2024 & 2032
- Figure 42: South America MEA Centrifugal Pumps Industry Volume Share (%), by Flow Type 2024 & 2032
- Figure 43: South America MEA Centrifugal Pumps Industry Revenue (Million), by Number of Stages 2024 & 2032
- Figure 44: South America MEA Centrifugal Pumps Industry Volume (K Unit), by Number of Stages 2024 & 2032
- Figure 45: South America MEA Centrifugal Pumps Industry Revenue Share (%), by Number of Stages 2024 & 2032
- Figure 46: South America MEA Centrifugal Pumps Industry Volume Share (%), by Number of Stages 2024 & 2032
- Figure 47: South America MEA Centrifugal Pumps Industry Revenue (Million), by End-User Industry 2024 & 2032
- Figure 48: South America MEA Centrifugal Pumps Industry Volume (K Unit), by End-User Industry 2024 & 2032
- Figure 49: South America MEA Centrifugal Pumps Industry Revenue Share (%), by End-User Industry 2024 & 2032
- Figure 50: South America MEA Centrifugal Pumps Industry Volume Share (%), by End-User Industry 2024 & 2032
- Figure 51: South America MEA Centrifugal Pumps Industry Revenue (Million), by Country 2024 & 2032
- Figure 52: South America MEA Centrifugal Pumps Industry Volume (K Unit), by Country 2024 & 2032
- Figure 53: South America MEA Centrifugal Pumps Industry Revenue Share (%), by Country 2024 & 2032
- Figure 54: South America MEA Centrifugal Pumps Industry Volume Share (%), by Country 2024 & 2032
- Figure 55: Europe MEA Centrifugal Pumps Industry Revenue (Million), by Flow Type 2024 & 2032
- Figure 56: Europe MEA Centrifugal Pumps Industry Volume (K Unit), by Flow Type 2024 & 2032
- Figure 57: Europe MEA Centrifugal Pumps Industry Revenue Share (%), by Flow Type 2024 & 2032
- Figure 58: Europe MEA Centrifugal Pumps Industry Volume Share (%), by Flow Type 2024 & 2032
- Figure 59: Europe MEA Centrifugal Pumps Industry Revenue (Million), by Number of Stages 2024 & 2032
- Figure 60: Europe MEA Centrifugal Pumps Industry Volume (K Unit), by Number of Stages 2024 & 2032
- Figure 61: Europe MEA Centrifugal Pumps Industry Revenue Share (%), by Number of Stages 2024 & 2032
- Figure 62: Europe MEA Centrifugal Pumps Industry Volume Share (%), by Number of Stages 2024 & 2032
- Figure 63: Europe MEA Centrifugal Pumps Industry Revenue (Million), by End-User Industry 2024 & 2032
- Figure 64: Europe MEA Centrifugal Pumps Industry Volume (K Unit), by End-User Industry 2024 & 2032
- Figure 65: Europe MEA Centrifugal Pumps Industry Revenue Share (%), by End-User Industry 2024 & 2032
- Figure 66: Europe MEA Centrifugal Pumps Industry Volume Share (%), by End-User Industry 2024 & 2032
- Figure 67: Europe MEA Centrifugal Pumps Industry Revenue (Million), by Country 2024 & 2032
- Figure 68: Europe MEA Centrifugal Pumps Industry Volume (K Unit), by Country 2024 & 2032
- Figure 69: Europe MEA Centrifugal Pumps Industry Revenue Share (%), by Country 2024 & 2032
- Figure 70: Europe MEA Centrifugal Pumps Industry Volume Share (%), by Country 2024 & 2032
- Figure 71: Middle East & Africa MEA Centrifugal Pumps Industry Revenue (Million), by Flow Type 2024 & 2032
- Figure 72: Middle East & Africa MEA Centrifugal Pumps Industry Volume (K Unit), by Flow Type 2024 & 2032
- Figure 73: Middle East & Africa MEA Centrifugal Pumps Industry Revenue Share (%), by Flow Type 2024 & 2032
- Figure 74: Middle East & Africa MEA Centrifugal Pumps Industry Volume Share (%), by Flow Type 2024 & 2032
- Figure 75: Middle East & Africa MEA Centrifugal Pumps Industry Revenue (Million), by Number of Stages 2024 & 2032
- Figure 76: Middle East & Africa MEA Centrifugal Pumps Industry Volume (K Unit), by Number of Stages 2024 & 2032
- Figure 77: Middle East & Africa MEA Centrifugal Pumps Industry Revenue Share (%), by Number of Stages 2024 & 2032
- Figure 78: Middle East & Africa MEA Centrifugal Pumps Industry Volume Share (%), by Number of Stages 2024 & 2032
- Figure 79: Middle East & Africa MEA Centrifugal Pumps Industry Revenue (Million), by End-User Industry 2024 & 2032
- Figure 80: Middle East & Africa MEA Centrifugal Pumps Industry Volume (K Unit), by End-User Industry 2024 & 2032
- Figure 81: Middle East & Africa MEA Centrifugal Pumps Industry Revenue Share (%), by End-User Industry 2024 & 2032
- Figure 82: Middle East & Africa MEA Centrifugal Pumps Industry Volume Share (%), by End-User Industry 2024 & 2032
- Figure 83: Middle East & Africa MEA Centrifugal Pumps Industry Revenue (Million), by Country 2024 & 2032
- Figure 84: Middle East & Africa MEA Centrifugal Pumps Industry Volume (K Unit), by Country 2024 & 2032
- Figure 85: Middle East & Africa MEA Centrifugal Pumps Industry Revenue Share (%), by Country 2024 & 2032
- Figure 86: Middle East & Africa MEA Centrifugal Pumps Industry Volume Share (%), by Country 2024 & 2032
- Figure 87: Asia Pacific MEA Centrifugal Pumps Industry Revenue (Million), by Flow Type 2024 & 2032
- Figure 88: Asia Pacific MEA Centrifugal Pumps Industry Volume (K Unit), by Flow Type 2024 & 2032
- Figure 89: Asia Pacific MEA Centrifugal Pumps Industry Revenue Share (%), by Flow Type 2024 & 2032
- Figure 90: Asia Pacific MEA Centrifugal Pumps Industry Volume Share (%), by Flow Type 2024 & 2032
- Figure 91: Asia Pacific MEA Centrifugal Pumps Industry Revenue (Million), by Number of Stages 2024 & 2032
- Figure 92: Asia Pacific MEA Centrifugal Pumps Industry Volume (K Unit), by Number of Stages 2024 & 2032
- Figure 93: Asia Pacific MEA Centrifugal Pumps Industry Revenue Share (%), by Number of Stages 2024 & 2032
- Figure 94: Asia Pacific MEA Centrifugal Pumps Industry Volume Share (%), by Number of Stages 2024 & 2032
- Figure 95: Asia Pacific MEA Centrifugal Pumps Industry Revenue (Million), by End-User Industry 2024 & 2032
- Figure 96: Asia Pacific MEA Centrifugal Pumps Industry Volume (K Unit), by End-User Industry 2024 & 2032
- Figure 97: Asia Pacific MEA Centrifugal Pumps Industry Revenue Share (%), by End-User Industry 2024 & 2032
- Figure 98: Asia Pacific MEA Centrifugal Pumps Industry Volume Share (%), by End-User Industry 2024 & 2032
- Figure 99: Asia Pacific MEA Centrifugal Pumps Industry Revenue (Million), by Country 2024 & 2032
- Figure 100: Asia Pacific MEA Centrifugal Pumps Industry Volume (K Unit), by Country 2024 & 2032
- Figure 101: Asia Pacific MEA Centrifugal Pumps Industry Revenue Share (%), by Country 2024 & 2032
- Figure 102: Asia Pacific MEA Centrifugal Pumps Industry Volume Share (%), by Country 2024 & 2032
List of Tables
- Table 1: Global MEA Centrifugal Pumps Industry Revenue Million Forecast, by Region 2019 & 2032
- Table 2: Global MEA Centrifugal Pumps Industry Volume K Unit Forecast, by Region 2019 & 2032
- Table 3: Global MEA Centrifugal Pumps Industry Revenue Million Forecast, by Flow Type 2019 & 2032
- Table 4: Global MEA Centrifugal Pumps Industry Volume K Unit Forecast, by Flow Type 2019 & 2032
- Table 5: Global MEA Centrifugal Pumps Industry Revenue Million Forecast, by Number of Stages 2019 & 2032
- Table 6: Global MEA Centrifugal Pumps Industry Volume K Unit Forecast, by Number of Stages 2019 & 2032
- Table 7: Global MEA Centrifugal Pumps Industry Revenue Million Forecast, by End-User Industry 2019 & 2032
- Table 8: Global MEA Centrifugal Pumps Industry Volume K Unit Forecast, by End-User Industry 2019 & 2032
- Table 9: Global MEA Centrifugal Pumps Industry Revenue Million Forecast, by Region 2019 & 2032
- Table 10: Global MEA Centrifugal Pumps Industry Volume K Unit Forecast, by Region 2019 & 2032
- Table 11: Global MEA Centrifugal Pumps Industry Revenue Million Forecast, by Country 2019 & 2032
- Table 12: Global MEA Centrifugal Pumps Industry Volume K Unit Forecast, by Country 2019 & 2032
- Table 13: MEA Centrifugal Pumps Industry Revenue (Million) Forecast, by Application 2019 & 2032
- Table 14: MEA Centrifugal Pumps Industry Volume (K Unit) Forecast, by Application 2019 & 2032
- Table 15: Global MEA Centrifugal Pumps Industry Revenue Million Forecast, by Country 2019 & 2032
- Table 16: Global MEA Centrifugal Pumps Industry Volume K Unit Forecast, by Country 2019 & 2032
- Table 17: MEA Centrifugal Pumps Industry Revenue (Million) Forecast, by Application 2019 & 2032
- Table 18: MEA Centrifugal Pumps Industry Volume (K Unit) Forecast, by Application 2019 & 2032
- Table 19: Global MEA Centrifugal Pumps Industry Revenue Million Forecast, by Country 2019 & 2032
- Table 20: Global MEA Centrifugal Pumps Industry Volume K Unit Forecast, by Country 2019 & 2032
- Table 21: MEA Centrifugal Pumps Industry Revenue (Million) Forecast, by Application 2019 & 2032
- Table 22: MEA Centrifugal Pumps Industry Volume (K Unit) Forecast, by Application 2019 & 2032
- Table 23: Global MEA Centrifugal Pumps Industry Revenue Million Forecast, by Country 2019 & 2032
- Table 24: Global MEA Centrifugal Pumps Industry Volume K Unit Forecast, by Country 2019 & 2032
- Table 25: MEA Centrifugal Pumps Industry Revenue (Million) Forecast, by Application 2019 & 2032
- Table 26: MEA Centrifugal Pumps Industry Volume (K Unit) Forecast, by Application 2019 & 2032
- Table 27: Global MEA Centrifugal Pumps Industry Revenue Million Forecast, by Country 2019 & 2032
- Table 28: Global MEA Centrifugal Pumps Industry Volume K Unit Forecast, by Country 2019 & 2032
- Table 29: MEA Centrifugal Pumps Industry Revenue (Million) Forecast, by Application 2019 & 2032
- Table 30: MEA Centrifugal Pumps Industry Volume (K Unit) Forecast, by Application 2019 & 2032
- Table 31: Global MEA Centrifugal Pumps Industry Revenue Million Forecast, by Flow Type 2019 & 2032
- Table 32: Global MEA Centrifugal Pumps Industry Volume K Unit Forecast, by Flow Type 2019 & 2032
- Table 33: Global MEA Centrifugal Pumps Industry Revenue Million Forecast, by Number of Stages 2019 & 2032
- Table 34: Global MEA Centrifugal Pumps Industry Volume K Unit Forecast, by Number of Stages 2019 & 2032
- Table 35: Global MEA Centrifugal Pumps Industry Revenue Million Forecast, by End-User Industry 2019 & 2032
- Table 36: Global MEA Centrifugal Pumps Industry Volume K Unit Forecast, by End-User Industry 2019 & 2032
- Table 37: Global MEA Centrifugal Pumps Industry Revenue Million Forecast, by Country 2019 & 2032
- Table 38: Global MEA Centrifugal Pumps Industry Volume K Unit Forecast, by Country 2019 & 2032
- Table 39: United States MEA Centrifugal Pumps Industry Revenue (Million) Forecast, by Application 2019 & 2032
- Table 40: United States MEA Centrifugal Pumps Industry Volume (K Unit) Forecast, by Application 2019 & 2032
- Table 41: Canada MEA Centrifugal Pumps Industry Revenue (Million) Forecast, by Application 2019 & 2032
- Table 42: Canada MEA Centrifugal Pumps Industry Volume (K Unit) Forecast, by Application 2019 & 2032
- Table 43: Mexico MEA Centrifugal Pumps Industry Revenue (Million) Forecast, by Application 2019 & 2032
- Table 44: Mexico MEA Centrifugal Pumps Industry Volume (K Unit) Forecast, by Application 2019 & 2032
- Table 45: Global MEA Centrifugal Pumps Industry Revenue Million Forecast, by Flow Type 2019 & 2032
- Table 46: Global MEA Centrifugal Pumps Industry Volume K Unit Forecast, by Flow Type 2019 & 2032
- Table 47: Global MEA Centrifugal Pumps Industry Revenue Million Forecast, by Number of Stages 2019 & 2032
- Table 48: Global MEA Centrifugal Pumps Industry Volume K Unit Forecast, by Number of Stages 2019 & 2032
- Table 49: Global MEA Centrifugal Pumps Industry Revenue Million Forecast, by End-User Industry 2019 & 2032
- Table 50: Global MEA Centrifugal Pumps Industry Volume K Unit Forecast, by End-User Industry 2019 & 2032
- Table 51: Global MEA Centrifugal Pumps Industry Revenue Million Forecast, by Country 2019 & 2032
- Table 52: Global MEA Centrifugal Pumps Industry Volume K Unit Forecast, by Country 2019 & 2032
- Table 53: Brazil MEA Centrifugal Pumps Industry Revenue (Million) Forecast, by Application 2019 & 2032
- Table 54: Brazil MEA Centrifugal Pumps Industry Volume (K Unit) Forecast, by Application 2019 & 2032
- Table 55: Argentina MEA Centrifugal Pumps Industry Revenue (Million) Forecast, by Application 2019 & 2032
- Table 56: Argentina MEA Centrifugal Pumps Industry Volume (K Unit) Forecast, by Application 2019 & 2032
- Table 57: Rest of South America MEA Centrifugal Pumps Industry Revenue (Million) Forecast, by Application 2019 & 2032
- Table 58: Rest of South America MEA Centrifugal Pumps Industry Volume (K Unit) Forecast, by Application 2019 & 2032
- Table 59: Global MEA Centrifugal Pumps Industry Revenue Million Forecast, by Flow Type 2019 & 2032
- Table 60: Global MEA Centrifugal Pumps Industry Volume K Unit Forecast, by Flow Type 2019 & 2032
- Table 61: Global MEA Centrifugal Pumps Industry Revenue Million Forecast, by Number of Stages 2019 & 2032
- Table 62: Global MEA Centrifugal Pumps Industry Volume K Unit Forecast, by Number of Stages 2019 & 2032
- Table 63: Global MEA Centrifugal Pumps Industry Revenue Million Forecast, by End-User Industry 2019 & 2032
- Table 64: Global MEA Centrifugal Pumps Industry Volume K Unit Forecast, by End-User Industry 2019 & 2032
- Table 65: Global MEA Centrifugal Pumps Industry Revenue Million Forecast, by Country 2019 & 2032
- Table 66: Global MEA Centrifugal Pumps Industry Volume K Unit Forecast, by Country 2019 & 2032
- Table 67: United Kingdom MEA Centrifugal Pumps Industry Revenue (Million) Forecast, by Application 2019 & 2032
- Table 68: United Kingdom MEA Centrifugal Pumps Industry Volume (K Unit) Forecast, by Application 2019 & 2032
- Table 69: Germany MEA Centrifugal Pumps Industry Revenue (Million) Forecast, by Application 2019 & 2032
- Table 70: Germany MEA Centrifugal Pumps Industry Volume (K Unit) Forecast, by Application 2019 & 2032
- Table 71: France MEA Centrifugal Pumps Industry Revenue (Million) Forecast, by Application 2019 & 2032
- Table 72: France MEA Centrifugal Pumps Industry Volume (K Unit) Forecast, by Application 2019 & 2032
- Table 73: Italy MEA Centrifugal Pumps Industry Revenue (Million) Forecast, by Application 2019 & 2032
- Table 74: Italy MEA Centrifugal Pumps Industry Volume (K Unit) Forecast, by Application 2019 & 2032
- Table 75: Spain MEA Centrifugal Pumps Industry Revenue (Million) Forecast, by Application 2019 & 2032
- Table 76: Spain MEA Centrifugal Pumps Industry Volume (K Unit) Forecast, by Application 2019 & 2032
- Table 77: Russia MEA Centrifugal Pumps Industry Revenue (Million) Forecast, by Application 2019 & 2032
- Table 78: Russia MEA Centrifugal Pumps Industry Volume (K Unit) Forecast, by Application 2019 & 2032
- Table 79: Benelux MEA Centrifugal Pumps Industry Revenue (Million) Forecast, by Application 2019 & 2032
- Table 80: Benelux MEA Centrifugal Pumps Industry Volume (K Unit) Forecast, by Application 2019 & 2032
- Table 81: Nordics MEA Centrifugal Pumps Industry Revenue (Million) Forecast, by Application 2019 & 2032
- Table 82: Nordics MEA Centrifugal Pumps Industry Volume (K Unit) Forecast, by Application 2019 & 2032
- Table 83: Rest of Europe MEA Centrifugal Pumps Industry Revenue (Million) Forecast, by Application 2019 & 2032
- Table 84: Rest of Europe MEA Centrifugal Pumps Industry Volume (K Unit) Forecast, by Application 2019 & 2032
- Table 85: Global MEA Centrifugal Pumps Industry Revenue Million Forecast, by Flow Type 2019 & 2032
- Table 86: Global MEA Centrifugal Pumps Industry Volume K Unit Forecast, by Flow Type 2019 & 2032
- Table 87: Global MEA Centrifugal Pumps Industry Revenue Million Forecast, by Number of Stages 2019 & 2032
- Table 88: Global MEA Centrifugal Pumps Industry Volume K Unit Forecast, by Number of Stages 2019 & 2032
- Table 89: Global MEA Centrifugal Pumps Industry Revenue Million Forecast, by End-User Industry 2019 & 2032
- Table 90: Global MEA Centrifugal Pumps Industry Volume K Unit Forecast, by End-User Industry 2019 & 2032
- Table 91: Global MEA Centrifugal Pumps Industry Revenue Million Forecast, by Country 2019 & 2032
- Table 92: Global MEA Centrifugal Pumps Industry Volume K Unit Forecast, by Country 2019 & 2032
- Table 93: Turkey MEA Centrifugal Pumps Industry Revenue (Million) Forecast, by Application 2019 & 2032
- Table 94: Turkey MEA Centrifugal Pumps Industry Volume (K Unit) Forecast, by Application 2019 & 2032
- Table 95: Israel MEA Centrifugal Pumps Industry Revenue (Million) Forecast, by Application 2019 & 2032
- Table 96: Israel MEA Centrifugal Pumps Industry Volume (K Unit) Forecast, by Application 2019 & 2032
- Table 97: GCC MEA Centrifugal Pumps Industry Revenue (Million) Forecast, by Application 2019 & 2032
- Table 98: GCC MEA Centrifugal Pumps Industry Volume (K Unit) Forecast, by Application 2019 & 2032
- Table 99: North Africa MEA Centrifugal Pumps Industry Revenue (Million) Forecast, by Application 2019 & 2032
- Table 100: North Africa MEA Centrifugal Pumps Industry Volume (K Unit) Forecast, by Application 2019 & 2032
- Table 101: South Africa MEA Centrifugal Pumps Industry Revenue (Million) Forecast, by Application 2019 & 2032
- Table 102: South Africa MEA Centrifugal Pumps Industry Volume (K Unit) Forecast, by Application 2019 & 2032
- Table 103: Rest of Middle East & Africa MEA Centrifugal Pumps Industry Revenue (Million) Forecast, by Application 2019 & 2032
- Table 104: Rest of Middle East & Africa MEA Centrifugal Pumps Industry Volume (K Unit) Forecast, by Application 2019 & 2032
- Table 105: Global MEA Centrifugal Pumps Industry Revenue Million Forecast, by Flow Type 2019 & 2032
- Table 106: Global MEA Centrifugal Pumps Industry Volume K Unit Forecast, by Flow Type 2019 & 2032
- Table 107: Global MEA Centrifugal Pumps Industry Revenue Million Forecast, by Number of Stages 2019 & 2032
- Table 108: Global MEA Centrifugal Pumps Industry Volume K Unit Forecast, by Number of Stages 2019 & 2032
- Table 109: Global MEA Centrifugal Pumps Industry Revenue Million Forecast, by End-User Industry 2019 & 2032
- Table 110: Global MEA Centrifugal Pumps Industry Volume K Unit Forecast, by End-User Industry 2019 & 2032
- Table 111: Global MEA Centrifugal Pumps Industry Revenue Million Forecast, by Country 2019 & 2032
- Table 112: Global MEA Centrifugal Pumps Industry Volume K Unit Forecast, by Country 2019 & 2032
- Table 113: China MEA Centrifugal Pumps Industry Revenue (Million) Forecast, by Application 2019 & 2032
- Table 114: China MEA Centrifugal Pumps Industry Volume (K Unit) Forecast, by Application 2019 & 2032
- Table 115: India MEA Centrifugal Pumps Industry Revenue (Million) Forecast, by Application 2019 & 2032
- Table 116: India MEA Centrifugal Pumps Industry Volume (K Unit) Forecast, by Application 2019 & 2032
- Table 117: Japan MEA Centrifugal Pumps Industry Revenue (Million) Forecast, by Application 2019 & 2032
- Table 118: Japan MEA Centrifugal Pumps Industry Volume (K Unit) Forecast, by Application 2019 & 2032
- Table 119: South Korea MEA Centrifugal Pumps Industry Revenue (Million) Forecast, by Application 2019 & 2032
- Table 120: South Korea MEA Centrifugal Pumps Industry Volume (K Unit) Forecast, by Application 2019 & 2032
- Table 121: ASEAN MEA Centrifugal Pumps Industry Revenue (Million) Forecast, by Application 2019 & 2032
- Table 122: ASEAN MEA Centrifugal Pumps Industry Volume (K Unit) Forecast, by Application 2019 & 2032
- Table 123: Oceania MEA Centrifugal Pumps Industry Revenue (Million) Forecast, by Application 2019 & 2032
- Table 124: Oceania MEA Centrifugal Pumps Industry Volume (K Unit) Forecast, by Application 2019 & 2032
- Table 125: Rest of Asia Pacific MEA Centrifugal Pumps Industry Revenue (Million) Forecast, by Application 2019 & 2032
- Table 126: Rest of Asia Pacific MEA Centrifugal Pumps Industry Volume (K Unit) Forecast, by Application 2019 & 2032
Frequently Asked Questions
1. What is the projected Compound Annual Growth Rate (CAGR) of the MEA Centrifugal Pumps Industry?
The projected CAGR is approximately 4.60%.
2. Which companies are prominent players in the MEA Centrifugal Pumps Industry?
Key companies in the market include Ebara Pumps Middle East FZE, KSB Middle East FZE, Flowserve Corporation, The Weir Group PLC, Ruhrpumpen Group, Dover Corporation, Baker Hughes Company, Xylem Inc , Schlumberger Limited, Parker Hannifin Corp.
3. What are the main segments of the MEA Centrifugal Pumps Industry?
The market segments include Flow Type, Number of Stages, End-User Industry.
4. Can you provide details about the market size?
The market size is estimated to be USD XX Million as of 2022.
5. What are some drivers contributing to market growth?
Rapid Industrialization & Urbanization; Increasing Investments in Urban Waste-Water Sector.
6. What are the notable trends driving market growth?
Water and Wastewater Management to Drive the Demand for Centrifugal Pumps.
7. Are there any restraints impacting market growth?
High Acquisition and Maintenace Cost of Industrial CT systems.
8. Can you provide examples of recent developments in the market?
June 2021 - Amarinth, a global manufacturer of low lifecycle cost centrifugal pumps and associated equipment for various industries, announced that it had secured an order with its agent NAMA for 14 API 610 VS4 vertical pumps from ISCCO for the ADNOC Ruwais Refinery East, UAE.
9. What pricing options are available for accessing the report?
Pricing options include single-user, multi-user, and enterprise licenses priced at USD 4750, USD 4950, and USD 6800 respectively.
10. Is the market size provided in terms of value or volume?
The market size is provided in terms of value, measured in Million and volume, measured in K Unit.
11. Are there any specific market keywords associated with the report?
Yes, the market keyword associated with the report is "MEA Centrifugal Pumps Industry," which aids in identifying and referencing the specific market segment covered.
12. How do I determine which pricing option suits my needs best?
The pricing options vary based on user requirements and access needs. Individual users may opt for single-user licenses, while businesses requiring broader access may choose multi-user or enterprise licenses for cost-effective access to the report.
13. Are there any additional resources or data provided in the MEA Centrifugal Pumps Industry report?
While the report offers comprehensive insights, it's advisable to review the specific contents or supplementary materials provided to ascertain if additional resources or data are available.
14. How can I stay updated on further developments or reports in the MEA Centrifugal Pumps Industry?
To stay informed about further developments, trends, and reports in the MEA Centrifugal Pumps Industry, consider subscribing to industry newsletters, following relevant companies and organizations, or regularly checking reputable industry news sources and publications.
Methodology
Step 1 - Identification of Relevant Samples Size from Population Database


Step 2 - Approaches for Defining Global Market Size (Value, Volume* & Price*)

Note*: In applicable scenarios
Step 3 - Data Sources
Primary Research
- Web Analytics
- Survey Reports
- Research Institute
- Latest Research Reports
- Opinion Leaders
Secondary Research
- Annual Reports
- White Paper
- Latest Press Release
- Industry Association
- Paid Database
- Investor Presentations

Step 4 - Data Triangulation
Involves using different sources of information in order to increase the validity of a study
These sources are likely to be stakeholders in a program - participants, other researchers, program staff, other community members, and so on.
Then we put all data in single framework & apply various statistical tools to find out the dynamic on the market.
During the analysis stage, feedback from the stakeholder groups would be compared to determine areas of agreement as well as areas of divergence
