

Key Insights
The Low Volatile Organic Compounds (VOC) Coating Additives market is experiencing robust growth, driven by stringent environmental regulations aimed at reducing air pollution and the increasing demand for sustainable and eco-friendly coatings across various industries. The market's Compound Annual Growth Rate (CAGR) exceeding 5% indicates a significant expansion projected through 2033. Key drivers include the rising adoption of water-based and solvent-borne coatings with reduced VOC content, particularly in the building and construction, automotive, and furniture sectors. Growth is further fueled by technological advancements leading to the development of high-performance, low-VOC additives that enhance the properties of coatings without compromising quality. The market is segmented by product type (defoamers, dispersants, wetting agents, rheology modifiers, and others) and end-user industry. While the building and construction sector currently dominates, growth in the automotive and aerospace segments is expected to contribute significantly to overall market expansion. Competitive pressures exist among major players such as Synthomer plc, BASF SE, and Dow, driving innovation and strategic partnerships. Geographical expansion, particularly in rapidly developing economies in Asia Pacific, presents lucrative opportunities. Challenges remain in balancing the cost-effectiveness of low-VOC additives with their performance characteristics, potentially impacting adoption rates in price-sensitive markets.
Despite challenges, the long-term outlook for the low-VOC coating additives market remains positive. The increasing awareness of environmental concerns and the rising demand for sustainable products across multiple sectors will continue to propel market growth. Further innovation in additive technology, focusing on improved performance and reduced costs, will be crucial in expanding market penetration and securing long-term growth. Regional variations in regulations and economic conditions will influence growth rates in different geographical areas. Companies are likely to focus on developing customized solutions tailored to specific applications and end-user needs to maintain a competitive edge. Strategic partnerships and mergers and acquisitions are anticipated as key strategies for expanding market share and technological capabilities.
Low Volatile Organic Compounds (VOC) Coating Additives Market Report: 2019-2033
This comprehensive report provides an in-depth analysis of the Low Volatile Organic Compounds (VOC) Coating Additives market, offering invaluable insights for industry stakeholders seeking to navigate this dynamic landscape. Covering the period from 2019 to 2033, with a focus on 2025, this report delves into market dynamics, leading players, emerging trends, and future growth opportunities. Maximize your understanding of this crucial market segment and gain a competitive edge with this data-driven analysis.
Low Volatile Organic Compounds Coating Additives Market Market Dynamics & Concentration
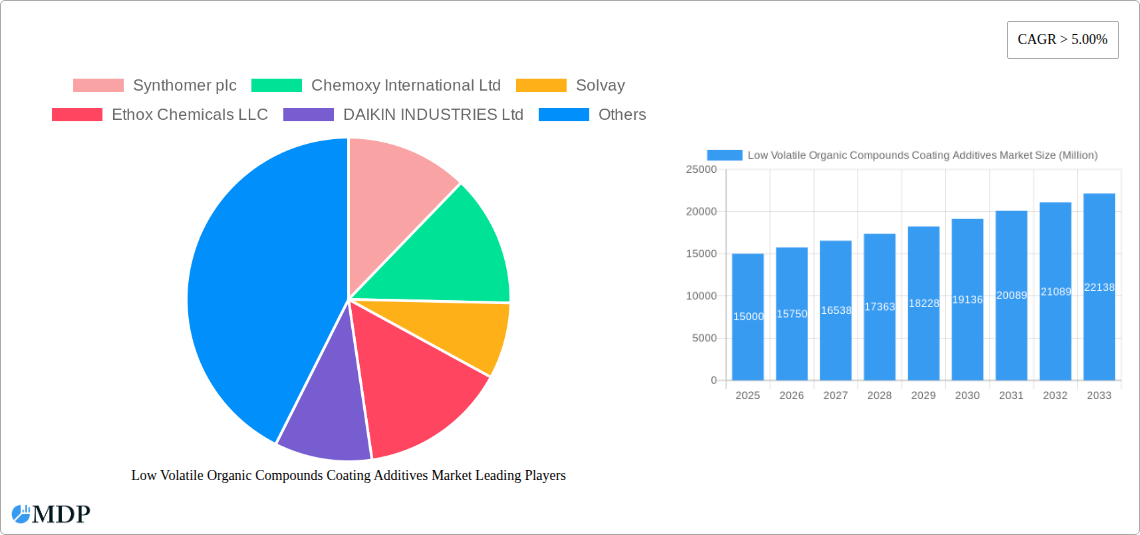
The Low VOC Coating Additives market, valued at xx Million in 2025, is experiencing a period of significant transformation. Market concentration is moderate, with key players like Synthomer plc, Solvay, and BASF SE holding substantial shares, but a fragmented landscape exists with numerous smaller specialized companies. Innovation is a key driver, fueled by stringent environmental regulations and the growing demand for sustainable coatings. The market is subject to evolving regulatory frameworks concerning VOC emissions, impacting product formulations and market access. Product substitutes, such as water-based alternatives, pose a competitive threat, while the increasing adoption of eco-friendly coatings across diverse end-user industries is a major growth catalyst. M&A activity remains relatively low; however, xx M&A deals were recorded between 2019-2024, indicative of strategic consolidation within the sector.
- Market Share: Synthomer plc (xx%), Solvay (xx%), BASF SE (xx%), Others (xx%)
- Innovation Drivers: Stringent environmental regulations, demand for sustainable coatings.
- Regulatory Frameworks: Varying regional regulations on VOC emissions.
- Product Substitutes: Water-based coatings, bio-based alternatives.
- End-User Trends: Increasing demand from the building and construction, automotive, and furniture sectors.
- M&A Activities: xx deals between 2019-2024.
Low Volatile Organic Compounds Coating Additives Market Industry Trends & Analysis
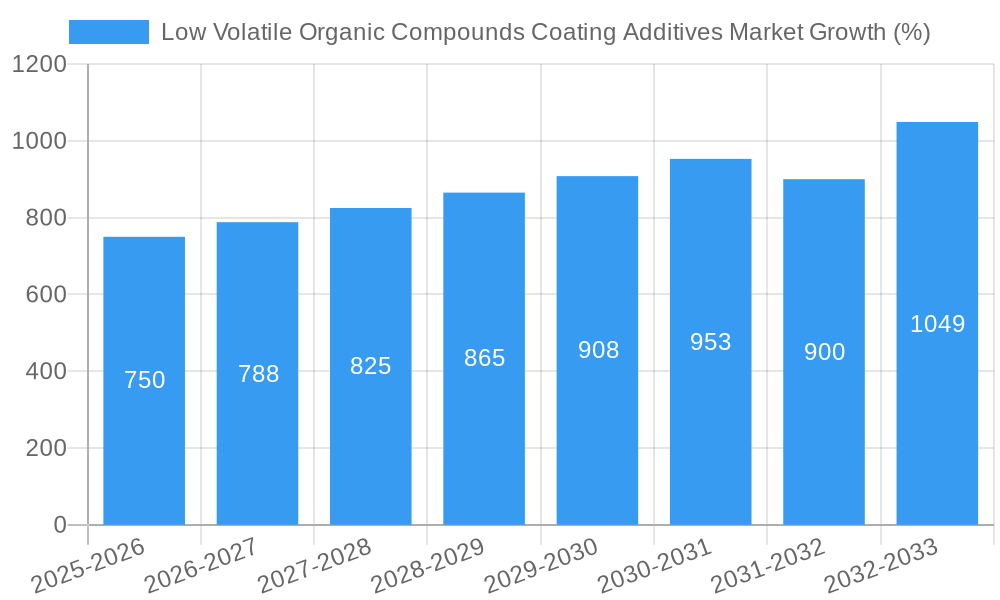
The Low VOC Coating Additives market exhibits a robust Compound Annual Growth Rate (CAGR) of xx% during the forecast period (2025-2033). This growth is driven by several factors, including increasing environmental awareness among consumers and stricter regulations limiting VOC emissions in various regions. Technological advancements in additive formulations, leading to improved performance and reduced environmental impact, are also significant contributors. Market penetration of low VOC additives is steadily rising, particularly in the automotive and building and construction sectors, driven by stringent emission standards. Competitive dynamics are characterized by a mix of intense competition among established players and the emergence of innovative niche players.
Leading Markets & Segments in Low Volatile Organic Compounds Coating Additives Market
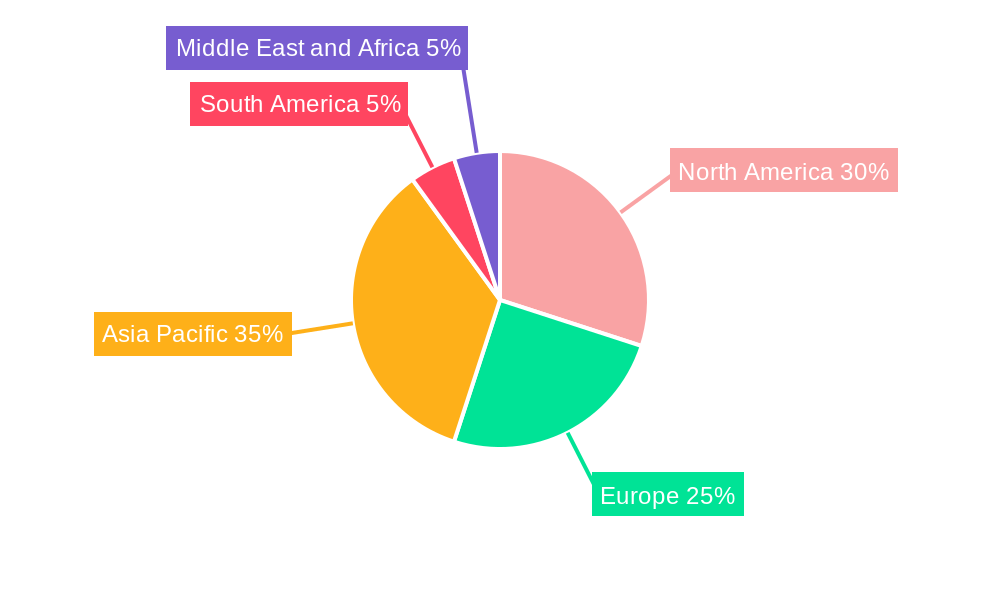
The building and construction sector represents the largest end-user segment, accounting for xx% of the total market in 2025, followed by the automotive sector at xx%. Within product types, Rheology Modifiers hold the largest market share, driven by the increasing demand for high-performance coatings. Geographically, North America and Europe currently dominate the market, propelled by robust infrastructure development and stringent environmental regulations. Asia-Pacific, however, is expected to witness significant growth in the forecast period, fueled by expanding industrialization and increasing construction activities.
- Key Drivers in Building & Construction: Robust infrastructure development, government initiatives for green buildings.
- Key Drivers in Automotive: Stringent emission standards, demand for high-performance coatings.
- Dominant Product Type: Rheology Modifiers (due to its functionality and broad application in various coating types).
- Dominant Region: North America (xx% market share in 2025)
Low Volatile Organic Compounds Coating Additives Market Product Developments
Recent product developments focus on enhancing performance characteristics while minimizing environmental impact. Innovations include the introduction of bio-based additives, advanced rheology modifiers offering improved flow and leveling, and high-performance defoamers with reduced VOC content. These advancements cater to the growing demand for sustainable and high-quality coatings across various applications, providing significant competitive advantages for manufacturers.
Key Drivers of Low Volatile Organic Compounds Coating Additives Market Growth
Several factors contribute to the market's expansion. Stringent environmental regulations globally are pushing for the adoption of low-VOC alternatives. The rising demand for sustainable and eco-friendly coatings across diverse sectors, such as automotive and construction, is another key driver. Technological advancements continuously improve additive performance, leading to enhanced coating properties and cost efficiency.
Challenges in the Low Volatile Organic Compounds Coating Additives Market Market
The market faces challenges including fluctuating raw material prices, supply chain disruptions, and intense competition among established and emerging players. Regulatory compliance adds complexity and costs, impacting profitability. Meeting the diverse and ever-evolving requirements of various end-user industries necessitates continuous innovation and adaptation.
Emerging Opportunities in Low Volatile Organic Compounds Coating Additives Market
Significant opportunities lie in the development of bio-based and recyclable coating additives. Strategic partnerships and collaborations aimed at enhancing supply chain resilience and accessing new markets can further propel growth. Expansion into rapidly growing economies, particularly in Asia-Pacific, presents considerable potential.
Leading Players in the Low Volatile Organic Compounds Coating Additives Market Sector
- Synthomer plc
- Chemoxy International Ltd
- Solvay
- Ethox Chemicals LLC
- DAIKIN INDUSTRIES Ltd
- Croda International Plc
- BASF SE
- SEQENS
- Dow
- Eastman Chemical Company
- The Lubrizol Corporation
- Axalta Coating Systems LLC
- Evonik AG
- Emerald Kalama Chemical
- Borchers Inc
- Matthews Paint
Key Milestones in Low Volatile Organic Compounds Coating Additives Market Industry
- 2020: Introduction of a new bio-based defoamer by Croda International Plc.
- 2022: Solvay launches a range of high-performance rheology modifiers with reduced VOC content.
- 2023: BASF SE acquires a smaller specialty chemicals company specializing in low-VOC additives.
Strategic Outlook for Low Volatile Organic Compounds Coating Additives Market Market
The Low VOC Coating Additives market is poised for sustained growth, driven by ongoing technological advancements, stricter environmental regulations, and increasing demand for sustainable solutions. Strategic partnerships, investments in R&D, and targeted market expansion into high-growth regions will be key success factors for players seeking to capitalize on this promising market.
Low Volatile Organic Compounds Coating Additives Market Segmentation
-
1. Product Type
- 1.1. Defoamers
- 1.2. Dispersants
- 1.3. Wetting Agents
- 1.4. Rheology Modifiers
- 1.5. Others
-
2. End-user Industry
- 2.1. Building and Construction
- 2.2. Automotive
- 2.3. Aerospace
- 2.4. Furniture
- 2.5. Others
Low Volatile Organic Compounds Coating Additives Market Segmentation By Geography
-
1. Asia Pacific
- 1.1. China
- 1.2. India
- 1.3. Japan
- 1.4. South Korea
- 1.5. Rest of Asia Pacific
-
2. North America
- 2.1. United States
- 2.2. Canada
- 2.3. Mexico
-
3. Europe
- 3.1. Germany
- 3.2. United Kingdom
- 3.3. France
- 3.4. Italy
- 3.5. Rest of Europe
-
4. South America
- 4.1. Brazil
- 4.2. Argentina
- 4.3. Rest of South America
-
5. Middle East and Africa
- 5.1. Saudi Arabia
- 5.2. South Africa
- 5.3. Rest of Middle East and Africa
Low Volatile Organic Compounds Coating Additives Market REPORT HIGHLIGHTS
| Aspects | Details |
|---|---|
| Study Period | 2019-2033 |
| Base Year | 2024 |
| Estimated Year | 2025 |
| Forecast Period | 2025-2033 |
| Historical Period | 2019-2024 |
| Growth Rate | CAGR of > 5.00% from 2019-2033 |
| Segmentation |
|
Table of Contents
- 1. Introduction
- 1.1. Research Scope
- 1.2. Market Segmentation
- 1.3. Research Methodology
- 1.4. Definitions and Assumptions
- 2. Executive Summary
- 2.1. Introduction
- 3. Market Dynamics
- 3.1. Introduction
- 3.2. Market Drivers
- 3.2.1. ; Growing Demand from Building and Construction Industry; Other Drivers
- 3.3. Market Restrains
- 3.3.1. ; Unfavorable Conditions Arising Due to COVID-19 Outbreak; Other Restraints
- 3.4. Market Trends
- 3.4.1. Building and Construction Industry to Dominate the Market
- 4. Market Factor Analysis
- 4.1. Porters Five Forces
- 4.2. Supply/Value Chain
- 4.3. PESTEL analysis
- 4.4. Market Entropy
- 4.5. Patent/Trademark Analysis
- 5. Global Low Volatile Organic Compounds Coating Additives Market Analysis, Insights and Forecast, 2019-2031
- 5.1. Market Analysis, Insights and Forecast - by Product Type
- 5.1.1. Defoamers
- 5.1.2. Dispersants
- 5.1.3. Wetting Agents
- 5.1.4. Rheology Modifiers
- 5.1.5. Others
- 5.2. Market Analysis, Insights and Forecast - by End-user Industry
- 5.2.1. Building and Construction
- 5.2.2. Automotive
- 5.2.3. Aerospace
- 5.2.4. Furniture
- 5.2.5. Others
- 5.3. Market Analysis, Insights and Forecast - by Region
- 5.3.1. Asia Pacific
- 5.3.2. North America
- 5.3.3. Europe
- 5.3.4. South America
- 5.3.5. Middle East and Africa
- 5.1. Market Analysis, Insights and Forecast - by Product Type
- 6. Asia Pacific Low Volatile Organic Compounds Coating Additives Market Analysis, Insights and Forecast, 2019-2031
- 6.1. Market Analysis, Insights and Forecast - by Product Type
- 6.1.1. Defoamers
- 6.1.2. Dispersants
- 6.1.3. Wetting Agents
- 6.1.4. Rheology Modifiers
- 6.1.5. Others
- 6.2. Market Analysis, Insights and Forecast - by End-user Industry
- 6.2.1. Building and Construction
- 6.2.2. Automotive
- 6.2.3. Aerospace
- 6.2.4. Furniture
- 6.2.5. Others
- 6.1. Market Analysis, Insights and Forecast - by Product Type
- 7. North America Low Volatile Organic Compounds Coating Additives Market Analysis, Insights and Forecast, 2019-2031
- 7.1. Market Analysis, Insights and Forecast - by Product Type
- 7.1.1. Defoamers
- 7.1.2. Dispersants
- 7.1.3. Wetting Agents
- 7.1.4. Rheology Modifiers
- 7.1.5. Others
- 7.2. Market Analysis, Insights and Forecast - by End-user Industry
- 7.2.1. Building and Construction
- 7.2.2. Automotive
- 7.2.3. Aerospace
- 7.2.4. Furniture
- 7.2.5. Others
- 7.1. Market Analysis, Insights and Forecast - by Product Type
- 8. Europe Low Volatile Organic Compounds Coating Additives Market Analysis, Insights and Forecast, 2019-2031
- 8.1. Market Analysis, Insights and Forecast - by Product Type
- 8.1.1. Defoamers
- 8.1.2. Dispersants
- 8.1.3. Wetting Agents
- 8.1.4. Rheology Modifiers
- 8.1.5. Others
- 8.2. Market Analysis, Insights and Forecast - by End-user Industry
- 8.2.1. Building and Construction
- 8.2.2. Automotive
- 8.2.3. Aerospace
- 8.2.4. Furniture
- 8.2.5. Others
- 8.1. Market Analysis, Insights and Forecast - by Product Type
- 9. South America Low Volatile Organic Compounds Coating Additives Market Analysis, Insights and Forecast, 2019-2031
- 9.1. Market Analysis, Insights and Forecast - by Product Type
- 9.1.1. Defoamers
- 9.1.2. Dispersants
- 9.1.3. Wetting Agents
- 9.1.4. Rheology Modifiers
- 9.1.5. Others
- 9.2. Market Analysis, Insights and Forecast - by End-user Industry
- 9.2.1. Building and Construction
- 9.2.2. Automotive
- 9.2.3. Aerospace
- 9.2.4. Furniture
- 9.2.5. Others
- 9.1. Market Analysis, Insights and Forecast - by Product Type
- 10. Middle East and Africa Low Volatile Organic Compounds Coating Additives Market Analysis, Insights and Forecast, 2019-2031
- 10.1. Market Analysis, Insights and Forecast - by Product Type
- 10.1.1. Defoamers
- 10.1.2. Dispersants
- 10.1.3. Wetting Agents
- 10.1.4. Rheology Modifiers
- 10.1.5. Others
- 10.2. Market Analysis, Insights and Forecast - by End-user Industry
- 10.2.1. Building and Construction
- 10.2.2. Automotive
- 10.2.3. Aerospace
- 10.2.4. Furniture
- 10.2.5. Others
- 10.1. Market Analysis, Insights and Forecast - by Product Type
- 11. Asia Pacific Low Volatile Organic Compounds Coating Additives Market Analysis, Insights and Forecast, 2019-2031
- 11.1. Market Analysis, Insights and Forecast - By Country/Sub-region
- 11.1.1 China
- 11.1.2 India
- 11.1.3 Japan
- 11.1.4 South Korea
- 11.1.5 Rest of Asia Pacific
- 12. North America Low Volatile Organic Compounds Coating Additives Market Analysis, Insights and Forecast, 2019-2031
- 12.1. Market Analysis, Insights and Forecast - By Country/Sub-region
- 12.1.1 United States
- 12.1.2 Canada
- 12.1.3 Mexico
- 13. Europe Low Volatile Organic Compounds Coating Additives Market Analysis, Insights and Forecast, 2019-2031
- 13.1. Market Analysis, Insights and Forecast - By Country/Sub-region
- 13.1.1 Germany
- 13.1.2 United Kingdom
- 13.1.3 France
- 13.1.4 Italy
- 13.1.5 Rest of Europe
- 14. South America Low Volatile Organic Compounds Coating Additives Market Analysis, Insights and Forecast, 2019-2031
- 14.1. Market Analysis, Insights and Forecast - By Country/Sub-region
- 14.1.1 Brazil
- 14.1.2 Argentina
- 14.1.3 Rest of South America
- 15. Middle East and Africa Low Volatile Organic Compounds Coating Additives Market Analysis, Insights and Forecast, 2019-2031
- 15.1. Market Analysis, Insights and Forecast - By Country/Sub-region
- 15.1.1 Saudi Arabia
- 15.1.2 South Africa
- 15.1.3 Rest of Middle East and Africa
- 16. Competitive Analysis
- 16.1. Global Market Share Analysis 2024
- 16.2. Company Profiles
- 16.2.1 Synthomer plc
- 16.2.1.1. Overview
- 16.2.1.2. Products
- 16.2.1.3. SWOT Analysis
- 16.2.1.4. Recent Developments
- 16.2.1.5. Financials (Based on Availability)
- 16.2.2 Chemoxy International Ltd
- 16.2.2.1. Overview
- 16.2.2.2. Products
- 16.2.2.3. SWOT Analysis
- 16.2.2.4. Recent Developments
- 16.2.2.5. Financials (Based on Availability)
- 16.2.3 Solvay
- 16.2.3.1. Overview
- 16.2.3.2. Products
- 16.2.3.3. SWOT Analysis
- 16.2.3.4. Recent Developments
- 16.2.3.5. Financials (Based on Availability)
- 16.2.4 Ethox Chemicals LLC
- 16.2.4.1. Overview
- 16.2.4.2. Products
- 16.2.4.3. SWOT Analysis
- 16.2.4.4. Recent Developments
- 16.2.4.5. Financials (Based on Availability)
- 16.2.5 DAIKIN INDUSTRIES Ltd
- 16.2.5.1. Overview
- 16.2.5.2. Products
- 16.2.5.3. SWOT Analysis
- 16.2.5.4. Recent Developments
- 16.2.5.5. Financials (Based on Availability)
- 16.2.6 Croda International Plc
- 16.2.6.1. Overview
- 16.2.6.2. Products
- 16.2.6.3. SWOT Analysis
- 16.2.6.4. Recent Developments
- 16.2.6.5. Financials (Based on Availability)
- 16.2.7 BASF SE
- 16.2.7.1. Overview
- 16.2.7.2. Products
- 16.2.7.3. SWOT Analysis
- 16.2.7.4. Recent Developments
- 16.2.7.5. Financials (Based on Availability)
- 16.2.8 SEQENS
- 16.2.8.1. Overview
- 16.2.8.2. Products
- 16.2.8.3. SWOT Analysis
- 16.2.8.4. Recent Developments
- 16.2.8.5. Financials (Based on Availability)
- 16.2.9 Dow
- 16.2.9.1. Overview
- 16.2.9.2. Products
- 16.2.9.3. SWOT Analysis
- 16.2.9.4. Recent Developments
- 16.2.9.5. Financials (Based on Availability)
- 16.2.10 Eastman Chemical Company
- 16.2.10.1. Overview
- 16.2.10.2. Products
- 16.2.10.3. SWOT Analysis
- 16.2.10.4. Recent Developments
- 16.2.10.5. Financials (Based on Availability)
- 16.2.11 The Lubrizol Corporation
- 16.2.11.1. Overview
- 16.2.11.2. Products
- 16.2.11.3. SWOT Analysis
- 16.2.11.4. Recent Developments
- 16.2.11.5. Financials (Based on Availability)
- 16.2.12 Axalta Coating Systems LLC
- 16.2.12.1. Overview
- 16.2.12.2. Products
- 16.2.12.3. SWOT Analysis
- 16.2.12.4. Recent Developments
- 16.2.12.5. Financials (Based on Availability)
- 16.2.13 Evonik AG
- 16.2.13.1. Overview
- 16.2.13.2. Products
- 16.2.13.3. SWOT Analysis
- 16.2.13.4. Recent Developments
- 16.2.13.5. Financials (Based on Availability)
- 16.2.14 Emerald Kalama Chemical
- 16.2.14.1. Overview
- 16.2.14.2. Products
- 16.2.14.3. SWOT Analysis
- 16.2.14.4. Recent Developments
- 16.2.14.5. Financials (Based on Availability)
- 16.2.15 Borchers Inc
- 16.2.15.1. Overview
- 16.2.15.2. Products
- 16.2.15.3. SWOT Analysis
- 16.2.15.4. Recent Developments
- 16.2.15.5. Financials (Based on Availability)
- 16.2.16 Matthews Paint
- 16.2.16.1. Overview
- 16.2.16.2. Products
- 16.2.16.3. SWOT Analysis
- 16.2.16.4. Recent Developments
- 16.2.16.5. Financials (Based on Availability)
- 16.2.1 Synthomer plc
List of Figures
- Figure 1: Global Low Volatile Organic Compounds Coating Additives Market Revenue Breakdown (Million, %) by Region 2024 & 2032
- Figure 2: Global Low Volatile Organic Compounds Coating Additives Market Volume Breakdown (K Tons, %) by Region 2024 & 2032
- Figure 3: Asia Pacific Low Volatile Organic Compounds Coating Additives Market Revenue (Million), by Country 2024 & 2032
- Figure 4: Asia Pacific Low Volatile Organic Compounds Coating Additives Market Volume (K Tons), by Country 2024 & 2032
- Figure 5: Asia Pacific Low Volatile Organic Compounds Coating Additives Market Revenue Share (%), by Country 2024 & 2032
- Figure 6: Asia Pacific Low Volatile Organic Compounds Coating Additives Market Volume Share (%), by Country 2024 & 2032
- Figure 7: North America Low Volatile Organic Compounds Coating Additives Market Revenue (Million), by Country 2024 & 2032
- Figure 8: North America Low Volatile Organic Compounds Coating Additives Market Volume (K Tons), by Country 2024 & 2032
- Figure 9: North America Low Volatile Organic Compounds Coating Additives Market Revenue Share (%), by Country 2024 & 2032
- Figure 10: North America Low Volatile Organic Compounds Coating Additives Market Volume Share (%), by Country 2024 & 2032
- Figure 11: Europe Low Volatile Organic Compounds Coating Additives Market Revenue (Million), by Country 2024 & 2032
- Figure 12: Europe Low Volatile Organic Compounds Coating Additives Market Volume (K Tons), by Country 2024 & 2032
- Figure 13: Europe Low Volatile Organic Compounds Coating Additives Market Revenue Share (%), by Country 2024 & 2032
- Figure 14: Europe Low Volatile Organic Compounds Coating Additives Market Volume Share (%), by Country 2024 & 2032
- Figure 15: South America Low Volatile Organic Compounds Coating Additives Market Revenue (Million), by Country 2024 & 2032
- Figure 16: South America Low Volatile Organic Compounds Coating Additives Market Volume (K Tons), by Country 2024 & 2032
- Figure 17: South America Low Volatile Organic Compounds Coating Additives Market Revenue Share (%), by Country 2024 & 2032
- Figure 18: South America Low Volatile Organic Compounds Coating Additives Market Volume Share (%), by Country 2024 & 2032
- Figure 19: Middle East and Africa Low Volatile Organic Compounds Coating Additives Market Revenue (Million), by Country 2024 & 2032
- Figure 20: Middle East and Africa Low Volatile Organic Compounds Coating Additives Market Volume (K Tons), by Country 2024 & 2032
- Figure 21: Middle East and Africa Low Volatile Organic Compounds Coating Additives Market Revenue Share (%), by Country 2024 & 2032
- Figure 22: Middle East and Africa Low Volatile Organic Compounds Coating Additives Market Volume Share (%), by Country 2024 & 2032
- Figure 23: Asia Pacific Low Volatile Organic Compounds Coating Additives Market Revenue (Million), by Product Type 2024 & 2032
- Figure 24: Asia Pacific Low Volatile Organic Compounds Coating Additives Market Volume (K Tons), by Product Type 2024 & 2032
- Figure 25: Asia Pacific Low Volatile Organic Compounds Coating Additives Market Revenue Share (%), by Product Type 2024 & 2032
- Figure 26: Asia Pacific Low Volatile Organic Compounds Coating Additives Market Volume Share (%), by Product Type 2024 & 2032
- Figure 27: Asia Pacific Low Volatile Organic Compounds Coating Additives Market Revenue (Million), by End-user Industry 2024 & 2032
- Figure 28: Asia Pacific Low Volatile Organic Compounds Coating Additives Market Volume (K Tons), by End-user Industry 2024 & 2032
- Figure 29: Asia Pacific Low Volatile Organic Compounds Coating Additives Market Revenue Share (%), by End-user Industry 2024 & 2032
- Figure 30: Asia Pacific Low Volatile Organic Compounds Coating Additives Market Volume Share (%), by End-user Industry 2024 & 2032
- Figure 31: Asia Pacific Low Volatile Organic Compounds Coating Additives Market Revenue (Million), by Country 2024 & 2032
- Figure 32: Asia Pacific Low Volatile Organic Compounds Coating Additives Market Volume (K Tons), by Country 2024 & 2032
- Figure 33: Asia Pacific Low Volatile Organic Compounds Coating Additives Market Revenue Share (%), by Country 2024 & 2032
- Figure 34: Asia Pacific Low Volatile Organic Compounds Coating Additives Market Volume Share (%), by Country 2024 & 2032
- Figure 35: North America Low Volatile Organic Compounds Coating Additives Market Revenue (Million), by Product Type 2024 & 2032
- Figure 36: North America Low Volatile Organic Compounds Coating Additives Market Volume (K Tons), by Product Type 2024 & 2032
- Figure 37: North America Low Volatile Organic Compounds Coating Additives Market Revenue Share (%), by Product Type 2024 & 2032
- Figure 38: North America Low Volatile Organic Compounds Coating Additives Market Volume Share (%), by Product Type 2024 & 2032
- Figure 39: North America Low Volatile Organic Compounds Coating Additives Market Revenue (Million), by End-user Industry 2024 & 2032
- Figure 40: North America Low Volatile Organic Compounds Coating Additives Market Volume (K Tons), by End-user Industry 2024 & 2032
- Figure 41: North America Low Volatile Organic Compounds Coating Additives Market Revenue Share (%), by End-user Industry 2024 & 2032
- Figure 42: North America Low Volatile Organic Compounds Coating Additives Market Volume Share (%), by End-user Industry 2024 & 2032
- Figure 43: North America Low Volatile Organic Compounds Coating Additives Market Revenue (Million), by Country 2024 & 2032
- Figure 44: North America Low Volatile Organic Compounds Coating Additives Market Volume (K Tons), by Country 2024 & 2032
- Figure 45: North America Low Volatile Organic Compounds Coating Additives Market Revenue Share (%), by Country 2024 & 2032
- Figure 46: North America Low Volatile Organic Compounds Coating Additives Market Volume Share (%), by Country 2024 & 2032
- Figure 47: Europe Low Volatile Organic Compounds Coating Additives Market Revenue (Million), by Product Type 2024 & 2032
- Figure 48: Europe Low Volatile Organic Compounds Coating Additives Market Volume (K Tons), by Product Type 2024 & 2032
- Figure 49: Europe Low Volatile Organic Compounds Coating Additives Market Revenue Share (%), by Product Type 2024 & 2032
- Figure 50: Europe Low Volatile Organic Compounds Coating Additives Market Volume Share (%), by Product Type 2024 & 2032
- Figure 51: Europe Low Volatile Organic Compounds Coating Additives Market Revenue (Million), by End-user Industry 2024 & 2032
- Figure 52: Europe Low Volatile Organic Compounds Coating Additives Market Volume (K Tons), by End-user Industry 2024 & 2032
- Figure 53: Europe Low Volatile Organic Compounds Coating Additives Market Revenue Share (%), by End-user Industry 2024 & 2032
- Figure 54: Europe Low Volatile Organic Compounds Coating Additives Market Volume Share (%), by End-user Industry 2024 & 2032
- Figure 55: Europe Low Volatile Organic Compounds Coating Additives Market Revenue (Million), by Country 2024 & 2032
- Figure 56: Europe Low Volatile Organic Compounds Coating Additives Market Volume (K Tons), by Country 2024 & 2032
- Figure 57: Europe Low Volatile Organic Compounds Coating Additives Market Revenue Share (%), by Country 2024 & 2032
- Figure 58: Europe Low Volatile Organic Compounds Coating Additives Market Volume Share (%), by Country 2024 & 2032
- Figure 59: South America Low Volatile Organic Compounds Coating Additives Market Revenue (Million), by Product Type 2024 & 2032
- Figure 60: South America Low Volatile Organic Compounds Coating Additives Market Volume (K Tons), by Product Type 2024 & 2032
- Figure 61: South America Low Volatile Organic Compounds Coating Additives Market Revenue Share (%), by Product Type 2024 & 2032
- Figure 62: South America Low Volatile Organic Compounds Coating Additives Market Volume Share (%), by Product Type 2024 & 2032
- Figure 63: South America Low Volatile Organic Compounds Coating Additives Market Revenue (Million), by End-user Industry 2024 & 2032
- Figure 64: South America Low Volatile Organic Compounds Coating Additives Market Volume (K Tons), by End-user Industry 2024 & 2032
- Figure 65: South America Low Volatile Organic Compounds Coating Additives Market Revenue Share (%), by End-user Industry 2024 & 2032
- Figure 66: South America Low Volatile Organic Compounds Coating Additives Market Volume Share (%), by End-user Industry 2024 & 2032
- Figure 67: South America Low Volatile Organic Compounds Coating Additives Market Revenue (Million), by Country 2024 & 2032
- Figure 68: South America Low Volatile Organic Compounds Coating Additives Market Volume (K Tons), by Country 2024 & 2032
- Figure 69: South America Low Volatile Organic Compounds Coating Additives Market Revenue Share (%), by Country 2024 & 2032
- Figure 70: South America Low Volatile Organic Compounds Coating Additives Market Volume Share (%), by Country 2024 & 2032
- Figure 71: Middle East and Africa Low Volatile Organic Compounds Coating Additives Market Revenue (Million), by Product Type 2024 & 2032
- Figure 72: Middle East and Africa Low Volatile Organic Compounds Coating Additives Market Volume (K Tons), by Product Type 2024 & 2032
- Figure 73: Middle East and Africa Low Volatile Organic Compounds Coating Additives Market Revenue Share (%), by Product Type 2024 & 2032
- Figure 74: Middle East and Africa Low Volatile Organic Compounds Coating Additives Market Volume Share (%), by Product Type 2024 & 2032
- Figure 75: Middle East and Africa Low Volatile Organic Compounds Coating Additives Market Revenue (Million), by End-user Industry 2024 & 2032
- Figure 76: Middle East and Africa Low Volatile Organic Compounds Coating Additives Market Volume (K Tons), by End-user Industry 2024 & 2032
- Figure 77: Middle East and Africa Low Volatile Organic Compounds Coating Additives Market Revenue Share (%), by End-user Industry 2024 & 2032
- Figure 78: Middle East and Africa Low Volatile Organic Compounds Coating Additives Market Volume Share (%), by End-user Industry 2024 & 2032
- Figure 79: Middle East and Africa Low Volatile Organic Compounds Coating Additives Market Revenue (Million), by Country 2024 & 2032
- Figure 80: Middle East and Africa Low Volatile Organic Compounds Coating Additives Market Volume (K Tons), by Country 2024 & 2032
- Figure 81: Middle East and Africa Low Volatile Organic Compounds Coating Additives Market Revenue Share (%), by Country 2024 & 2032
- Figure 82: Middle East and Africa Low Volatile Organic Compounds Coating Additives Market Volume Share (%), by Country 2024 & 2032
List of Tables
- Table 1: Global Low Volatile Organic Compounds Coating Additives Market Revenue Million Forecast, by Region 2019 & 2032
- Table 2: Global Low Volatile Organic Compounds Coating Additives Market Volume K Tons Forecast, by Region 2019 & 2032
- Table 3: Global Low Volatile Organic Compounds Coating Additives Market Revenue Million Forecast, by Product Type 2019 & 2032
- Table 4: Global Low Volatile Organic Compounds Coating Additives Market Volume K Tons Forecast, by Product Type 2019 & 2032
- Table 5: Global Low Volatile Organic Compounds Coating Additives Market Revenue Million Forecast, by End-user Industry 2019 & 2032
- Table 6: Global Low Volatile Organic Compounds Coating Additives Market Volume K Tons Forecast, by End-user Industry 2019 & 2032
- Table 7: Global Low Volatile Organic Compounds Coating Additives Market Revenue Million Forecast, by Region 2019 & 2032
- Table 8: Global Low Volatile Organic Compounds Coating Additives Market Volume K Tons Forecast, by Region 2019 & 2032
- Table 9: Global Low Volatile Organic Compounds Coating Additives Market Revenue Million Forecast, by Country 2019 & 2032
- Table 10: Global Low Volatile Organic Compounds Coating Additives Market Volume K Tons Forecast, by Country 2019 & 2032
- Table 11: China Low Volatile Organic Compounds Coating Additives Market Revenue (Million) Forecast, by Application 2019 & 2032
- Table 12: China Low Volatile Organic Compounds Coating Additives Market Volume (K Tons) Forecast, by Application 2019 & 2032
- Table 13: India Low Volatile Organic Compounds Coating Additives Market Revenue (Million) Forecast, by Application 2019 & 2032
- Table 14: India Low Volatile Organic Compounds Coating Additives Market Volume (K Tons) Forecast, by Application 2019 & 2032
- Table 15: Japan Low Volatile Organic Compounds Coating Additives Market Revenue (Million) Forecast, by Application 2019 & 2032
- Table 16: Japan Low Volatile Organic Compounds Coating Additives Market Volume (K Tons) Forecast, by Application 2019 & 2032
- Table 17: South Korea Low Volatile Organic Compounds Coating Additives Market Revenue (Million) Forecast, by Application 2019 & 2032
- Table 18: South Korea Low Volatile Organic Compounds Coating Additives Market Volume (K Tons) Forecast, by Application 2019 & 2032
- Table 19: Rest of Asia Pacific Low Volatile Organic Compounds Coating Additives Market Revenue (Million) Forecast, by Application 2019 & 2032
- Table 20: Rest of Asia Pacific Low Volatile Organic Compounds Coating Additives Market Volume (K Tons) Forecast, by Application 2019 & 2032
- Table 21: Global Low Volatile Organic Compounds Coating Additives Market Revenue Million Forecast, by Country 2019 & 2032
- Table 22: Global Low Volatile Organic Compounds Coating Additives Market Volume K Tons Forecast, by Country 2019 & 2032
- Table 23: United States Low Volatile Organic Compounds Coating Additives Market Revenue (Million) Forecast, by Application 2019 & 2032
- Table 24: United States Low Volatile Organic Compounds Coating Additives Market Volume (K Tons) Forecast, by Application 2019 & 2032
- Table 25: Canada Low Volatile Organic Compounds Coating Additives Market Revenue (Million) Forecast, by Application 2019 & 2032
- Table 26: Canada Low Volatile Organic Compounds Coating Additives Market Volume (K Tons) Forecast, by Application 2019 & 2032
- Table 27: Mexico Low Volatile Organic Compounds Coating Additives Market Revenue (Million) Forecast, by Application 2019 & 2032
- Table 28: Mexico Low Volatile Organic Compounds Coating Additives Market Volume (K Tons) Forecast, by Application 2019 & 2032
- Table 29: Global Low Volatile Organic Compounds Coating Additives Market Revenue Million Forecast, by Country 2019 & 2032
- Table 30: Global Low Volatile Organic Compounds Coating Additives Market Volume K Tons Forecast, by Country 2019 & 2032
- Table 31: Germany Low Volatile Organic Compounds Coating Additives Market Revenue (Million) Forecast, by Application 2019 & 2032
- Table 32: Germany Low Volatile Organic Compounds Coating Additives Market Volume (K Tons) Forecast, by Application 2019 & 2032
- Table 33: United Kingdom Low Volatile Organic Compounds Coating Additives Market Revenue (Million) Forecast, by Application 2019 & 2032
- Table 34: United Kingdom Low Volatile Organic Compounds Coating Additives Market Volume (K Tons) Forecast, by Application 2019 & 2032
- Table 35: France Low Volatile Organic Compounds Coating Additives Market Revenue (Million) Forecast, by Application 2019 & 2032
- Table 36: France Low Volatile Organic Compounds Coating Additives Market Volume (K Tons) Forecast, by Application 2019 & 2032
- Table 37: Italy Low Volatile Organic Compounds Coating Additives Market Revenue (Million) Forecast, by Application 2019 & 2032
- Table 38: Italy Low Volatile Organic Compounds Coating Additives Market Volume (K Tons) Forecast, by Application 2019 & 2032
- Table 39: Rest of Europe Low Volatile Organic Compounds Coating Additives Market Revenue (Million) Forecast, by Application 2019 & 2032
- Table 40: Rest of Europe Low Volatile Organic Compounds Coating Additives Market Volume (K Tons) Forecast, by Application 2019 & 2032
- Table 41: Global Low Volatile Organic Compounds Coating Additives Market Revenue Million Forecast, by Country 2019 & 2032
- Table 42: Global Low Volatile Organic Compounds Coating Additives Market Volume K Tons Forecast, by Country 2019 & 2032
- Table 43: Brazil Low Volatile Organic Compounds Coating Additives Market Revenue (Million) Forecast, by Application 2019 & 2032
- Table 44: Brazil Low Volatile Organic Compounds Coating Additives Market Volume (K Tons) Forecast, by Application 2019 & 2032
- Table 45: Argentina Low Volatile Organic Compounds Coating Additives Market Revenue (Million) Forecast, by Application 2019 & 2032
- Table 46: Argentina Low Volatile Organic Compounds Coating Additives Market Volume (K Tons) Forecast, by Application 2019 & 2032
- Table 47: Rest of South America Low Volatile Organic Compounds Coating Additives Market Revenue (Million) Forecast, by Application 2019 & 2032
- Table 48: Rest of South America Low Volatile Organic Compounds Coating Additives Market Volume (K Tons) Forecast, by Application 2019 & 2032
- Table 49: Global Low Volatile Organic Compounds Coating Additives Market Revenue Million Forecast, by Country 2019 & 2032
- Table 50: Global Low Volatile Organic Compounds Coating Additives Market Volume K Tons Forecast, by Country 2019 & 2032
- Table 51: Saudi Arabia Low Volatile Organic Compounds Coating Additives Market Revenue (Million) Forecast, by Application 2019 & 2032
- Table 52: Saudi Arabia Low Volatile Organic Compounds Coating Additives Market Volume (K Tons) Forecast, by Application 2019 & 2032
- Table 53: South Africa Low Volatile Organic Compounds Coating Additives Market Revenue (Million) Forecast, by Application 2019 & 2032
- Table 54: South Africa Low Volatile Organic Compounds Coating Additives Market Volume (K Tons) Forecast, by Application 2019 & 2032
- Table 55: Rest of Middle East and Africa Low Volatile Organic Compounds Coating Additives Market Revenue (Million) Forecast, by Application 2019 & 2032
- Table 56: Rest of Middle East and Africa Low Volatile Organic Compounds Coating Additives Market Volume (K Tons) Forecast, by Application 2019 & 2032
- Table 57: Global Low Volatile Organic Compounds Coating Additives Market Revenue Million Forecast, by Product Type 2019 & 2032
- Table 58: Global Low Volatile Organic Compounds Coating Additives Market Volume K Tons Forecast, by Product Type 2019 & 2032
- Table 59: Global Low Volatile Organic Compounds Coating Additives Market Revenue Million Forecast, by End-user Industry 2019 & 2032
- Table 60: Global Low Volatile Organic Compounds Coating Additives Market Volume K Tons Forecast, by End-user Industry 2019 & 2032
- Table 61: Global Low Volatile Organic Compounds Coating Additives Market Revenue Million Forecast, by Country 2019 & 2032
- Table 62: Global Low Volatile Organic Compounds Coating Additives Market Volume K Tons Forecast, by Country 2019 & 2032
- Table 63: China Low Volatile Organic Compounds Coating Additives Market Revenue (Million) Forecast, by Application 2019 & 2032
- Table 64: China Low Volatile Organic Compounds Coating Additives Market Volume (K Tons) Forecast, by Application 2019 & 2032
- Table 65: India Low Volatile Organic Compounds Coating Additives Market Revenue (Million) Forecast, by Application 2019 & 2032
- Table 66: India Low Volatile Organic Compounds Coating Additives Market Volume (K Tons) Forecast, by Application 2019 & 2032
- Table 67: Japan Low Volatile Organic Compounds Coating Additives Market Revenue (Million) Forecast, by Application 2019 & 2032
- Table 68: Japan Low Volatile Organic Compounds Coating Additives Market Volume (K Tons) Forecast, by Application 2019 & 2032
- Table 69: South Korea Low Volatile Organic Compounds Coating Additives Market Revenue (Million) Forecast, by Application 2019 & 2032
- Table 70: South Korea Low Volatile Organic Compounds Coating Additives Market Volume (K Tons) Forecast, by Application 2019 & 2032
- Table 71: Rest of Asia Pacific Low Volatile Organic Compounds Coating Additives Market Revenue (Million) Forecast, by Application 2019 & 2032
- Table 72: Rest of Asia Pacific Low Volatile Organic Compounds Coating Additives Market Volume (K Tons) Forecast, by Application 2019 & 2032
- Table 73: Global Low Volatile Organic Compounds Coating Additives Market Revenue Million Forecast, by Product Type 2019 & 2032
- Table 74: Global Low Volatile Organic Compounds Coating Additives Market Volume K Tons Forecast, by Product Type 2019 & 2032
- Table 75: Global Low Volatile Organic Compounds Coating Additives Market Revenue Million Forecast, by End-user Industry 2019 & 2032
- Table 76: Global Low Volatile Organic Compounds Coating Additives Market Volume K Tons Forecast, by End-user Industry 2019 & 2032
- Table 77: Global Low Volatile Organic Compounds Coating Additives Market Revenue Million Forecast, by Country 2019 & 2032
- Table 78: Global Low Volatile Organic Compounds Coating Additives Market Volume K Tons Forecast, by Country 2019 & 2032
- Table 79: United States Low Volatile Organic Compounds Coating Additives Market Revenue (Million) Forecast, by Application 2019 & 2032
- Table 80: United States Low Volatile Organic Compounds Coating Additives Market Volume (K Tons) Forecast, by Application 2019 & 2032
- Table 81: Canada Low Volatile Organic Compounds Coating Additives Market Revenue (Million) Forecast, by Application 2019 & 2032
- Table 82: Canada Low Volatile Organic Compounds Coating Additives Market Volume (K Tons) Forecast, by Application 2019 & 2032
- Table 83: Mexico Low Volatile Organic Compounds Coating Additives Market Revenue (Million) Forecast, by Application 2019 & 2032
- Table 84: Mexico Low Volatile Organic Compounds Coating Additives Market Volume (K Tons) Forecast, by Application 2019 & 2032
- Table 85: Global Low Volatile Organic Compounds Coating Additives Market Revenue Million Forecast, by Product Type 2019 & 2032
- Table 86: Global Low Volatile Organic Compounds Coating Additives Market Volume K Tons Forecast, by Product Type 2019 & 2032
- Table 87: Global Low Volatile Organic Compounds Coating Additives Market Revenue Million Forecast, by End-user Industry 2019 & 2032
- Table 88: Global Low Volatile Organic Compounds Coating Additives Market Volume K Tons Forecast, by End-user Industry 2019 & 2032
- Table 89: Global Low Volatile Organic Compounds Coating Additives Market Revenue Million Forecast, by Country 2019 & 2032
- Table 90: Global Low Volatile Organic Compounds Coating Additives Market Volume K Tons Forecast, by Country 2019 & 2032
- Table 91: Germany Low Volatile Organic Compounds Coating Additives Market Revenue (Million) Forecast, by Application 2019 & 2032
- Table 92: Germany Low Volatile Organic Compounds Coating Additives Market Volume (K Tons) Forecast, by Application 2019 & 2032
- Table 93: United Kingdom Low Volatile Organic Compounds Coating Additives Market Revenue (Million) Forecast, by Application 2019 & 2032
- Table 94: United Kingdom Low Volatile Organic Compounds Coating Additives Market Volume (K Tons) Forecast, by Application 2019 & 2032
- Table 95: France Low Volatile Organic Compounds Coating Additives Market Revenue (Million) Forecast, by Application 2019 & 2032
- Table 96: France Low Volatile Organic Compounds Coating Additives Market Volume (K Tons) Forecast, by Application 2019 & 2032
- Table 97: Italy Low Volatile Organic Compounds Coating Additives Market Revenue (Million) Forecast, by Application 2019 & 2032
- Table 98: Italy Low Volatile Organic Compounds Coating Additives Market Volume (K Tons) Forecast, by Application 2019 & 2032
- Table 99: Rest of Europe Low Volatile Organic Compounds Coating Additives Market Revenue (Million) Forecast, by Application 2019 & 2032
- Table 100: Rest of Europe Low Volatile Organic Compounds Coating Additives Market Volume (K Tons) Forecast, by Application 2019 & 2032
- Table 101: Global Low Volatile Organic Compounds Coating Additives Market Revenue Million Forecast, by Product Type 2019 & 2032
- Table 102: Global Low Volatile Organic Compounds Coating Additives Market Volume K Tons Forecast, by Product Type 2019 & 2032
- Table 103: Global Low Volatile Organic Compounds Coating Additives Market Revenue Million Forecast, by End-user Industry 2019 & 2032
- Table 104: Global Low Volatile Organic Compounds Coating Additives Market Volume K Tons Forecast, by End-user Industry 2019 & 2032
- Table 105: Global Low Volatile Organic Compounds Coating Additives Market Revenue Million Forecast, by Country 2019 & 2032
- Table 106: Global Low Volatile Organic Compounds Coating Additives Market Volume K Tons Forecast, by Country 2019 & 2032
- Table 107: Brazil Low Volatile Organic Compounds Coating Additives Market Revenue (Million) Forecast, by Application 2019 & 2032
- Table 108: Brazil Low Volatile Organic Compounds Coating Additives Market Volume (K Tons) Forecast, by Application 2019 & 2032
- Table 109: Argentina Low Volatile Organic Compounds Coating Additives Market Revenue (Million) Forecast, by Application 2019 & 2032
- Table 110: Argentina Low Volatile Organic Compounds Coating Additives Market Volume (K Tons) Forecast, by Application 2019 & 2032
- Table 111: Rest of South America Low Volatile Organic Compounds Coating Additives Market Revenue (Million) Forecast, by Application 2019 & 2032
- Table 112: Rest of South America Low Volatile Organic Compounds Coating Additives Market Volume (K Tons) Forecast, by Application 2019 & 2032
- Table 113: Global Low Volatile Organic Compounds Coating Additives Market Revenue Million Forecast, by Product Type 2019 & 2032
- Table 114: Global Low Volatile Organic Compounds Coating Additives Market Volume K Tons Forecast, by Product Type 2019 & 2032
- Table 115: Global Low Volatile Organic Compounds Coating Additives Market Revenue Million Forecast, by End-user Industry 2019 & 2032
- Table 116: Global Low Volatile Organic Compounds Coating Additives Market Volume K Tons Forecast, by End-user Industry 2019 & 2032
- Table 117: Global Low Volatile Organic Compounds Coating Additives Market Revenue Million Forecast, by Country 2019 & 2032
- Table 118: Global Low Volatile Organic Compounds Coating Additives Market Volume K Tons Forecast, by Country 2019 & 2032
- Table 119: Saudi Arabia Low Volatile Organic Compounds Coating Additives Market Revenue (Million) Forecast, by Application 2019 & 2032
- Table 120: Saudi Arabia Low Volatile Organic Compounds Coating Additives Market Volume (K Tons) Forecast, by Application 2019 & 2032
- Table 121: South Africa Low Volatile Organic Compounds Coating Additives Market Revenue (Million) Forecast, by Application 2019 & 2032
- Table 122: South Africa Low Volatile Organic Compounds Coating Additives Market Volume (K Tons) Forecast, by Application 2019 & 2032
- Table 123: Rest of Middle East and Africa Low Volatile Organic Compounds Coating Additives Market Revenue (Million) Forecast, by Application 2019 & 2032
- Table 124: Rest of Middle East and Africa Low Volatile Organic Compounds Coating Additives Market Volume (K Tons) Forecast, by Application 2019 & 2032
Frequently Asked Questions
1. What is the projected Compound Annual Growth Rate (CAGR) of the Low Volatile Organic Compounds Coating Additives Market?
The projected CAGR is approximately > 5.00%.
2. Which companies are prominent players in the Low Volatile Organic Compounds Coating Additives Market?
Key companies in the market include Synthomer plc, Chemoxy International Ltd, Solvay, Ethox Chemicals LLC, DAIKIN INDUSTRIES Ltd, Croda International Plc, BASF SE, SEQENS, Dow, Eastman Chemical Company, The Lubrizol Corporation, Axalta Coating Systems LLC, Evonik AG, Emerald Kalama Chemical, Borchers Inc, Matthews Paint.
3. What are the main segments of the Low Volatile Organic Compounds Coating Additives Market?
The market segments include Product Type, End-user Industry.
4. Can you provide details about the market size?
The market size is estimated to be USD XX Million as of 2022.
5. What are some drivers contributing to market growth?
; Growing Demand from Building and Construction Industry; Other Drivers.
6. What are the notable trends driving market growth?
Building and Construction Industry to Dominate the Market.
7. Are there any restraints impacting market growth?
; Unfavorable Conditions Arising Due to COVID-19 Outbreak; Other Restraints.
8. Can you provide examples of recent developments in the market?
N/A
9. What pricing options are available for accessing the report?
Pricing options include single-user, multi-user, and enterprise licenses priced at USD 4750, USD 5250, and USD 8750 respectively.
10. Is the market size provided in terms of value or volume?
The market size is provided in terms of value, measured in Million and volume, measured in K Tons.
11. Are there any specific market keywords associated with the report?
Yes, the market keyword associated with the report is "Low Volatile Organic Compounds Coating Additives Market," which aids in identifying and referencing the specific market segment covered.
12. How do I determine which pricing option suits my needs best?
The pricing options vary based on user requirements and access needs. Individual users may opt for single-user licenses, while businesses requiring broader access may choose multi-user or enterprise licenses for cost-effective access to the report.
13. Are there any additional resources or data provided in the Low Volatile Organic Compounds Coating Additives Market report?
While the report offers comprehensive insights, it's advisable to review the specific contents or supplementary materials provided to ascertain if additional resources or data are available.
14. How can I stay updated on further developments or reports in the Low Volatile Organic Compounds Coating Additives Market?
To stay informed about further developments, trends, and reports in the Low Volatile Organic Compounds Coating Additives Market, consider subscribing to industry newsletters, following relevant companies and organizations, or regularly checking reputable industry news sources and publications.
Methodology
Step 1 - Identification of Relevant Samples Size from Population Database


Step 2 - Approaches for Defining Global Market Size (Value, Volume* & Price*)

Note*: In applicable scenarios
Step 3 - Data Sources
Primary Research
- Web Analytics
- Survey Reports
- Research Institute
- Latest Research Reports
- Opinion Leaders
Secondary Research
- Annual Reports
- White Paper
- Latest Press Release
- Industry Association
- Paid Database
- Investor Presentations

Step 4 - Data Triangulation
Involves using different sources of information in order to increase the validity of a study
These sources are likely to be stakeholders in a program - participants, other researchers, program staff, other community members, and so on.
Then we put all data in single framework & apply various statistical tools to find out the dynamic on the market.
During the analysis stage, feedback from the stakeholder groups would be compared to determine areas of agreement as well as areas of divergence
