

Key Insights
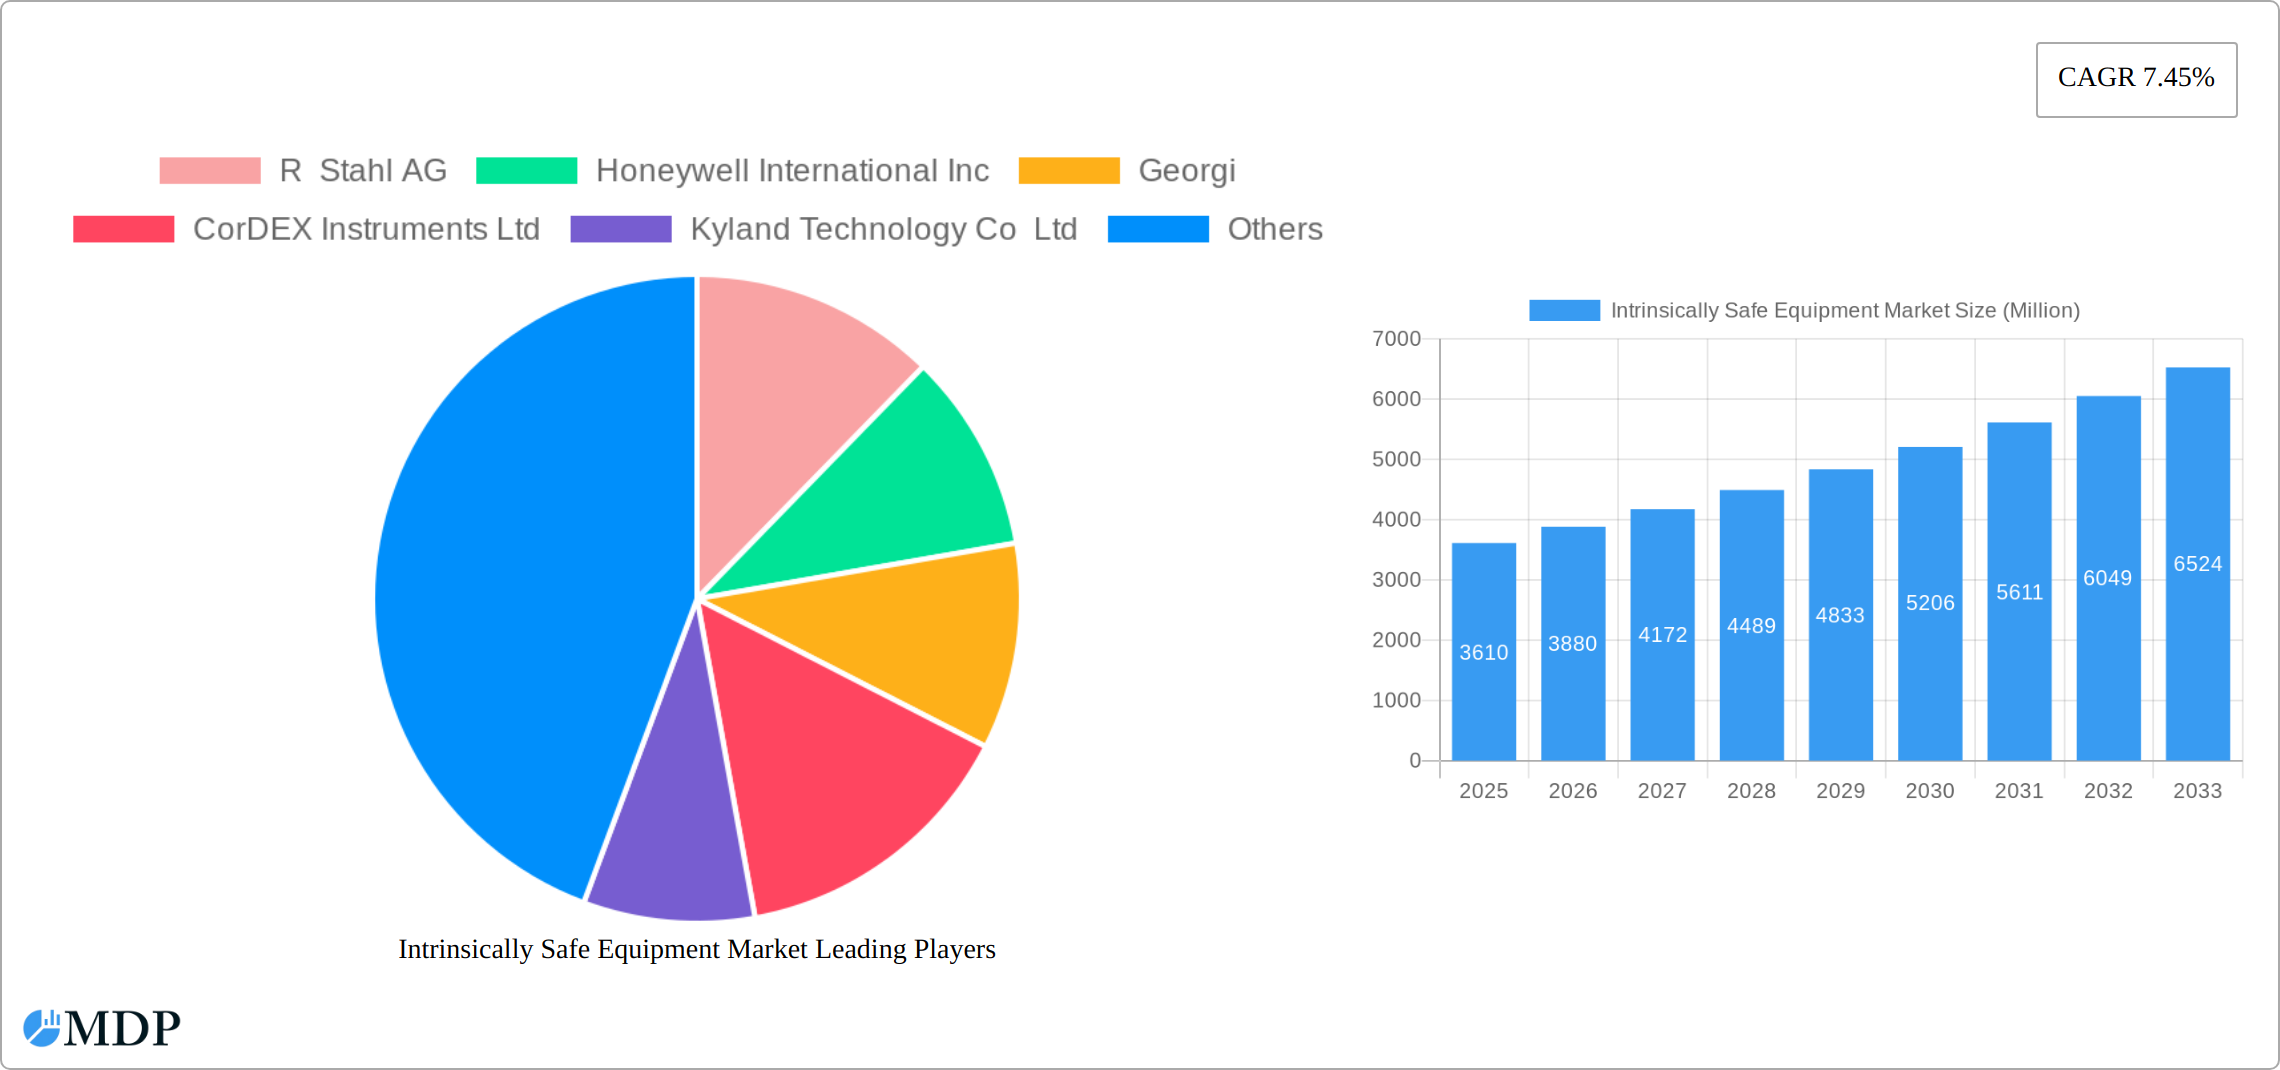
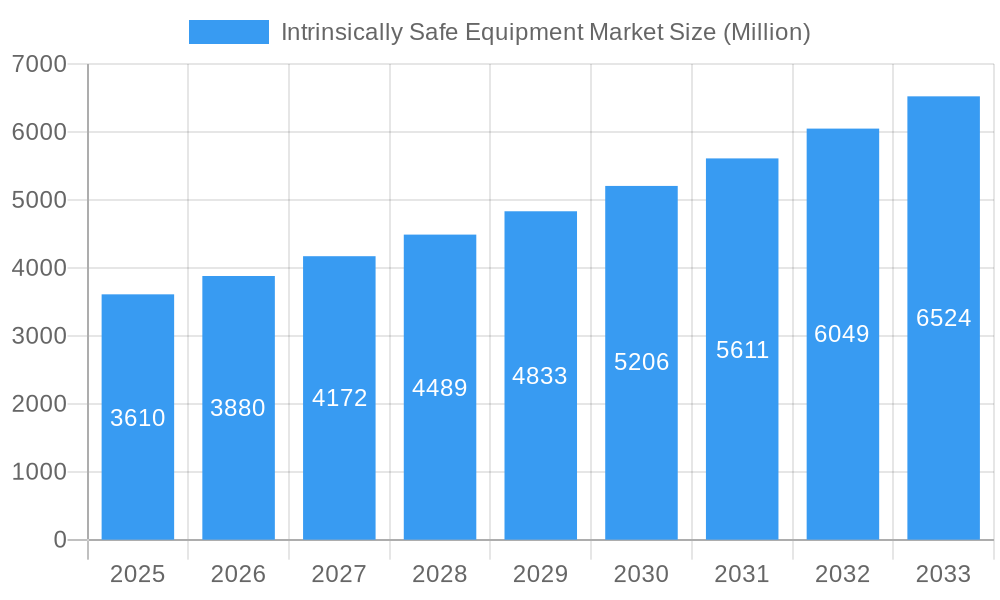
The intrinsically safe equipment market, valued at $3.61 billion in 2025, is projected to experience robust growth, driven by increasing demand across diverse sectors. The 7.45% CAGR from 2025 to 2033 indicates a significant expansion fueled by several key factors. The oil and gas industry, a major end-user, continues to invest heavily in safety equipment to mitigate risks associated with hazardous environments. Similarly, the mining and power sectors are adopting intrinsically safe equipment to enhance worker safety and operational efficiency. Growing regulatory pressure for workplace safety globally also contributes significantly to market growth. Technological advancements, such as the integration of IoT sensors and improved communication systems within intrinsically safe devices, further enhance their appeal and functionality. The market's segmentation reflects this diversification, with sensors, detectors, and transmitters comprising significant product categories. Geographically, North America and Europe are currently leading market regions, but the Asia-Pacific region is projected to witness the fastest growth, driven by industrial expansion and rising safety standards in developing economies.
Intrinsically Safe Equipment Market Market Size (In Billion)
The competitive landscape is marked by both established players like R. Stahl AG and Honeywell International Inc. and emerging companies focusing on innovative solutions. While established players benefit from brand recognition and extensive distribution networks, newer entrants often bring disruptive technologies and cost-effective solutions. Despite these positive market forces, challenges remain. The high initial investment cost of intrinsically safe equipment can be a barrier for smaller companies, and the complexity of regulations and certification processes can create hurdles for market entry. However, long-term cost savings resulting from improved safety and reduced downtime are expected to offset initial investments, fostering continued market expansion. The ongoing emphasis on sustainable practices and the integration of environmentally friendly components will also further shape the market landscape. Continuous technological advancements, improved regulatory frameworks, and a sustained focus on workplace safety are key drivers that will fuel this growth trajectory over the forecast period.
Intrinsically Safe Equipment Market Company Market Share
This comprehensive report provides an in-depth analysis of the Intrinsically Safe Equipment market, offering valuable insights for stakeholders across the industry. With a focus on market dynamics, leading players, and future trends, this report is an essential resource for strategic decision-making. The study period spans from 2019 to 2033, with a base year of 2025 and a forecast period from 2025 to 2033. The historical period covered is 2019-2024. The global market size is projected to reach xx Million by 2033.
Intrinsically Safe Equipment Market Dynamics & Concentration
The intrinsically safe equipment market is characterized by moderate concentration, with key players such as R Stahl AG, Honeywell International Inc, and Pepperl+Fuchs holding significant market share. However, the market also exhibits a considerable presence of smaller, specialized companies catering to niche applications. Innovation is a key driver, spurred by the need for enhanced safety features, improved efficiency, and the integration of advanced technologies like IoT and AI. Stringent regulatory frameworks, particularly those related to occupational safety and environmental protection, significantly influence market growth and product development. Product substitutes are limited due to the critical safety requirements, although advancements in alternative technologies are constantly being evaluated. End-user trends show a growing demand for intrinsically safe equipment across diverse sectors, including oil and gas, mining, and chemical processing. The market has witnessed a moderate level of M&A activity in recent years, with approximately xx deals recorded between 2019 and 2024. This consolidation is expected to continue as larger companies seek to expand their market reach and product portfolios.
- Market Concentration: Moderately concentrated, with top players holding xx% market share.
- Innovation Drivers: IoT integration, AI-powered predictive maintenance, enhanced safety features.
- Regulatory Frameworks: Stringent safety standards driving demand for certified equipment.
- M&A Activity: Approximately xx deals between 2019 and 2024.
Intrinsically Safe Equipment Market Industry Trends & Analysis
The intrinsically safe equipment market is experiencing robust and accelerating growth, underpinned by a confluence of compelling factors. A primary catalyst is the escalating demand for enhanced safety protocols in hazardous and potentially explosive environments across a diverse spectrum of industries, including oil & gas, chemical, pharmaceuticals, mining, and manufacturing. The relentless march of automation and digitization within industrial settings further fuels this expansion, necessitating intrinsically safe sensors, transmitters, control systems, and other critical devices that seamlessly integrate with these advanced technologies. Technological disruptions are not merely propelling market expansion but are fundamentally reshaping it; the development of cutting-edge sensor technologies offering unparalleled accuracy and sensitivity, alongside sophisticated wireless communication protocols enabling reliable data transmission in challenging conditions, are key enablers. Consumer preferences are evolving dynamically, leaning towards intrinsically safe equipment that is not only highly reliable and durable but also user-friendly and intuitively integrated into existing workflows. Competitive dynamics within the market are intensifying, characterized by a strong emphasis on relentless product innovation, strategic collaborations and partnerships aimed at expanding technological capabilities and market reach, and a concerted effort to broaden global presence. The market is projected to witness a significant Compound Annual Growth Rate (CAGR) of approximately xx% during the forecast period (2025-2033), signifying a period of substantial value creation. Market penetration of intrinsically safe technologies is steadily increasing across various sectors, with particularly noteworthy growth anticipated in developing economies that are undergoing rapid industrialization and infrastructure development.
Leading Markets & Segments in Intrinsically Safe Equipment Market
The Oil and Gas sector currently dominates the end-user segment, driven by the inherently hazardous nature of operations and strict regulatory compliance requirements. However, substantial growth is anticipated in the Mining and Chemical & Petrochemical sectors due to increasing investments in safety infrastructure and stringent safety regulations. Geographically, xx region demonstrates the strongest market presence, driven by robust industrial activity and favorable economic policies supporting infrastructural development.
- By End User:
- Oil and Gas: Highest market share due to stringent safety regulations.
- Mining: Significant growth potential due to increasing automation.
- Chemical and Petrochemical: Strong demand driven by inherent hazards.
- Power: Steady growth driven by increasing renewable energy projects.
- By Zone: [Zone details not provided, using placeholders] Zone 0, Zone 1, Zone 2, Zone 21, Zone 22, Zone 20
- By Class: [Class details not provided, using placeholders] Class I, Class II, Class III
- By Products: Sensors and detectors currently represent the largest segment, owing to increased demand for real-time monitoring and hazard detection.
Intrinsically Safe Equipment Market Product Developments
Recent groundbreaking advancements in intrinsically safe equipment are fundamentally enhancing operational safety and efficiency in hazardous environments. Key developments include the sophisticated integration of advanced wireless communication technologies, enabling real-time data transfer and remote monitoring without compromising safety standards. Miniaturization of components is leading to more compact, lightweight, and easily deployable devices. Furthermore, the development of highly sophisticated sensor technologies, characterized by enhanced accuracy, superior sensitivity, and improved reliability, is a significant trend. The market is witnessing a pronounced shift towards 'smart' and 'connected' intrinsically safe equipment, incorporating features such as advanced remote monitoring capabilities, sophisticated predictive maintenance algorithms, and integrated data analytics platforms for actionable insights. The burgeoning integration of Artificial Intelligence (AI) and Machine Learning (ML) is proving transformative, enabling more proactive and effective risk management strategies and predictive maintenance, thereby significantly reducing unplanned downtime and optimizing overall operational efficiency.
Key Drivers of Intrinsically Safe Equipment Market Growth
The market is primarily driven by the increasing need for worker safety in hazardous environments, coupled with stringent regulatory compliance requirements across numerous industries. Technological advancements, including the development of more efficient and reliable intrinsically safe devices, are another key driver. Furthermore, growing investments in infrastructure development and industrial automation across several regions, particularly developing economies, significantly contribute to the expanding market size.
Challenges in the Intrinsically Safe Equipment Market
Despite its robust growth trajectory, the intrinsically safe equipment market navigates several significant challenges. The inherent complexity and stringent safety certifications required for intrinsically safe devices often translate to a higher initial cost compared to standard industrial equipment, which can be a barrier to adoption for some businesses. The intricate design and manufacturing processes demand specialized expertise and adherence to rigorous quality control measures. Furthermore, the constant need to update compliance with evolving international safety regulations and standards presents an ongoing challenge for manufacturers. Supply chain disruptions, including the availability of specialized components and raw materials, coupled with the scarcity of a skilled labor force adept in the design, manufacturing, and maintenance of such specialized equipment, can impact production volumes and timely distribution. Intense competition among established market leaders and agile emerging companies also necessitates continuous innovation and competitive pricing strategies. These collective factors, while presenting hurdles, are being actively addressed by market participants and are expected to influence market growth to a moderate, manageable extent.
Emerging Opportunities in Intrinsically Safe Equipment Market
The intrinsically safe equipment market is ripe with significant emerging opportunities poised to drive future growth. The ongoing development and widespread deployment of advanced sensor technologies, offering enhanced precision and expanded functionality, represent a key area of opportunity. Similarly, advancements in robust and secure wireless communication protocols tailored for hazardous environments offer substantial potential for innovation and market penetration. The integration of AI and ML for sophisticated predictive maintenance and real-time anomaly detection presents lucrative avenues for enhancing operational safety, reducing downtime, and optimizing asset lifecycle management. Strategic partnerships and synergistic collaborations between intrinsically safe equipment manufacturers and leading industrial automation solution providers can unlock new markets and foster integrated system solutions. Furthermore, the expanding industrialization and infrastructure development in emerging economies and developing regions present vast untapped markets for intrinsically safe technologies, promising substantial future growth and global reach.
Leading Players in the Intrinsically Safe Equipment Market Sector
- R Stahl AG
- Honeywell International Inc
- Georgi
- CorDEX Instruments Ltd
- Kyland Technology Co Ltd
- Eaton Corporation PLC
- Fluke Corporation (Fortive Corporation)
- Bayco Products Inc
- Banner Engineering Corp
- Pepperl + Fuchs
- OMEGA Engineering (Spectris PLC)
Key Milestones in Intrinsically Safe Equipment Market Industry
- November 2023: Amazon Inc. launched AWS Monitron, an AI-powered predictive maintenance solution using wireless sensors and cloud analytics. This significantly impacts the market by introducing advanced, data-driven safety measures.
- September 2023: Red Sky Lighting's partnership with Daly Middle East expands the distribution of IEC, ATEX, and U.L. compliant lighting solutions across the GCC, increasing product availability in a key region.
Strategic Outlook for Intrinsically Safe Equipment Market Market
The intrinsically safe equipment market is poised for sustained growth, driven by ongoing technological advancements, rising safety standards, and expanding industrial activity globally. Strategic opportunities include focusing on innovative product development, leveraging AI and IoT for improved safety and efficiency, and expanding into high-growth markets. Companies prioritizing sustainable practices and offering cost-effective solutions will gain a competitive edge. The market is anticipated to witness robust growth throughout the forecast period.
Intrinsically Safe Equipment Market Segmentation
-
1. Zone
- 1.1. Zone 0
- 1.2. Zone 20
- 1.3. Zone 1
- 1.4. Zone 21
- 1.5. Zone 22
-
2. Class
- 2.1. Class 1
- 2.2. Class 2
- 2.3. Class 3
-
3. Products
- 3.1. Sensors
- 3.2. Detectors
- 3.3. Switches
- 3.4. Transmitters
- 3.5. Isolators
- 3.6. LED Indicators
- 3.7. Others Products
-
4. End User
- 4.1. Oil and Gas
- 4.2. Mining
- 4.3. Power
- 4.4. Chemical and Petrochemical
- 4.5. Processing
- 4.6. Other End Users
Intrinsically Safe Equipment Market Segmentation By Geography
-
1. North America
- 1.1. United States
- 1.2. Canada
-
2. Europe
- 2.1. Germany
- 2.2. United Kingdom
- 2.3. France
- 2.4. Rest of Europe
-
3. Asia Pacific
- 3.1. China
- 3.2. Japan
- 3.3. India
- 3.4. Rest of Asia Pacific
-
4. Latin America
- 4.1. Brazil
- 4.2. Mexico
- 4.3. Argentina
- 4.4. Rest of Latin America
- 5. Middle East
-
6. Saudi Arabia
- 6.1. United Arab Emirates
- 6.2. Rest of Middle East
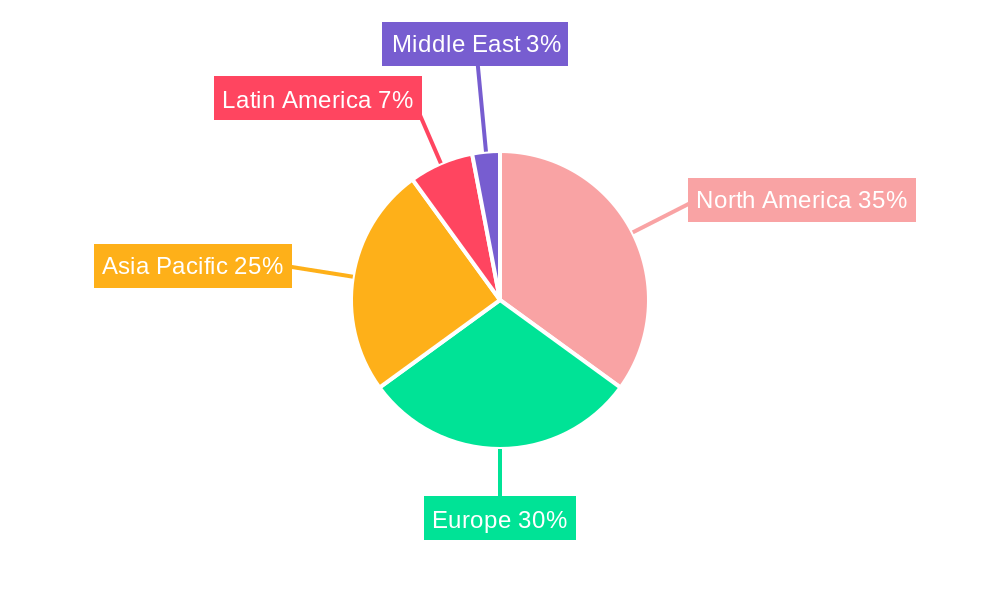
Intrinsically Safe Equipment Market Regional Market Share
Geographic Coverage of Intrinsically Safe Equipment Market
Intrinsically Safe Equipment Market REPORT HIGHLIGHTS
| Aspects | Details |
|---|---|
| Study Period | 2020-2034 |
| Base Year | 2025 |
| Estimated Year | 2026 |
| Forecast Period | 2026-2034 |
| Historical Period | 2020-2025 |
| Growth Rate | CAGR of 7.45% from 2020-2034 |
| Segmentation |
|
Table of Contents
- 1. Introduction
- 1.1. Research Scope
- 1.2. Market Segmentation
- 1.3. Research Methodology
- 1.4. Definitions and Assumptions
- 2. Executive Summary
- 2.1. Introduction
- 3. Market Dynamics
- 3.1. Introduction
- 3.2. Market Drivers
- 3.2.1 Increasing Number of Government Regulations; Growing Energy Requirements
- 3.2.2 Driving the Demand for Exploration of New Mines and Oil and Gas Resources
- 3.3. Market Restrains
- 3.3.1. ; High Cost of Energy-efficient Pumps; Fluctuations in the Price of Raw Materials
- 3.4. Market Trends
- 3.4.1. Oil and Gas End User Segment is Expected to Hold a Significant Market Share
- 4. Market Factor Analysis
- 4.1. Porters Five Forces
- 4.2. Supply/Value Chain
- 4.3. PESTEL analysis
- 4.4. Market Entropy
- 4.5. Patent/Trademark Analysis
- 5. Global Intrinsically Safe Equipment Market Analysis, Insights and Forecast, 2020-2032
- 5.1. Market Analysis, Insights and Forecast - by Zone
- 5.1.1. Zone 0
- 5.1.2. Zone 20
- 5.1.3. Zone 1
- 5.1.4. Zone 21
- 5.1.5. Zone 22
- 5.2. Market Analysis, Insights and Forecast - by Class
- 5.2.1. Class 1
- 5.2.2. Class 2
- 5.2.3. Class 3
- 5.3. Market Analysis, Insights and Forecast - by Products
- 5.3.1. Sensors
- 5.3.2. Detectors
- 5.3.3. Switches
- 5.3.4. Transmitters
- 5.3.5. Isolators
- 5.3.6. LED Indicators
- 5.3.7. Others Products
- 5.4. Market Analysis, Insights and Forecast - by End User
- 5.4.1. Oil and Gas
- 5.4.2. Mining
- 5.4.3. Power
- 5.4.4. Chemical and Petrochemical
- 5.4.5. Processing
- 5.4.6. Other End Users
- 5.5. Market Analysis, Insights and Forecast - by Region
- 5.5.1. North America
- 5.5.2. Europe
- 5.5.3. Asia Pacific
- 5.5.4. Latin America
- 5.5.5. Middle East
- 5.5.6. Saudi Arabia
- 5.1. Market Analysis, Insights and Forecast - by Zone
- 6. North America Intrinsically Safe Equipment Market Analysis, Insights and Forecast, 2020-2032
- 6.1. Market Analysis, Insights and Forecast - by Zone
- 6.1.1. Zone 0
- 6.1.2. Zone 20
- 6.1.3. Zone 1
- 6.1.4. Zone 21
- 6.1.5. Zone 22
- 6.2. Market Analysis, Insights and Forecast - by Class
- 6.2.1. Class 1
- 6.2.2. Class 2
- 6.2.3. Class 3
- 6.3. Market Analysis, Insights and Forecast - by Products
- 6.3.1. Sensors
- 6.3.2. Detectors
- 6.3.3. Switches
- 6.3.4. Transmitters
- 6.3.5. Isolators
- 6.3.6. LED Indicators
- 6.3.7. Others Products
- 6.4. Market Analysis, Insights and Forecast - by End User
- 6.4.1. Oil and Gas
- 6.4.2. Mining
- 6.4.3. Power
- 6.4.4. Chemical and Petrochemical
- 6.4.5. Processing
- 6.4.6. Other End Users
- 6.1. Market Analysis, Insights and Forecast - by Zone
- 7. Europe Intrinsically Safe Equipment Market Analysis, Insights and Forecast, 2020-2032
- 7.1. Market Analysis, Insights and Forecast - by Zone
- 7.1.1. Zone 0
- 7.1.2. Zone 20
- 7.1.3. Zone 1
- 7.1.4. Zone 21
- 7.1.5. Zone 22
- 7.2. Market Analysis, Insights and Forecast - by Class
- 7.2.1. Class 1
- 7.2.2. Class 2
- 7.2.3. Class 3
- 7.3. Market Analysis, Insights and Forecast - by Products
- 7.3.1. Sensors
- 7.3.2. Detectors
- 7.3.3. Switches
- 7.3.4. Transmitters
- 7.3.5. Isolators
- 7.3.6. LED Indicators
- 7.3.7. Others Products
- 7.4. Market Analysis, Insights and Forecast - by End User
- 7.4.1. Oil and Gas
- 7.4.2. Mining
- 7.4.3. Power
- 7.4.4. Chemical and Petrochemical
- 7.4.5. Processing
- 7.4.6. Other End Users
- 7.1. Market Analysis, Insights and Forecast - by Zone
- 8. Asia Pacific Intrinsically Safe Equipment Market Analysis, Insights and Forecast, 2020-2032
- 8.1. Market Analysis, Insights and Forecast - by Zone
- 8.1.1. Zone 0
- 8.1.2. Zone 20
- 8.1.3. Zone 1
- 8.1.4. Zone 21
- 8.1.5. Zone 22
- 8.2. Market Analysis, Insights and Forecast - by Class
- 8.2.1. Class 1
- 8.2.2. Class 2
- 8.2.3. Class 3
- 8.3. Market Analysis, Insights and Forecast - by Products
- 8.3.1. Sensors
- 8.3.2. Detectors
- 8.3.3. Switches
- 8.3.4. Transmitters
- 8.3.5. Isolators
- 8.3.6. LED Indicators
- 8.3.7. Others Products
- 8.4. Market Analysis, Insights and Forecast - by End User
- 8.4.1. Oil and Gas
- 8.4.2. Mining
- 8.4.3. Power
- 8.4.4. Chemical and Petrochemical
- 8.4.5. Processing
- 8.4.6. Other End Users
- 8.1. Market Analysis, Insights and Forecast - by Zone
- 9. Latin America Intrinsically Safe Equipment Market Analysis, Insights and Forecast, 2020-2032
- 9.1. Market Analysis, Insights and Forecast - by Zone
- 9.1.1. Zone 0
- 9.1.2. Zone 20
- 9.1.3. Zone 1
- 9.1.4. Zone 21
- 9.1.5. Zone 22
- 9.2. Market Analysis, Insights and Forecast - by Class
- 9.2.1. Class 1
- 9.2.2. Class 2
- 9.2.3. Class 3
- 9.3. Market Analysis, Insights and Forecast - by Products
- 9.3.1. Sensors
- 9.3.2. Detectors
- 9.3.3. Switches
- 9.3.4. Transmitters
- 9.3.5. Isolators
- 9.3.6. LED Indicators
- 9.3.7. Others Products
- 9.4. Market Analysis, Insights and Forecast - by End User
- 9.4.1. Oil and Gas
- 9.4.2. Mining
- 9.4.3. Power
- 9.4.4. Chemical and Petrochemical
- 9.4.5. Processing
- 9.4.6. Other End Users
- 9.1. Market Analysis, Insights and Forecast - by Zone
- 10. Middle East Intrinsically Safe Equipment Market Analysis, Insights and Forecast, 2020-2032
- 10.1. Market Analysis, Insights and Forecast - by Zone
- 10.1.1. Zone 0
- 10.1.2. Zone 20
- 10.1.3. Zone 1
- 10.1.4. Zone 21
- 10.1.5. Zone 22
- 10.2. Market Analysis, Insights and Forecast - by Class
- 10.2.1. Class 1
- 10.2.2. Class 2
- 10.2.3. Class 3
- 10.3. Market Analysis, Insights and Forecast - by Products
- 10.3.1. Sensors
- 10.3.2. Detectors
- 10.3.3. Switches
- 10.3.4. Transmitters
- 10.3.5. Isolators
- 10.3.6. LED Indicators
- 10.3.7. Others Products
- 10.4. Market Analysis, Insights and Forecast - by End User
- 10.4.1. Oil and Gas
- 10.4.2. Mining
- 10.4.3. Power
- 10.4.4. Chemical and Petrochemical
- 10.4.5. Processing
- 10.4.6. Other End Users
- 10.1. Market Analysis, Insights and Forecast - by Zone
- 11. Saudi Arabia Intrinsically Safe Equipment Market Analysis, Insights and Forecast, 2020-2032
- 11.1. Market Analysis, Insights and Forecast - by Zone
- 11.1.1. Zone 0
- 11.1.2. Zone 20
- 11.1.3. Zone 1
- 11.1.4. Zone 21
- 11.1.5. Zone 22
- 11.2. Market Analysis, Insights and Forecast - by Class
- 11.2.1. Class 1
- 11.2.2. Class 2
- 11.2.3. Class 3
- 11.3. Market Analysis, Insights and Forecast - by Products
- 11.3.1. Sensors
- 11.3.2. Detectors
- 11.3.3. Switches
- 11.3.4. Transmitters
- 11.3.5. Isolators
- 11.3.6. LED Indicators
- 11.3.7. Others Products
- 11.4. Market Analysis, Insights and Forecast - by End User
- 11.4.1. Oil and Gas
- 11.4.2. Mining
- 11.4.3. Power
- 11.4.4. Chemical and Petrochemical
- 11.4.5. Processing
- 11.4.6. Other End Users
- 11.1. Market Analysis, Insights and Forecast - by Zone
- 12. Competitive Analysis
- 12.1. Global Market Share Analysis 2025
- 12.2. Company Profiles
- 12.2.1 R Stahl AG
- 12.2.1.1. Overview
- 12.2.1.2. Products
- 12.2.1.3. SWOT Analysis
- 12.2.1.4. Recent Developments
- 12.2.1.5. Financials (Based on Availability)
- 12.2.2 Honeywell International Inc
- 12.2.2.1. Overview
- 12.2.2.2. Products
- 12.2.2.3. SWOT Analysis
- 12.2.2.4. Recent Developments
- 12.2.2.5. Financials (Based on Availability)
- 12.2.3 Georgi
- 12.2.3.1. Overview
- 12.2.3.2. Products
- 12.2.3.3. SWOT Analysis
- 12.2.3.4. Recent Developments
- 12.2.3.5. Financials (Based on Availability)
- 12.2.4 CorDEX Instruments Ltd
- 12.2.4.1. Overview
- 12.2.4.2. Products
- 12.2.4.3. SWOT Analysis
- 12.2.4.4. Recent Developments
- 12.2.4.5. Financials (Based on Availability)
- 12.2.5 Kyland Technology Co Ltd
- 12.2.5.1. Overview
- 12.2.5.2. Products
- 12.2.5.3. SWOT Analysis
- 12.2.5.4. Recent Developments
- 12.2.5.5. Financials (Based on Availability)
- 12.2.6 Eaton Corporation PLC
- 12.2.6.1. Overview
- 12.2.6.2. Products
- 12.2.6.3. SWOT Analysis
- 12.2.6.4. Recent Developments
- 12.2.6.5. Financials (Based on Availability)
- 12.2.7 Fluke Corporation (Fortive Corporation)
- 12.2.7.1. Overview
- 12.2.7.2. Products
- 12.2.7.3. SWOT Analysis
- 12.2.7.4. Recent Developments
- 12.2.7.5. Financials (Based on Availability)
- 12.2.8 Bayco Products Inc
- 12.2.8.1. Overview
- 12.2.8.2. Products
- 12.2.8.3. SWOT Analysis
- 12.2.8.4. Recent Developments
- 12.2.8.5. Financials (Based on Availability)
- 12.2.9 Banner Engineering Corp
- 12.2.9.1. Overview
- 12.2.9.2. Products
- 12.2.9.3. SWOT Analysis
- 12.2.9.4. Recent Developments
- 12.2.9.5. Financials (Based on Availability)
- 12.2.10 Pepperl + Fuchs
- 12.2.10.1. Overview
- 12.2.10.2. Products
- 12.2.10.3. SWOT Analysis
- 12.2.10.4. Recent Developments
- 12.2.10.5. Financials (Based on Availability)
- 12.2.11 OMEGA Engineering (Spectris PLC)
- 12.2.11.1. Overview
- 12.2.11.2. Products
- 12.2.11.3. SWOT Analysis
- 12.2.11.4. Recent Developments
- 12.2.11.5. Financials (Based on Availability)
- 12.2.1 R Stahl AG
List of Figures
- Figure 1: Global Intrinsically Safe Equipment Market Revenue Breakdown (Million, %) by Region 2025 & 2033
- Figure 2: North America Intrinsically Safe Equipment Market Revenue (Million), by Zone 2025 & 2033
- Figure 3: North America Intrinsically Safe Equipment Market Revenue Share (%), by Zone 2025 & 2033
- Figure 4: North America Intrinsically Safe Equipment Market Revenue (Million), by Class 2025 & 2033
- Figure 5: North America Intrinsically Safe Equipment Market Revenue Share (%), by Class 2025 & 2033
- Figure 6: North America Intrinsically Safe Equipment Market Revenue (Million), by Products 2025 & 2033
- Figure 7: North America Intrinsically Safe Equipment Market Revenue Share (%), by Products 2025 & 2033
- Figure 8: North America Intrinsically Safe Equipment Market Revenue (Million), by End User 2025 & 2033
- Figure 9: North America Intrinsically Safe Equipment Market Revenue Share (%), by End User 2025 & 2033
- Figure 10: North America Intrinsically Safe Equipment Market Revenue (Million), by Country 2025 & 2033
- Figure 11: North America Intrinsically Safe Equipment Market Revenue Share (%), by Country 2025 & 2033
- Figure 12: Europe Intrinsically Safe Equipment Market Revenue (Million), by Zone 2025 & 2033
- Figure 13: Europe Intrinsically Safe Equipment Market Revenue Share (%), by Zone 2025 & 2033
- Figure 14: Europe Intrinsically Safe Equipment Market Revenue (Million), by Class 2025 & 2033
- Figure 15: Europe Intrinsically Safe Equipment Market Revenue Share (%), by Class 2025 & 2033
- Figure 16: Europe Intrinsically Safe Equipment Market Revenue (Million), by Products 2025 & 2033
- Figure 17: Europe Intrinsically Safe Equipment Market Revenue Share (%), by Products 2025 & 2033
- Figure 18: Europe Intrinsically Safe Equipment Market Revenue (Million), by End User 2025 & 2033
- Figure 19: Europe Intrinsically Safe Equipment Market Revenue Share (%), by End User 2025 & 2033
- Figure 20: Europe Intrinsically Safe Equipment Market Revenue (Million), by Country 2025 & 2033
- Figure 21: Europe Intrinsically Safe Equipment Market Revenue Share (%), by Country 2025 & 2033
- Figure 22: Asia Pacific Intrinsically Safe Equipment Market Revenue (Million), by Zone 2025 & 2033
- Figure 23: Asia Pacific Intrinsically Safe Equipment Market Revenue Share (%), by Zone 2025 & 2033
- Figure 24: Asia Pacific Intrinsically Safe Equipment Market Revenue (Million), by Class 2025 & 2033
- Figure 25: Asia Pacific Intrinsically Safe Equipment Market Revenue Share (%), by Class 2025 & 2033
- Figure 26: Asia Pacific Intrinsically Safe Equipment Market Revenue (Million), by Products 2025 & 2033
- Figure 27: Asia Pacific Intrinsically Safe Equipment Market Revenue Share (%), by Products 2025 & 2033
- Figure 28: Asia Pacific Intrinsically Safe Equipment Market Revenue (Million), by End User 2025 & 2033
- Figure 29: Asia Pacific Intrinsically Safe Equipment Market Revenue Share (%), by End User 2025 & 2033
- Figure 30: Asia Pacific Intrinsically Safe Equipment Market Revenue (Million), by Country 2025 & 2033
- Figure 31: Asia Pacific Intrinsically Safe Equipment Market Revenue Share (%), by Country 2025 & 2033
- Figure 32: Latin America Intrinsically Safe Equipment Market Revenue (Million), by Zone 2025 & 2033
- Figure 33: Latin America Intrinsically Safe Equipment Market Revenue Share (%), by Zone 2025 & 2033
- Figure 34: Latin America Intrinsically Safe Equipment Market Revenue (Million), by Class 2025 & 2033
- Figure 35: Latin America Intrinsically Safe Equipment Market Revenue Share (%), by Class 2025 & 2033
- Figure 36: Latin America Intrinsically Safe Equipment Market Revenue (Million), by Products 2025 & 2033
- Figure 37: Latin America Intrinsically Safe Equipment Market Revenue Share (%), by Products 2025 & 2033
- Figure 38: Latin America Intrinsically Safe Equipment Market Revenue (Million), by End User 2025 & 2033
- Figure 39: Latin America Intrinsically Safe Equipment Market Revenue Share (%), by End User 2025 & 2033
- Figure 40: Latin America Intrinsically Safe Equipment Market Revenue (Million), by Country 2025 & 2033
- Figure 41: Latin America Intrinsically Safe Equipment Market Revenue Share (%), by Country 2025 & 2033
- Figure 42: Middle East Intrinsically Safe Equipment Market Revenue (Million), by Zone 2025 & 2033
- Figure 43: Middle East Intrinsically Safe Equipment Market Revenue Share (%), by Zone 2025 & 2033
- Figure 44: Middle East Intrinsically Safe Equipment Market Revenue (Million), by Class 2025 & 2033
- Figure 45: Middle East Intrinsically Safe Equipment Market Revenue Share (%), by Class 2025 & 2033
- Figure 46: Middle East Intrinsically Safe Equipment Market Revenue (Million), by Products 2025 & 2033
- Figure 47: Middle East Intrinsically Safe Equipment Market Revenue Share (%), by Products 2025 & 2033
- Figure 48: Middle East Intrinsically Safe Equipment Market Revenue (Million), by End User 2025 & 2033
- Figure 49: Middle East Intrinsically Safe Equipment Market Revenue Share (%), by End User 2025 & 2033
- Figure 50: Middle East Intrinsically Safe Equipment Market Revenue (Million), by Country 2025 & 2033
- Figure 51: Middle East Intrinsically Safe Equipment Market Revenue Share (%), by Country 2025 & 2033
- Figure 52: Saudi Arabia Intrinsically Safe Equipment Market Revenue (Million), by Zone 2025 & 2033
- Figure 53: Saudi Arabia Intrinsically Safe Equipment Market Revenue Share (%), by Zone 2025 & 2033
- Figure 54: Saudi Arabia Intrinsically Safe Equipment Market Revenue (Million), by Class 2025 & 2033
- Figure 55: Saudi Arabia Intrinsically Safe Equipment Market Revenue Share (%), by Class 2025 & 2033
- Figure 56: Saudi Arabia Intrinsically Safe Equipment Market Revenue (Million), by Products 2025 & 2033
- Figure 57: Saudi Arabia Intrinsically Safe Equipment Market Revenue Share (%), by Products 2025 & 2033
- Figure 58: Saudi Arabia Intrinsically Safe Equipment Market Revenue (Million), by End User 2025 & 2033
- Figure 59: Saudi Arabia Intrinsically Safe Equipment Market Revenue Share (%), by End User 2025 & 2033
- Figure 60: Saudi Arabia Intrinsically Safe Equipment Market Revenue (Million), by Country 2025 & 2033
- Figure 61: Saudi Arabia Intrinsically Safe Equipment Market Revenue Share (%), by Country 2025 & 2033
List of Tables
- Table 1: Global Intrinsically Safe Equipment Market Revenue Million Forecast, by Zone 2020 & 2033
- Table 2: Global Intrinsically Safe Equipment Market Revenue Million Forecast, by Class 2020 & 2033
- Table 3: Global Intrinsically Safe Equipment Market Revenue Million Forecast, by Products 2020 & 2033
- Table 4: Global Intrinsically Safe Equipment Market Revenue Million Forecast, by End User 2020 & 2033
- Table 5: Global Intrinsically Safe Equipment Market Revenue Million Forecast, by Region 2020 & 2033
- Table 6: Global Intrinsically Safe Equipment Market Revenue Million Forecast, by Zone 2020 & 2033
- Table 7: Global Intrinsically Safe Equipment Market Revenue Million Forecast, by Class 2020 & 2033
- Table 8: Global Intrinsically Safe Equipment Market Revenue Million Forecast, by Products 2020 & 2033
- Table 9: Global Intrinsically Safe Equipment Market Revenue Million Forecast, by End User 2020 & 2033
- Table 10: Global Intrinsically Safe Equipment Market Revenue Million Forecast, by Country 2020 & 2033
- Table 11: United States Intrinsically Safe Equipment Market Revenue (Million) Forecast, by Application 2020 & 2033
- Table 12: Canada Intrinsically Safe Equipment Market Revenue (Million) Forecast, by Application 2020 & 2033
- Table 13: Global Intrinsically Safe Equipment Market Revenue Million Forecast, by Zone 2020 & 2033
- Table 14: Global Intrinsically Safe Equipment Market Revenue Million Forecast, by Class 2020 & 2033
- Table 15: Global Intrinsically Safe Equipment Market Revenue Million Forecast, by Products 2020 & 2033
- Table 16: Global Intrinsically Safe Equipment Market Revenue Million Forecast, by End User 2020 & 2033
- Table 17: Global Intrinsically Safe Equipment Market Revenue Million Forecast, by Country 2020 & 2033
- Table 18: Germany Intrinsically Safe Equipment Market Revenue (Million) Forecast, by Application 2020 & 2033
- Table 19: United Kingdom Intrinsically Safe Equipment Market Revenue (Million) Forecast, by Application 2020 & 2033
- Table 20: France Intrinsically Safe Equipment Market Revenue (Million) Forecast, by Application 2020 & 2033
- Table 21: Rest of Europe Intrinsically Safe Equipment Market Revenue (Million) Forecast, by Application 2020 & 2033
- Table 22: Global Intrinsically Safe Equipment Market Revenue Million Forecast, by Zone 2020 & 2033
- Table 23: Global Intrinsically Safe Equipment Market Revenue Million Forecast, by Class 2020 & 2033
- Table 24: Global Intrinsically Safe Equipment Market Revenue Million Forecast, by Products 2020 & 2033
- Table 25: Global Intrinsically Safe Equipment Market Revenue Million Forecast, by End User 2020 & 2033
- Table 26: Global Intrinsically Safe Equipment Market Revenue Million Forecast, by Country 2020 & 2033
- Table 27: China Intrinsically Safe Equipment Market Revenue (Million) Forecast, by Application 2020 & 2033
- Table 28: Japan Intrinsically Safe Equipment Market Revenue (Million) Forecast, by Application 2020 & 2033
- Table 29: India Intrinsically Safe Equipment Market Revenue (Million) Forecast, by Application 2020 & 2033
- Table 30: Rest of Asia Pacific Intrinsically Safe Equipment Market Revenue (Million) Forecast, by Application 2020 & 2033
- Table 31: Global Intrinsically Safe Equipment Market Revenue Million Forecast, by Zone 2020 & 2033
- Table 32: Global Intrinsically Safe Equipment Market Revenue Million Forecast, by Class 2020 & 2033
- Table 33: Global Intrinsically Safe Equipment Market Revenue Million Forecast, by Products 2020 & 2033
- Table 34: Global Intrinsically Safe Equipment Market Revenue Million Forecast, by End User 2020 & 2033
- Table 35: Global Intrinsically Safe Equipment Market Revenue Million Forecast, by Country 2020 & 2033
- Table 36: Brazil Intrinsically Safe Equipment Market Revenue (Million) Forecast, by Application 2020 & 2033
- Table 37: Mexico Intrinsically Safe Equipment Market Revenue (Million) Forecast, by Application 2020 & 2033
- Table 38: Argentina Intrinsically Safe Equipment Market Revenue (Million) Forecast, by Application 2020 & 2033
- Table 39: Rest of Latin America Intrinsically Safe Equipment Market Revenue (Million) Forecast, by Application 2020 & 2033
- Table 40: Global Intrinsically Safe Equipment Market Revenue Million Forecast, by Zone 2020 & 2033
- Table 41: Global Intrinsically Safe Equipment Market Revenue Million Forecast, by Class 2020 & 2033
- Table 42: Global Intrinsically Safe Equipment Market Revenue Million Forecast, by Products 2020 & 2033
- Table 43: Global Intrinsically Safe Equipment Market Revenue Million Forecast, by End User 2020 & 2033
- Table 44: Global Intrinsically Safe Equipment Market Revenue Million Forecast, by Country 2020 & 2033
- Table 45: Global Intrinsically Safe Equipment Market Revenue Million Forecast, by Zone 2020 & 2033
- Table 46: Global Intrinsically Safe Equipment Market Revenue Million Forecast, by Class 2020 & 2033
- Table 47: Global Intrinsically Safe Equipment Market Revenue Million Forecast, by Products 2020 & 2033
- Table 48: Global Intrinsically Safe Equipment Market Revenue Million Forecast, by End User 2020 & 2033
- Table 49: Global Intrinsically Safe Equipment Market Revenue Million Forecast, by Country 2020 & 2033
- Table 50: United Arab Emirates Intrinsically Safe Equipment Market Revenue (Million) Forecast, by Application 2020 & 2033
- Table 51: Rest of Middle East Intrinsically Safe Equipment Market Revenue (Million) Forecast, by Application 2020 & 2033
Frequently Asked Questions
1. What is the projected Compound Annual Growth Rate (CAGR) of the Intrinsically Safe Equipment Market?
The projected CAGR is approximately 7.45%.
2. Which companies are prominent players in the Intrinsically Safe Equipment Market?
Key companies in the market include R Stahl AG, Honeywell International Inc, Georgi, CorDEX Instruments Ltd, Kyland Technology Co Ltd, Eaton Corporation PLC, Fluke Corporation (Fortive Corporation), Bayco Products Inc, Banner Engineering Corp, Pepperl + Fuchs, OMEGA Engineering (Spectris PLC).
3. What are the main segments of the Intrinsically Safe Equipment Market?
The market segments include Zone, Class, Products, End User.
4. Can you provide details about the market size?
The market size is estimated to be USD 3.61 Million as of 2022.
5. What are some drivers contributing to market growth?
Increasing Number of Government Regulations; Growing Energy Requirements. Driving the Demand for Exploration of New Mines and Oil and Gas Resources.
6. What are the notable trends driving market growth?
Oil and Gas End User Segment is Expected to Hold a Significant Market Share.
7. Are there any restraints impacting market growth?
; High Cost of Energy-efficient Pumps; Fluctuations in the Price of Raw Materials.
8. Can you provide examples of recent developments in the market?
November 2023 - Amazon Inc. launched an AWS Monitron solution that uses machine learning (ML) to identify anomalies in industrial equipment for predictive maintenance. It includes wireless sensors for vibration and temperature monitoring; gateways for automatic data transfer to AWS Cloud, a service that analyses the data for anomalies using ML; and an accompanying mobile app to configure the devices and get operating behavior reports and machine failure alerts.
9. What pricing options are available for accessing the report?
Pricing options include single-user, multi-user, and enterprise licenses priced at USD 4750, USD 5250, and USD 8750 respectively.
10. Is the market size provided in terms of value or volume?
The market size is provided in terms of value, measured in Million.
11. Are there any specific market keywords associated with the report?
Yes, the market keyword associated with the report is "Intrinsically Safe Equipment Market," which aids in identifying and referencing the specific market segment covered.
12. How do I determine which pricing option suits my needs best?
The pricing options vary based on user requirements and access needs. Individual users may opt for single-user licenses, while businesses requiring broader access may choose multi-user or enterprise licenses for cost-effective access to the report.
13. Are there any additional resources or data provided in the Intrinsically Safe Equipment Market report?
While the report offers comprehensive insights, it's advisable to review the specific contents or supplementary materials provided to ascertain if additional resources or data are available.
14. How can I stay updated on further developments or reports in the Intrinsically Safe Equipment Market?
To stay informed about further developments, trends, and reports in the Intrinsically Safe Equipment Market, consider subscribing to industry newsletters, following relevant companies and organizations, or regularly checking reputable industry news sources and publications.
Methodology
Step 1 - Identification of Relevant Samples Size from Population Database


Step 2 - Approaches for Defining Global Market Size (Value, Volume* & Price*)

Note*: In applicable scenarios
Step 3 - Data Sources
Primary Research
- Web Analytics
- Survey Reports
- Research Institute
- Latest Research Reports
- Opinion Leaders
Secondary Research
- Annual Reports
- White Paper
- Latest Press Release
- Industry Association
- Paid Database
- Investor Presentations

Step 4 - Data Triangulation
Involves using different sources of information in order to increase the validity of a study
These sources are likely to be stakeholders in a program - participants, other researchers, program staff, other community members, and so on.
Then we put all data in single framework & apply various statistical tools to find out the dynamic on the market.
During the analysis stage, feedback from the stakeholder groups would be compared to determine areas of agreement as well as areas of divergence