

Key Insights
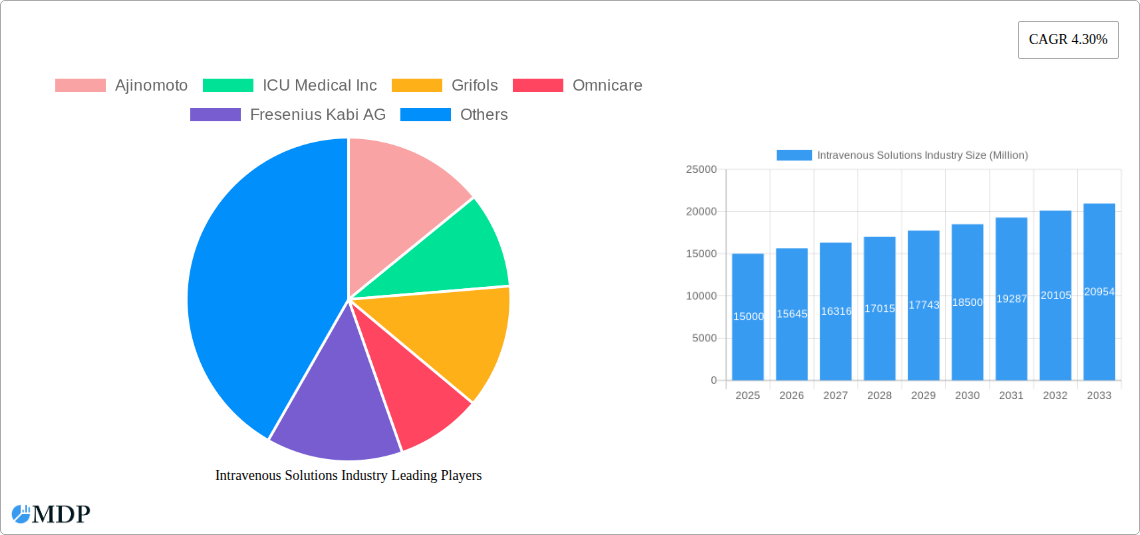
The intravenous (IV) solutions market, encompassing Total Parenteral Nutrition (TPN), Peripheral Parenteral Nutrition (PPN), and various solution compositions (saline, carbohydrates, vitamins, minerals, and others), is experiencing steady growth. The market's 4.30% CAGR from 2019-2024 suggests a robust and expanding demand, driven primarily by increasing prevalence of chronic diseases requiring intravenous therapies, rising geriatric population necessitating enhanced medical care, and advancements in IV solution technology leading to improved efficacy and patient outcomes. The expanding healthcare infrastructure in developing economies, particularly in Asia-Pacific, further fuels market expansion. However, potential restraints include stringent regulatory approvals for new products, the risk of adverse reactions associated with IV solutions, and the increasing cost of healthcare, which may limit market access in certain regions. The market is segmented by solution type (TPN and PPN) and composition, reflecting the diverse needs of patients and the evolving nature of IV therapies. Major players, including Ajinomoto, ICU Medical Inc., Grifols, Omnicare, Fresenius Kabi AG, Anhui Medipharm, Wuhan Uni-Pharma Bio-Tech, B. Braun Melsungen AG, Vifor Pharma, and Baxter International, are actively engaged in research and development, strategic partnerships, and market expansion to maintain their competitive edge.
The competitive landscape is characterized by both large multinational corporations and smaller regional players. The market's future growth will depend on factors such as the development of innovative IV solutions, expansion into emerging markets, and collaborative efforts to address challenges related to cost and accessibility. The increasing focus on home healthcare and ambulatory care settings is also anticipated to create new opportunities for growth. Future projections suggest continued market expansion, with a particular emphasis on solutions addressing specific therapeutic needs and improving patient safety and convenience. The substantial market size, coupled with the ongoing technological advancements and increasing healthcare spending globally, indicates a promising outlook for the IV solutions industry in the coming years. Analyzing regional data will be crucial for targeted market strategies.
Intravenous Solutions Industry: A Comprehensive Market Report (2019-2033)
This comprehensive report provides an in-depth analysis of the Intravenous Solutions industry, offering invaluable insights for stakeholders seeking to navigate this dynamic market. From market dynamics and leading players to emerging opportunities and future growth projections, this report covers all essential aspects. With a study period spanning 2019-2033, a base year of 2025, and a forecast period of 2025-2033, this analysis offers a clear understanding of historical trends and future potential. The market size is estimated to be xx Million in 2025 and is projected to reach xx Million by 2033.
Intravenous Solutions Industry Market Dynamics & Concentration
The intravenous solutions market is characterized by a moderately concentrated landscape, with key players holding significant market share. Ajinomoto, ICU Medical Inc, Grifols, Omnicare, Fresenius Kabi AG, Anhui Medipharm Co Ltd, Wuhan Uni-Pharma Bio-Tech Co Ltd, B Braun Melsungen AG, Vifor Pharma, and Baxter International are among the leading companies shaping the industry. Market share dynamics are influenced by factors such as technological advancements, regulatory changes, and strategic mergers and acquisitions (M&A). The historical period (2019-2024) witnessed xx M&A deals, contributing to market consolidation. Innovation drives competition, particularly in areas like advanced formulations and delivery systems. Stringent regulatory frameworks, including FDA approvals in key markets, significantly impact product development and market entry. Substitute products, such as oral medications, pose a competitive challenge, while growing demand from aging populations and increasing prevalence of chronic diseases fuel market growth. End-user trends, such as preference for home healthcare and personalized medicine, further influence market dynamics.
- Market Concentration: Moderately concentrated, with top 10 players holding approximately xx% market share.
- Innovation Drivers: Advanced formulations, smart delivery systems, and personalized solutions.
- Regulatory Frameworks: Stringent regulations in developed markets, impacting approvals and market entry.
- Product Substitutes: Oral medications and other alternative therapies.
- End-User Trends: Growing demand from aging populations and shift towards home healthcare.
- M&A Activities: xx M&A deals during 2019-2024, leading to market consolidation.
Intravenous Solutions Industry Industry Trends & Analysis
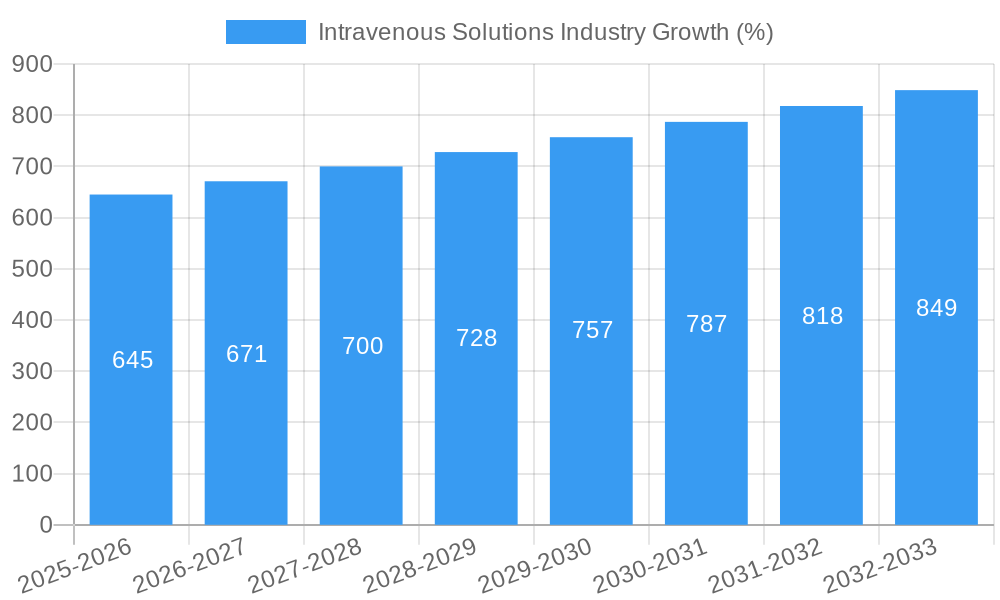
The intravenous solutions market exhibits robust growth, driven by several key factors. The CAGR from 2025 to 2033 is estimated to be xx%. Technological advancements, such as the development of biocompatible materials and improved delivery systems, are improving treatment efficacy and patient outcomes. This, coupled with growing awareness of the benefits of intravenous therapy, is driving market expansion. The market penetration rate is currently at xx%, indicating significant untapped potential. Consumer preferences are shifting toward convenience and personalized solutions, driving the demand for innovative products and services. Competitive dynamics are shaped by factors such as pricing strategies, product differentiation, and technological innovation. The industry also faces challenges such as stringent regulations and pricing pressures.
Leading Markets & Segments in Intravenous Solutions Industry
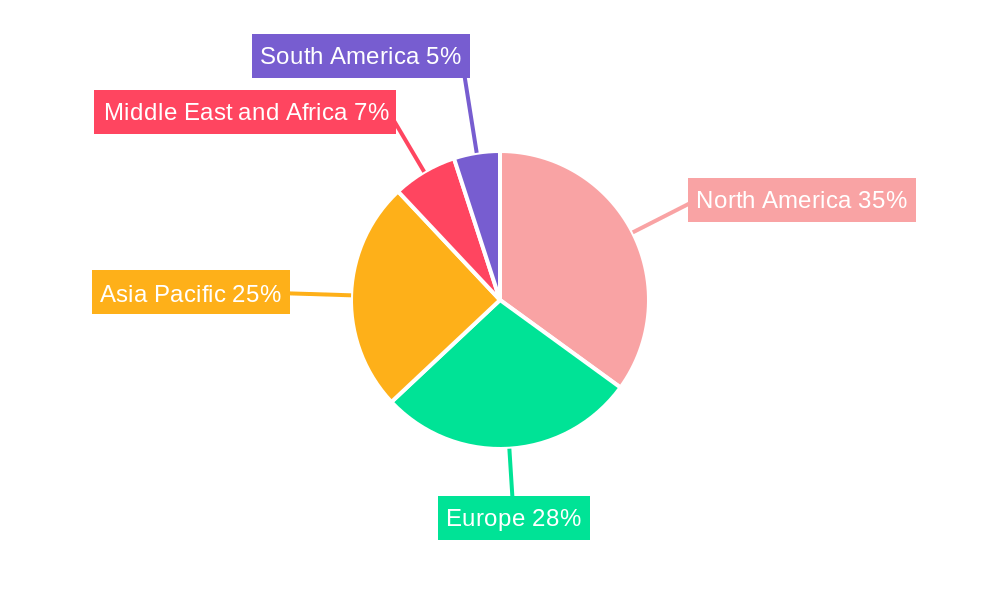
The North American region currently holds the dominant position in the intravenous solutions market, driven by factors such as strong healthcare infrastructure, high healthcare expenditure, and rising prevalence of chronic diseases. Within the product segments, Saline solutions command the largest market share, followed by Carbohydrates, Vitamins and Minerals, and other solution compositions. Total Parenteral Nutrition (TPN) and Peripheral Parenteral Nutrition (PPN) are the major types of intravenous solutions, with TPN solutions showing higher growth potential owing to its use in critical care and specialized treatments.
- Key Drivers for North American Dominance:
- Advanced healthcare infrastructure
- High healthcare expenditure per capita
- High prevalence of chronic diseases
- Stringent regulatory environment that drives innovation
- Dominant Segments:
- Type: Total Parenteral Nutrition (TPN) holds the leading share.
- Solution Composition: Saline solutions are the largest segment due to their wide range of applications.
Intravenous Solutions Industry Product Developments
Recent product innovations focus on enhanced patient safety, convenience, and efficacy. B. Braun Medical's launch of CARESAFE IV Administration Sets with an optional AirStop component in September 2021 is a prime example of focusing on improved safety measures. The industry is witnessing a trend towards premixed solutions and ready-to-use systems for improved efficiency and reduced risk of contamination. These advancements align with the growing demand for streamlined procedures and improved patient outcomes in both hospital and home healthcare settings. Technological advancements are focused on improving the biocompatibility of solutions, minimizing adverse effects, and enhancing drug delivery.
Key Drivers of Intravenous Solutions Industry Growth
The intravenous solutions market is fueled by several growth drivers. Technological advancements like the development of biocompatible materials and smart delivery systems enhance treatment efficacy and patient safety. The growing prevalence of chronic diseases, such as cancer and diabetes, fuels the demand for intravenous therapies. Favorable regulatory environments in key markets accelerate product approvals and market entry. Increasing healthcare spending and government initiatives supporting healthcare infrastructure further contribute to market growth.
Challenges in the Intravenous Solutions Industry Market
The industry faces challenges, including stringent regulatory requirements that can delay product approvals and increase costs. Supply chain disruptions and fluctuations in raw material prices can impact production and profitability. Intense competition among established players and the emergence of new entrants create pricing pressures. These challenges impact market growth and profitability. The rising cost of healthcare coupled with reimbursement policies also affect market growth.
Emerging Opportunities in Intravenous Solutions Industry
Long-term growth is driven by opportunities stemming from technological breakthroughs such as personalized medicine and targeted drug delivery systems. Strategic partnerships between pharmaceutical companies and technology providers are facilitating innovation. Expanding into emerging markets with rising healthcare expenditure provides significant growth potential. The development of novel formulations for specialized therapies creates exciting opportunities.
Leading Players in the Intravenous Solutions Industry Sector
- Ajinomoto
- ICU Medical Inc
- Grifols
- Omnicare
- Fresenius Kabi AG
- Anhui Medipharm Co Ltd
- Wuhan Uni-Pharma Bio-Tech Co Ltd
- B Braun Melsungen AG
- Vifor Pharma
- Baxter International
Key Milestones in Intravenous Solutions Industry Industry
- September 2021: B. Braun Medical Inc. launched CARESAFE IV Administration Sets with an Optional AirStop component, enhancing patient safety.
- February 2022: B. Braun Medical received US FDA approval for its new IV saline solution manufacturing facility in Daytona Beach, Florida, expanding production capacity.
Strategic Outlook for Intravenous Solutions Industry Market
The intravenous solutions market holds significant future potential, driven by continued technological innovation, expansion into emerging markets, and the growing prevalence of chronic diseases. Strategic partnerships, focused research and development efforts, and the development of personalized and targeted therapies will shape future market dynamics. Companies that invest in advanced technologies and adapt to evolving healthcare trends are well-positioned for success in this competitive yet promising market.
Intravenous Solutions Industry Segmentation
-
1. Type
- 1.1. Total Parenteral Nutrition
- 1.2. Peripheral Parenteral Nutrition
-
2. Solution Composition
- 2.1. Saline
- 2.2. Carbohydrates
- 2.3. Vitamins and Minerals
- 2.4. Other Solution Compositions
Intravenous Solutions Industry Segmentation By Geography
-
1. North America
- 1.1. United States
- 1.2. Canada
- 1.3. Mexico
-
2. Europe
- 2.1. Germany
- 2.2. United Kingdom
- 2.3. France
- 2.4. Italy
- 2.5. Spain
- 2.6. Rest of Europe
-
3. Asia Pacific
- 3.1. China
- 3.2. Japan
- 3.3. India
- 3.4. Australia
- 3.5. South Korea
- 3.6. Rest of Asia Pacific
-
4. Middle East and Africa
- 4.1. GCC
- 4.2. South Africa
- 4.3. Rest of Middle East and Africa
-
5. South America
- 5.1. Brazil
- 5.2. Argentina
- 5.3. Rest of South America
Intravenous Solutions Industry REPORT HIGHLIGHTS
| Aspects | Details |
|---|---|
| Study Period | 2019-2033 |
| Base Year | 2024 |
| Estimated Year | 2025 |
| Forecast Period | 2025-2033 |
| Historical Period | 2019-2024 |
| Growth Rate | CAGR of 4.30% from 2019-2033 |
| Segmentation |
|
Table of Contents
- 1. Introduction
- 1.1. Research Scope
- 1.2. Market Segmentation
- 1.3. Research Methodology
- 1.4. Definitions and Assumptions
- 2. Executive Summary
- 2.1. Introduction
- 3. Market Dynamics
- 3.1. Introduction
- 3.2. Market Drivers
- 3.2.1 Increasing Prevalence of Diseases
- 3.2.2 such as Gastrointestinal Disorder
- 3.2.3 Neurological Diseases
- 3.2.4 and Cancer; Advancements and New Innovations in the Products for Patient Convenience
- 3.3. Market Restrains
- 3.3.1. Regulatory and Quality Requirements
- 3.4. Market Trends
- 3.4.1. Total Parenteral Nutrition Segment is Dominating the Intravenous Solutions Market
- 4. Market Factor Analysis
- 4.1. Porters Five Forces
- 4.2. Supply/Value Chain
- 4.3. PESTEL analysis
- 4.4. Market Entropy
- 4.5. Patent/Trademark Analysis
- 5. Global Intravenous Solutions Industry Analysis, Insights and Forecast, 2019-2031
- 5.1. Market Analysis, Insights and Forecast - by Type
- 5.1.1. Total Parenteral Nutrition
- 5.1.2. Peripheral Parenteral Nutrition
- 5.2. Market Analysis, Insights and Forecast - by Solution Composition
- 5.2.1. Saline
- 5.2.2. Carbohydrates
- 5.2.3. Vitamins and Minerals
- 5.2.4. Other Solution Compositions
- 5.3. Market Analysis, Insights and Forecast - by Region
- 5.3.1. North America
- 5.3.2. Europe
- 5.3.3. Asia Pacific
- 5.3.4. Middle East and Africa
- 5.3.5. South America
- 5.1. Market Analysis, Insights and Forecast - by Type
- 6. North America Intravenous Solutions Industry Analysis, Insights and Forecast, 2019-2031
- 6.1. Market Analysis, Insights and Forecast - by Type
- 6.1.1. Total Parenteral Nutrition
- 6.1.2. Peripheral Parenteral Nutrition
- 6.2. Market Analysis, Insights and Forecast - by Solution Composition
- 6.2.1. Saline
- 6.2.2. Carbohydrates
- 6.2.3. Vitamins and Minerals
- 6.2.4. Other Solution Compositions
- 6.1. Market Analysis, Insights and Forecast - by Type
- 7. Europe Intravenous Solutions Industry Analysis, Insights and Forecast, 2019-2031
- 7.1. Market Analysis, Insights and Forecast - by Type
- 7.1.1. Total Parenteral Nutrition
- 7.1.2. Peripheral Parenteral Nutrition
- 7.2. Market Analysis, Insights and Forecast - by Solution Composition
- 7.2.1. Saline
- 7.2.2. Carbohydrates
- 7.2.3. Vitamins and Minerals
- 7.2.4. Other Solution Compositions
- 7.1. Market Analysis, Insights and Forecast - by Type
- 8. Asia Pacific Intravenous Solutions Industry Analysis, Insights and Forecast, 2019-2031
- 8.1. Market Analysis, Insights and Forecast - by Type
- 8.1.1. Total Parenteral Nutrition
- 8.1.2. Peripheral Parenteral Nutrition
- 8.2. Market Analysis, Insights and Forecast - by Solution Composition
- 8.2.1. Saline
- 8.2.2. Carbohydrates
- 8.2.3. Vitamins and Minerals
- 8.2.4. Other Solution Compositions
- 8.1. Market Analysis, Insights and Forecast - by Type
- 9. Middle East and Africa Intravenous Solutions Industry Analysis, Insights and Forecast, 2019-2031
- 9.1. Market Analysis, Insights and Forecast - by Type
- 9.1.1. Total Parenteral Nutrition
- 9.1.2. Peripheral Parenteral Nutrition
- 9.2. Market Analysis, Insights and Forecast - by Solution Composition
- 9.2.1. Saline
- 9.2.2. Carbohydrates
- 9.2.3. Vitamins and Minerals
- 9.2.4. Other Solution Compositions
- 9.1. Market Analysis, Insights and Forecast - by Type
- 10. South America Intravenous Solutions Industry Analysis, Insights and Forecast, 2019-2031
- 10.1. Market Analysis, Insights and Forecast - by Type
- 10.1.1. Total Parenteral Nutrition
- 10.1.2. Peripheral Parenteral Nutrition
- 10.2. Market Analysis, Insights and Forecast - by Solution Composition
- 10.2.1. Saline
- 10.2.2. Carbohydrates
- 10.2.3. Vitamins and Minerals
- 10.2.4. Other Solution Compositions
- 10.1. Market Analysis, Insights and Forecast - by Type
- 11. North America Intravenous Solutions Industry Analysis, Insights and Forecast, 2019-2031
- 11.1. Market Analysis, Insights and Forecast - By Country/Sub-region
- 11.1.1. undefined
- 12. Europe Intravenous Solutions Industry Analysis, Insights and Forecast, 2019-2031
- 12.1. Market Analysis, Insights and Forecast - By Country/Sub-region
- 12.1.1. undefined
- 13. Asia Pacific Intravenous Solutions Industry Analysis, Insights and Forecast, 2019-2031
- 13.1. Market Analysis, Insights and Forecast - By Country/Sub-region
- 13.1.1. undefined
- 14. Middle East and Africa Intravenous Solutions Industry Analysis, Insights and Forecast, 2019-2031
- 14.1. Market Analysis, Insights and Forecast - By Country/Sub-region
- 14.1.1. undefined
- 15. South America Intravenous Solutions Industry Analysis, Insights and Forecast, 2019-2031
- 15.1. Market Analysis, Insights and Forecast - By Country/Sub-region
- 15.1.1. undefined
- 16. Competitive Analysis
- 16.1. Global Market Share Analysis 2024
- 16.2. Company Profiles
- 16.2.1 Ajinomoto
- 16.2.1.1. Overview
- 16.2.1.2. Products
- 16.2.1.3. SWOT Analysis
- 16.2.1.4. Recent Developments
- 16.2.1.5. Financials (Based on Availability)
- 16.2.2 ICU Medical Inc
- 16.2.2.1. Overview
- 16.2.2.2. Products
- 16.2.2.3. SWOT Analysis
- 16.2.2.4. Recent Developments
- 16.2.2.5. Financials (Based on Availability)
- 16.2.3 Grifols
- 16.2.3.1. Overview
- 16.2.3.2. Products
- 16.2.3.3. SWOT Analysis
- 16.2.3.4. Recent Developments
- 16.2.3.5. Financials (Based on Availability)
- 16.2.4 Omnicare
- 16.2.4.1. Overview
- 16.2.4.2. Products
- 16.2.4.3. SWOT Analysis
- 16.2.4.4. Recent Developments
- 16.2.4.5. Financials (Based on Availability)
- 16.2.5 Fresenius Kabi AG
- 16.2.5.1. Overview
- 16.2.5.2. Products
- 16.2.5.3. SWOT Analysis
- 16.2.5.4. Recent Developments
- 16.2.5.5. Financials (Based on Availability)
- 16.2.6 Anhui Medipharm Co Ltd
- 16.2.6.1. Overview
- 16.2.6.2. Products
- 16.2.6.3. SWOT Analysis
- 16.2.6.4. Recent Developments
- 16.2.6.5. Financials (Based on Availability)
- 16.2.7 Wuhan Uni-Pharma Bio-Tech Co Ltd
- 16.2.7.1. Overview
- 16.2.7.2. Products
- 16.2.7.3. SWOT Analysis
- 16.2.7.4. Recent Developments
- 16.2.7.5. Financials (Based on Availability)
- 16.2.8 B Braun Melsungen AG
- 16.2.8.1. Overview
- 16.2.8.2. Products
- 16.2.8.3. SWOT Analysis
- 16.2.8.4. Recent Developments
- 16.2.8.5. Financials (Based on Availability)
- 16.2.9 Vifor Pharma
- 16.2.9.1. Overview
- 16.2.9.2. Products
- 16.2.9.3. SWOT Analysis
- 16.2.9.4. Recent Developments
- 16.2.9.5. Financials (Based on Availability)
- 16.2.10 Baxter International
- 16.2.10.1. Overview
- 16.2.10.2. Products
- 16.2.10.3. SWOT Analysis
- 16.2.10.4. Recent Developments
- 16.2.10.5. Financials (Based on Availability)
- 16.2.1 Ajinomoto
List of Figures
- Figure 1: Global Intravenous Solutions Industry Revenue Breakdown (Million, %) by Region 2024 & 2032
- Figure 2: Global Intravenous Solutions Industry Volume Breakdown (K Unit, %) by Region 2024 & 2032
- Figure 3: North America Intravenous Solutions Industry Revenue (Million), by Country 2024 & 2032
- Figure 4: North America Intravenous Solutions Industry Volume (K Unit), by Country 2024 & 2032
- Figure 5: North America Intravenous Solutions Industry Revenue Share (%), by Country 2024 & 2032
- Figure 6: North America Intravenous Solutions Industry Volume Share (%), by Country 2024 & 2032
- Figure 7: Europe Intravenous Solutions Industry Revenue (Million), by Country 2024 & 2032
- Figure 8: Europe Intravenous Solutions Industry Volume (K Unit), by Country 2024 & 2032
- Figure 9: Europe Intravenous Solutions Industry Revenue Share (%), by Country 2024 & 2032
- Figure 10: Europe Intravenous Solutions Industry Volume Share (%), by Country 2024 & 2032
- Figure 11: Asia Pacific Intravenous Solutions Industry Revenue (Million), by Country 2024 & 2032
- Figure 12: Asia Pacific Intravenous Solutions Industry Volume (K Unit), by Country 2024 & 2032
- Figure 13: Asia Pacific Intravenous Solutions Industry Revenue Share (%), by Country 2024 & 2032
- Figure 14: Asia Pacific Intravenous Solutions Industry Volume Share (%), by Country 2024 & 2032
- Figure 15: Middle East and Africa Intravenous Solutions Industry Revenue (Million), by Country 2024 & 2032
- Figure 16: Middle East and Africa Intravenous Solutions Industry Volume (K Unit), by Country 2024 & 2032
- Figure 17: Middle East and Africa Intravenous Solutions Industry Revenue Share (%), by Country 2024 & 2032
- Figure 18: Middle East and Africa Intravenous Solutions Industry Volume Share (%), by Country 2024 & 2032
- Figure 19: South America Intravenous Solutions Industry Revenue (Million), by Country 2024 & 2032
- Figure 20: South America Intravenous Solutions Industry Volume (K Unit), by Country 2024 & 2032
- Figure 21: South America Intravenous Solutions Industry Revenue Share (%), by Country 2024 & 2032
- Figure 22: South America Intravenous Solutions Industry Volume Share (%), by Country 2024 & 2032
- Figure 23: North America Intravenous Solutions Industry Revenue (Million), by Type 2024 & 2032
- Figure 24: North America Intravenous Solutions Industry Volume (K Unit), by Type 2024 & 2032
- Figure 25: North America Intravenous Solutions Industry Revenue Share (%), by Type 2024 & 2032
- Figure 26: North America Intravenous Solutions Industry Volume Share (%), by Type 2024 & 2032
- Figure 27: North America Intravenous Solutions Industry Revenue (Million), by Solution Composition 2024 & 2032
- Figure 28: North America Intravenous Solutions Industry Volume (K Unit), by Solution Composition 2024 & 2032
- Figure 29: North America Intravenous Solutions Industry Revenue Share (%), by Solution Composition 2024 & 2032
- Figure 30: North America Intravenous Solutions Industry Volume Share (%), by Solution Composition 2024 & 2032
- Figure 31: North America Intravenous Solutions Industry Revenue (Million), by Country 2024 & 2032
- Figure 32: North America Intravenous Solutions Industry Volume (K Unit), by Country 2024 & 2032
- Figure 33: North America Intravenous Solutions Industry Revenue Share (%), by Country 2024 & 2032
- Figure 34: North America Intravenous Solutions Industry Volume Share (%), by Country 2024 & 2032
- Figure 35: Europe Intravenous Solutions Industry Revenue (Million), by Type 2024 & 2032
- Figure 36: Europe Intravenous Solutions Industry Volume (K Unit), by Type 2024 & 2032
- Figure 37: Europe Intravenous Solutions Industry Revenue Share (%), by Type 2024 & 2032
- Figure 38: Europe Intravenous Solutions Industry Volume Share (%), by Type 2024 & 2032
- Figure 39: Europe Intravenous Solutions Industry Revenue (Million), by Solution Composition 2024 & 2032
- Figure 40: Europe Intravenous Solutions Industry Volume (K Unit), by Solution Composition 2024 & 2032
- Figure 41: Europe Intravenous Solutions Industry Revenue Share (%), by Solution Composition 2024 & 2032
- Figure 42: Europe Intravenous Solutions Industry Volume Share (%), by Solution Composition 2024 & 2032
- Figure 43: Europe Intravenous Solutions Industry Revenue (Million), by Country 2024 & 2032
- Figure 44: Europe Intravenous Solutions Industry Volume (K Unit), by Country 2024 & 2032
- Figure 45: Europe Intravenous Solutions Industry Revenue Share (%), by Country 2024 & 2032
- Figure 46: Europe Intravenous Solutions Industry Volume Share (%), by Country 2024 & 2032
- Figure 47: Asia Pacific Intravenous Solutions Industry Revenue (Million), by Type 2024 & 2032
- Figure 48: Asia Pacific Intravenous Solutions Industry Volume (K Unit), by Type 2024 & 2032
- Figure 49: Asia Pacific Intravenous Solutions Industry Revenue Share (%), by Type 2024 & 2032
- Figure 50: Asia Pacific Intravenous Solutions Industry Volume Share (%), by Type 2024 & 2032
- Figure 51: Asia Pacific Intravenous Solutions Industry Revenue (Million), by Solution Composition 2024 & 2032
- Figure 52: Asia Pacific Intravenous Solutions Industry Volume (K Unit), by Solution Composition 2024 & 2032
- Figure 53: Asia Pacific Intravenous Solutions Industry Revenue Share (%), by Solution Composition 2024 & 2032
- Figure 54: Asia Pacific Intravenous Solutions Industry Volume Share (%), by Solution Composition 2024 & 2032
- Figure 55: Asia Pacific Intravenous Solutions Industry Revenue (Million), by Country 2024 & 2032
- Figure 56: Asia Pacific Intravenous Solutions Industry Volume (K Unit), by Country 2024 & 2032
- Figure 57: Asia Pacific Intravenous Solutions Industry Revenue Share (%), by Country 2024 & 2032
- Figure 58: Asia Pacific Intravenous Solutions Industry Volume Share (%), by Country 2024 & 2032
- Figure 59: Middle East and Africa Intravenous Solutions Industry Revenue (Million), by Type 2024 & 2032
- Figure 60: Middle East and Africa Intravenous Solutions Industry Volume (K Unit), by Type 2024 & 2032
- Figure 61: Middle East and Africa Intravenous Solutions Industry Revenue Share (%), by Type 2024 & 2032
- Figure 62: Middle East and Africa Intravenous Solutions Industry Volume Share (%), by Type 2024 & 2032
- Figure 63: Middle East and Africa Intravenous Solutions Industry Revenue (Million), by Solution Composition 2024 & 2032
- Figure 64: Middle East and Africa Intravenous Solutions Industry Volume (K Unit), by Solution Composition 2024 & 2032
- Figure 65: Middle East and Africa Intravenous Solutions Industry Revenue Share (%), by Solution Composition 2024 & 2032
- Figure 66: Middle East and Africa Intravenous Solutions Industry Volume Share (%), by Solution Composition 2024 & 2032
- Figure 67: Middle East and Africa Intravenous Solutions Industry Revenue (Million), by Country 2024 & 2032
- Figure 68: Middle East and Africa Intravenous Solutions Industry Volume (K Unit), by Country 2024 & 2032
- Figure 69: Middle East and Africa Intravenous Solutions Industry Revenue Share (%), by Country 2024 & 2032
- Figure 70: Middle East and Africa Intravenous Solutions Industry Volume Share (%), by Country 2024 & 2032
- Figure 71: South America Intravenous Solutions Industry Revenue (Million), by Type 2024 & 2032
- Figure 72: South America Intravenous Solutions Industry Volume (K Unit), by Type 2024 & 2032
- Figure 73: South America Intravenous Solutions Industry Revenue Share (%), by Type 2024 & 2032
- Figure 74: South America Intravenous Solutions Industry Volume Share (%), by Type 2024 & 2032
- Figure 75: South America Intravenous Solutions Industry Revenue (Million), by Solution Composition 2024 & 2032
- Figure 76: South America Intravenous Solutions Industry Volume (K Unit), by Solution Composition 2024 & 2032
- Figure 77: South America Intravenous Solutions Industry Revenue Share (%), by Solution Composition 2024 & 2032
- Figure 78: South America Intravenous Solutions Industry Volume Share (%), by Solution Composition 2024 & 2032
- Figure 79: South America Intravenous Solutions Industry Revenue (Million), by Country 2024 & 2032
- Figure 80: South America Intravenous Solutions Industry Volume (K Unit), by Country 2024 & 2032
- Figure 81: South America Intravenous Solutions Industry Revenue Share (%), by Country 2024 & 2032
- Figure 82: South America Intravenous Solutions Industry Volume Share (%), by Country 2024 & 2032
List of Tables
- Table 1: Global Intravenous Solutions Industry Revenue Million Forecast, by Region 2019 & 2032
- Table 2: Global Intravenous Solutions Industry Volume K Unit Forecast, by Region 2019 & 2032
- Table 3: Global Intravenous Solutions Industry Revenue Million Forecast, by Type 2019 & 2032
- Table 4: Global Intravenous Solutions Industry Volume K Unit Forecast, by Type 2019 & 2032
- Table 5: Global Intravenous Solutions Industry Revenue Million Forecast, by Solution Composition 2019 & 2032
- Table 6: Global Intravenous Solutions Industry Volume K Unit Forecast, by Solution Composition 2019 & 2032
- Table 7: Global Intravenous Solutions Industry Revenue Million Forecast, by Region 2019 & 2032
- Table 8: Global Intravenous Solutions Industry Volume K Unit Forecast, by Region 2019 & 2032
- Table 9: Global Intravenous Solutions Industry Revenue Million Forecast, by Country 2019 & 2032
- Table 10: Global Intravenous Solutions Industry Volume K Unit Forecast, by Country 2019 & 2032
- Table 11: Global Intravenous Solutions Industry Revenue Million Forecast, by Country 2019 & 2032
- Table 12: Global Intravenous Solutions Industry Volume K Unit Forecast, by Country 2019 & 2032
- Table 13: Global Intravenous Solutions Industry Revenue Million Forecast, by Country 2019 & 2032
- Table 14: Global Intravenous Solutions Industry Volume K Unit Forecast, by Country 2019 & 2032
- Table 15: Global Intravenous Solutions Industry Revenue Million Forecast, by Country 2019 & 2032
- Table 16: Global Intravenous Solutions Industry Volume K Unit Forecast, by Country 2019 & 2032
- Table 17: Global Intravenous Solutions Industry Revenue Million Forecast, by Country 2019 & 2032
- Table 18: Global Intravenous Solutions Industry Volume K Unit Forecast, by Country 2019 & 2032
- Table 19: Global Intravenous Solutions Industry Revenue Million Forecast, by Type 2019 & 2032
- Table 20: Global Intravenous Solutions Industry Volume K Unit Forecast, by Type 2019 & 2032
- Table 21: Global Intravenous Solutions Industry Revenue Million Forecast, by Solution Composition 2019 & 2032
- Table 22: Global Intravenous Solutions Industry Volume K Unit Forecast, by Solution Composition 2019 & 2032
- Table 23: Global Intravenous Solutions Industry Revenue Million Forecast, by Country 2019 & 2032
- Table 24: Global Intravenous Solutions Industry Volume K Unit Forecast, by Country 2019 & 2032
- Table 25: United States Intravenous Solutions Industry Revenue (Million) Forecast, by Application 2019 & 2032
- Table 26: United States Intravenous Solutions Industry Volume (K Unit) Forecast, by Application 2019 & 2032
- Table 27: Canada Intravenous Solutions Industry Revenue (Million) Forecast, by Application 2019 & 2032
- Table 28: Canada Intravenous Solutions Industry Volume (K Unit) Forecast, by Application 2019 & 2032
- Table 29: Mexico Intravenous Solutions Industry Revenue (Million) Forecast, by Application 2019 & 2032
- Table 30: Mexico Intravenous Solutions Industry Volume (K Unit) Forecast, by Application 2019 & 2032
- Table 31: Global Intravenous Solutions Industry Revenue Million Forecast, by Type 2019 & 2032
- Table 32: Global Intravenous Solutions Industry Volume K Unit Forecast, by Type 2019 & 2032
- Table 33: Global Intravenous Solutions Industry Revenue Million Forecast, by Solution Composition 2019 & 2032
- Table 34: Global Intravenous Solutions Industry Volume K Unit Forecast, by Solution Composition 2019 & 2032
- Table 35: Global Intravenous Solutions Industry Revenue Million Forecast, by Country 2019 & 2032
- Table 36: Global Intravenous Solutions Industry Volume K Unit Forecast, by Country 2019 & 2032
- Table 37: Germany Intravenous Solutions Industry Revenue (Million) Forecast, by Application 2019 & 2032
- Table 38: Germany Intravenous Solutions Industry Volume (K Unit) Forecast, by Application 2019 & 2032
- Table 39: United Kingdom Intravenous Solutions Industry Revenue (Million) Forecast, by Application 2019 & 2032
- Table 40: United Kingdom Intravenous Solutions Industry Volume (K Unit) Forecast, by Application 2019 & 2032
- Table 41: France Intravenous Solutions Industry Revenue (Million) Forecast, by Application 2019 & 2032
- Table 42: France Intravenous Solutions Industry Volume (K Unit) Forecast, by Application 2019 & 2032
- Table 43: Italy Intravenous Solutions Industry Revenue (Million) Forecast, by Application 2019 & 2032
- Table 44: Italy Intravenous Solutions Industry Volume (K Unit) Forecast, by Application 2019 & 2032
- Table 45: Spain Intravenous Solutions Industry Revenue (Million) Forecast, by Application 2019 & 2032
- Table 46: Spain Intravenous Solutions Industry Volume (K Unit) Forecast, by Application 2019 & 2032
- Table 47: Rest of Europe Intravenous Solutions Industry Revenue (Million) Forecast, by Application 2019 & 2032
- Table 48: Rest of Europe Intravenous Solutions Industry Volume (K Unit) Forecast, by Application 2019 & 2032
- Table 49: Global Intravenous Solutions Industry Revenue Million Forecast, by Type 2019 & 2032
- Table 50: Global Intravenous Solutions Industry Volume K Unit Forecast, by Type 2019 & 2032
- Table 51: Global Intravenous Solutions Industry Revenue Million Forecast, by Solution Composition 2019 & 2032
- Table 52: Global Intravenous Solutions Industry Volume K Unit Forecast, by Solution Composition 2019 & 2032
- Table 53: Global Intravenous Solutions Industry Revenue Million Forecast, by Country 2019 & 2032
- Table 54: Global Intravenous Solutions Industry Volume K Unit Forecast, by Country 2019 & 2032
- Table 55: China Intravenous Solutions Industry Revenue (Million) Forecast, by Application 2019 & 2032
- Table 56: China Intravenous Solutions Industry Volume (K Unit) Forecast, by Application 2019 & 2032
- Table 57: Japan Intravenous Solutions Industry Revenue (Million) Forecast, by Application 2019 & 2032
- Table 58: Japan Intravenous Solutions Industry Volume (K Unit) Forecast, by Application 2019 & 2032
- Table 59: India Intravenous Solutions Industry Revenue (Million) Forecast, by Application 2019 & 2032
- Table 60: India Intravenous Solutions Industry Volume (K Unit) Forecast, by Application 2019 & 2032
- Table 61: Australia Intravenous Solutions Industry Revenue (Million) Forecast, by Application 2019 & 2032
- Table 62: Australia Intravenous Solutions Industry Volume (K Unit) Forecast, by Application 2019 & 2032
- Table 63: South Korea Intravenous Solutions Industry Revenue (Million) Forecast, by Application 2019 & 2032
- Table 64: South Korea Intravenous Solutions Industry Volume (K Unit) Forecast, by Application 2019 & 2032
- Table 65: Rest of Asia Pacific Intravenous Solutions Industry Revenue (Million) Forecast, by Application 2019 & 2032
- Table 66: Rest of Asia Pacific Intravenous Solutions Industry Volume (K Unit) Forecast, by Application 2019 & 2032
- Table 67: Global Intravenous Solutions Industry Revenue Million Forecast, by Type 2019 & 2032
- Table 68: Global Intravenous Solutions Industry Volume K Unit Forecast, by Type 2019 & 2032
- Table 69: Global Intravenous Solutions Industry Revenue Million Forecast, by Solution Composition 2019 & 2032
- Table 70: Global Intravenous Solutions Industry Volume K Unit Forecast, by Solution Composition 2019 & 2032
- Table 71: Global Intravenous Solutions Industry Revenue Million Forecast, by Country 2019 & 2032
- Table 72: Global Intravenous Solutions Industry Volume K Unit Forecast, by Country 2019 & 2032
- Table 73: GCC Intravenous Solutions Industry Revenue (Million) Forecast, by Application 2019 & 2032
- Table 74: GCC Intravenous Solutions Industry Volume (K Unit) Forecast, by Application 2019 & 2032
- Table 75: South Africa Intravenous Solutions Industry Revenue (Million) Forecast, by Application 2019 & 2032
- Table 76: South Africa Intravenous Solutions Industry Volume (K Unit) Forecast, by Application 2019 & 2032
- Table 77: Rest of Middle East and Africa Intravenous Solutions Industry Revenue (Million) Forecast, by Application 2019 & 2032
- Table 78: Rest of Middle East and Africa Intravenous Solutions Industry Volume (K Unit) Forecast, by Application 2019 & 2032
- Table 79: Global Intravenous Solutions Industry Revenue Million Forecast, by Type 2019 & 2032
- Table 80: Global Intravenous Solutions Industry Volume K Unit Forecast, by Type 2019 & 2032
- Table 81: Global Intravenous Solutions Industry Revenue Million Forecast, by Solution Composition 2019 & 2032
- Table 82: Global Intravenous Solutions Industry Volume K Unit Forecast, by Solution Composition 2019 & 2032
- Table 83: Global Intravenous Solutions Industry Revenue Million Forecast, by Country 2019 & 2032
- Table 84: Global Intravenous Solutions Industry Volume K Unit Forecast, by Country 2019 & 2032
- Table 85: Brazil Intravenous Solutions Industry Revenue (Million) Forecast, by Application 2019 & 2032
- Table 86: Brazil Intravenous Solutions Industry Volume (K Unit) Forecast, by Application 2019 & 2032
- Table 87: Argentina Intravenous Solutions Industry Revenue (Million) Forecast, by Application 2019 & 2032
- Table 88: Argentina Intravenous Solutions Industry Volume (K Unit) Forecast, by Application 2019 & 2032
- Table 89: Rest of South America Intravenous Solutions Industry Revenue (Million) Forecast, by Application 2019 & 2032
- Table 90: Rest of South America Intravenous Solutions Industry Volume (K Unit) Forecast, by Application 2019 & 2032
Frequently Asked Questions
1. What is the projected Compound Annual Growth Rate (CAGR) of the Intravenous Solutions Industry?
The projected CAGR is approximately 4.30%.
2. Which companies are prominent players in the Intravenous Solutions Industry?
Key companies in the market include Ajinomoto, ICU Medical Inc, Grifols, Omnicare, Fresenius Kabi AG, Anhui Medipharm Co Ltd, Wuhan Uni-Pharma Bio-Tech Co Ltd , B Braun Melsungen AG, Vifor Pharma, Baxter International.
3. What are the main segments of the Intravenous Solutions Industry?
The market segments include Type, Solution Composition.
4. Can you provide details about the market size?
The market size is estimated to be USD XX Million as of 2022.
5. What are some drivers contributing to market growth?
Increasing Prevalence of Diseases. such as Gastrointestinal Disorder. Neurological Diseases. and Cancer; Advancements and New Innovations in the Products for Patient Convenience.
6. What are the notable trends driving market growth?
Total Parenteral Nutrition Segment is Dominating the Intravenous Solutions Market.
7. Are there any restraints impacting market growth?
Regulatory and Quality Requirements.
8. Can you provide examples of recent developments in the market?
In February 2022, B. Braun Medical received the US FDA approval to begin operations at its new IV saline solution manufacturing facility in Daytona Beach, Florida.
9. What pricing options are available for accessing the report?
Pricing options include single-user, multi-user, and enterprise licenses priced at USD 4750, USD 5250, and USD 8750 respectively.
10. Is the market size provided in terms of value or volume?
The market size is provided in terms of value, measured in Million and volume, measured in K Unit.
11. Are there any specific market keywords associated with the report?
Yes, the market keyword associated with the report is "Intravenous Solutions Industry," which aids in identifying and referencing the specific market segment covered.
12. How do I determine which pricing option suits my needs best?
The pricing options vary based on user requirements and access needs. Individual users may opt for single-user licenses, while businesses requiring broader access may choose multi-user or enterprise licenses for cost-effective access to the report.
13. Are there any additional resources or data provided in the Intravenous Solutions Industry report?
While the report offers comprehensive insights, it's advisable to review the specific contents or supplementary materials provided to ascertain if additional resources or data are available.
14. How can I stay updated on further developments or reports in the Intravenous Solutions Industry?
To stay informed about further developments, trends, and reports in the Intravenous Solutions Industry, consider subscribing to industry newsletters, following relevant companies and organizations, or regularly checking reputable industry news sources and publications.
Methodology
Step 1 - Identification of Relevant Samples Size from Population Database


Step 2 - Approaches for Defining Global Market Size (Value, Volume* & Price*)

Note*: In applicable scenarios
Step 3 - Data Sources
Primary Research
- Web Analytics
- Survey Reports
- Research Institute
- Latest Research Reports
- Opinion Leaders
Secondary Research
- Annual Reports
- White Paper
- Latest Press Release
- Industry Association
- Paid Database
- Investor Presentations

Step 4 - Data Triangulation
Involves using different sources of information in order to increase the validity of a study
These sources are likely to be stakeholders in a program - participants, other researchers, program staff, other community members, and so on.
Then we put all data in single framework & apply various statistical tools to find out the dynamic on the market.
During the analysis stage, feedback from the stakeholder groups would be compared to determine areas of agreement as well as areas of divergence
