

Key Insights
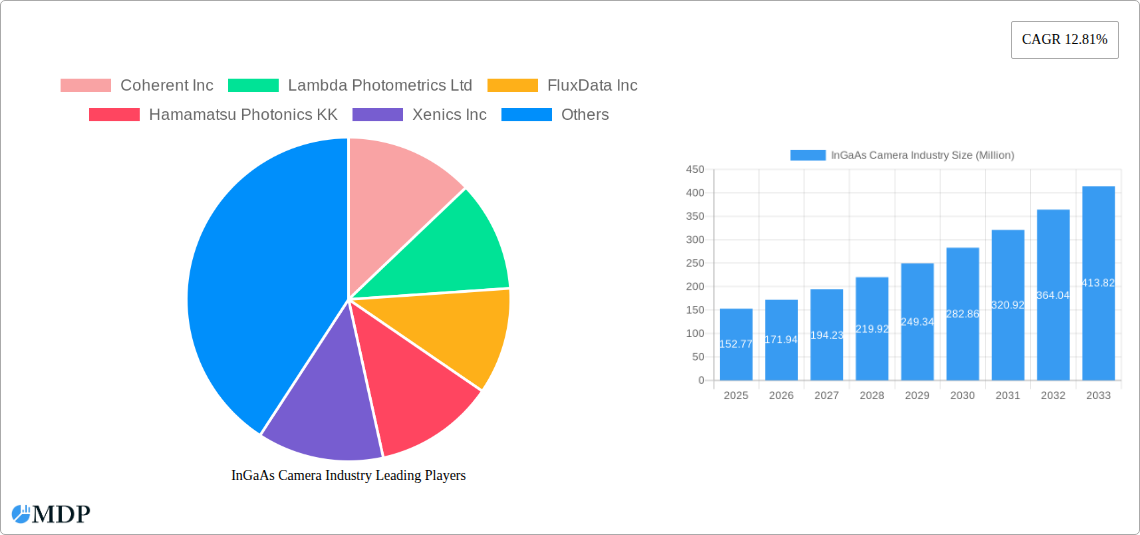
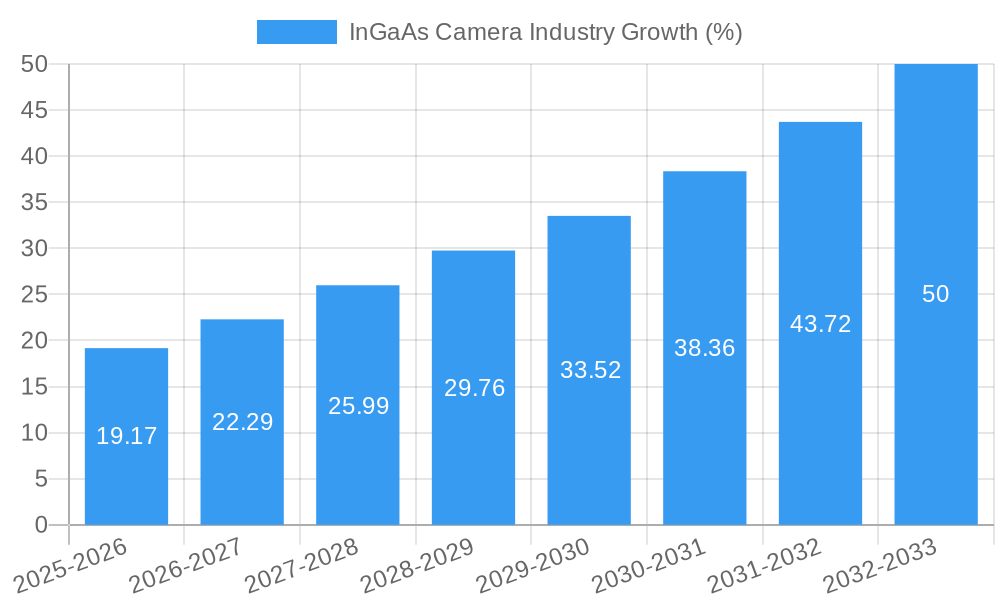
The InGaAs camera market, valued at $152.77 million in 2025, is poised for robust growth, exhibiting a Compound Annual Growth Rate (CAGR) of 12.81% from 2025 to 2033. This expansion is driven primarily by increasing demand across diverse sectors. The military and defense sector, a significant consumer of InGaAs cameras for night vision and surveillance applications, fuels market growth. Simultaneously, the industrial automation sector's adoption of these cameras for precise and high-speed imaging in robotics and quality control contributes to market expansion. The surge in security and surveillance initiatives globally is further boosting demand. Advanced features like improved sensitivity, higher resolution, and reduced costs are enhancing market appeal, attracting a wider range of applications. Technological advancements leading to miniaturization and improved performance are key trends. However, the high initial investment required for InGaAs camera systems and the limited availability of skilled professionals for integration and maintenance could pose challenges to market penetration in certain regions.
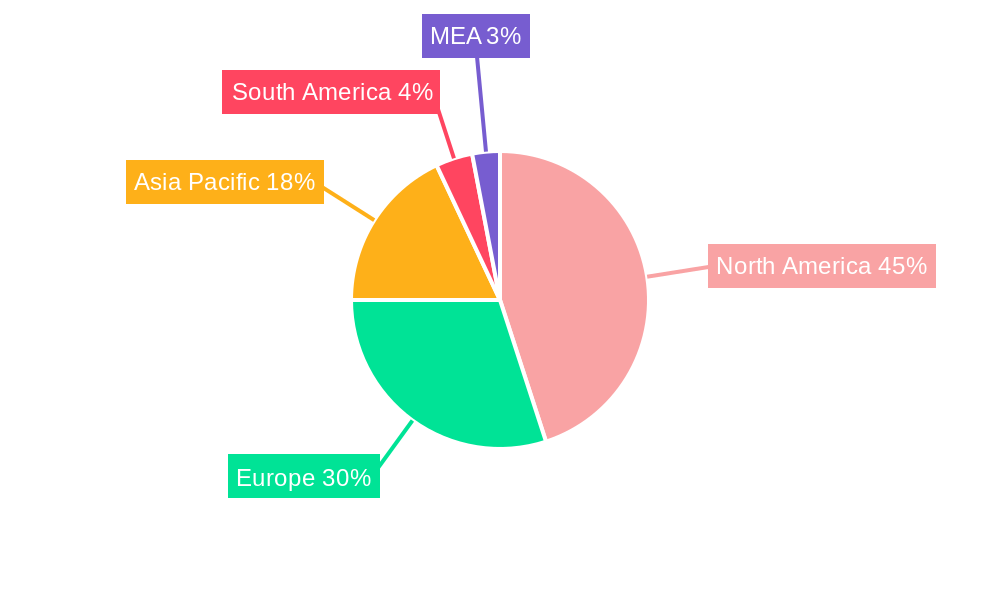
North America currently dominates the market, with the United States as a major consumer due to substantial investments in defense and security technologies. Europe follows closely, with Germany and the United Kingdom leading the adoption of InGaAs cameras in industrial and automotive applications. The Asia-Pacific region shows significant growth potential, driven by rapid industrialization and increasing government spending on surveillance and security systems, particularly in China, India, and Japan. While South America and the Middle East & Africa exhibit slower growth, the market is anticipated to expand as technology adoption increases and infrastructural development accelerates in these regions. The competitive landscape features a mix of established players and emerging technology providers, resulting in a dynamic and innovative market. Companies are focusing on strategic partnerships and product diversification to maintain their competitive edge.
InGaAs Camera Industry Market Report: 2019-2033
This comprehensive report provides an in-depth analysis of the InGaAs camera industry, offering invaluable insights for stakeholders seeking to navigate this dynamic market. With a focus on market dynamics, trends, leading players, and future opportunities, this report covers the period from 2019 to 2033, with a base year of 2025. The report projects a market valued at xx Million by 2033, exhibiting a CAGR of xx% during the forecast period (2025-2033). This detailed analysis incorporates historical data (2019-2024) and provides crucial estimates for 2025. Maximize your understanding of this lucrative market and gain a competitive edge with this essential resource.
InGaAs Camera Industry Market Dynamics & Concentration
The InGaAs camera market is experiencing significant growth driven by technological advancements, increasing demand across diverse applications, and strategic mergers and acquisitions (M&A). Market concentration is moderate, with several key players holding substantial market share. However, the entry of new players with innovative products is steadily increasing competition.
- Market Share: The top five players collectively hold approximately xx% of the global market share in 2025, with Coherent Inc. estimated to lead at xx%.
- M&A Activity: The industry has witnessed xx M&A deals between 2019 and 2024, indicating a consolidation trend.
- Innovation Drivers: Advancements in sensor technology, miniaturization, improved sensitivity, and wider spectral range capabilities are driving market growth.
- Regulatory Frameworks: Government regulations related to defense and security applications influence market dynamics. Specific regulations vary by region, creating market opportunities and challenges.
- Product Substitutes: While InGaAs cameras offer unique advantages in specific applications, alternative technologies like CMOS and CCD cameras pose some competitive pressure in certain segments.
- End-User Trends: The increasing adoption of InGaAs cameras in industrial automation, surveillance, and medical imaging drives market demand.
InGaAs Camera Industry Industry Trends & Analysis
The InGaAs camera market is witnessing robust growth fueled by a confluence of factors. The rising demand for high-performance imaging solutions across various sectors, coupled with technological breakthroughs in sensor technology, is propelling market expansion. A notable trend is the miniaturization of InGaAs cameras, enabling their integration into compact and portable systems. This trend, combined with the increasing availability of higher-resolution sensors, is widening the range of applications. The market is also witnessing a surge in the development of sophisticated image processing algorithms, enhancing the quality and usability of the captured images. The CAGR for the period 2025-2033 is estimated at xx%, reflecting a healthy and sustained growth trajectory. Market penetration is expected to increase significantly in emerging economies due to rising industrialization and investment in infrastructure. Competitive dynamics are characterized by intense innovation, strategic partnerships, and a focus on product differentiation.
Leading Markets & Segments in InGaAs Camera Industry
The North American region dominates the InGaAs camera market, primarily due to substantial investments in defense and security applications and a robust industrial automation sector. The strong presence of key industry players and significant R&D investment further contribute to its market leadership.
- Key Drivers for North America:
- High government spending on defense and security.
- Strong industrial automation sector.
- Established research and development infrastructure.
- Military and Defense: This segment holds a major share of the market due to the critical need for high-performance imaging in military and surveillance applications.
- Industrial Automation: The segment is experiencing rapid growth due to increasing adoption of advanced imaging systems for quality control, process monitoring, and robotic vision.
- Surveillance and Security: The segment is driven by the need for enhanced security features in various applications like border security, traffic monitoring, and law enforcement.
- Other Applications: These include medical imaging, scientific research, and environmental monitoring.
InGaAs Camera Industry Product Developments
Recent product developments highlight a trend towards higher resolution, increased sensitivity, and wider spectral ranges in InGaAs cameras. Companies are focusing on developing compact, cost-effective, and easy-to-integrate solutions. The incorporation of advanced image processing algorithms further enhances the performance and usability of InGaAs cameras. This is driving their adoption in a wider range of applications, from industrial automation to scientific research.
Key Drivers of InGaAs Camera Industry Growth
Several factors are driving the growth of the InGaAs camera industry. Technological advancements, such as improved sensor performance and miniaturization, are a primary driver. Increased demand from various end-use sectors, particularly military and defense, industrial automation, and surveillance and security, is fueling market expansion. Furthermore, supportive government policies and investments in research and development are fostering industry growth.
Challenges in the InGaAs Camera Industry Market
The InGaAs camera market faces several challenges. High manufacturing costs and limited availability of high-quality InGaAs sensors can impact affordability. Supply chain disruptions and fluctuations in raw material prices pose further risks. Intense competition and the emergence of alternative technologies also present hurdles to sustained growth. These challenges collectively restrain market expansion. The impact of these challenges is estimated to be a xx% reduction in the overall market growth in 2025.
Emerging Opportunities in InGaAs Camera Industry
The future of the InGaAs camera industry holds immense potential. Technological advancements, such as the development of more efficient and cost-effective InGaAs sensors, will unlock new applications. Strategic partnerships and collaborations between manufacturers and end-users can expand market reach. Exploration of new market segments, such as medical imaging and environmental monitoring, offers significant growth opportunities.
Leading Players in the InGaAs Camera Industry Sector
- Coherent Inc
- Lambda Photometrics Ltd
- FluxData Inc
- Hamamatsu Photonics KK
- Xenics Inc
- Raptor Photonics Ltd
- Specim Spectral Imaging Ltd
- New Imaging Technologies
- Allied Vision Technologies GmbH (TKH group)
- Flir Systems Inc
- Sensors Unlimited (Collins Aerospace Company)
- Acal BFI Limited Company (Discoverie Group PLC)
Key Milestones in InGaAs Camera Industry Industry
- April 2022: 3D PLUS expanded its space camera head family with a high-density, high-performance 1.31 Mpixels SWIR Camera Head for space applications. This launch signifies progress in high-performance SWIR imaging for demanding space applications.
- January 2022: LUCID Vision Labs introduced the Atlas SWIR IP67-rated cameras with Sony SenSWIR InGaAs sensors. This product launch highlights the growing trend of integrating InGaAs sensors into compact, robust industrial cameras.
Strategic Outlook for InGaAs Camera Industry Market
The InGaAs camera market is poised for significant growth, driven by technological innovation and increasing demand across various sectors. Strategic partnerships, investments in R&D, and expansion into new applications will be crucial for market success. The focus on developing cost-effective, high-performance solutions tailored to specific applications will shape the future of the InGaAs camera industry. The market exhibits strong potential for expansion due to its ability to address crucial needs in diverse sectors, making it an attractive investment area.
InGaAs Camera Industry Segmentation
-
1. Application
- 1.1. Military and Defense
- 1.2. Industrial Automation
- 1.3. Surveillance and Security
- 1.4. Other Applications
-
2. Region
- 2.1. North America
- 2.2. Europe
- 2.3. Asia-Pacific
- 2.4. Rest of the World
InGaAs Camera Industry Segmentation By Geography
-
1. North America
- 1.1. United States
- 1.2. Canada
-
2. Europe
- 2.1. United Kingdom
- 2.2. Germany
- 2.3. France
- 2.4. Italy
-
3. Asia
- 3.1. China
- 3.2. India
- 3.3. Japan
- 3.4. Australia and New Zealand
- 3.5. South East Asia
- 4. Latin America
- 5. Middle East and Africa
InGaAs Camera Industry REPORT HIGHLIGHTS
| Aspects | Details |
|---|---|
| Study Period | 2019-2033 |
| Base Year | 2024 |
| Estimated Year | 2025 |
| Forecast Period | 2025-2033 |
| Historical Period | 2019-2024 |
| Growth Rate | CAGR of 12.81% from 2019-2033 |
| Segmentation |
|
Table of Contents
- 1. Introduction
- 1.1. Research Scope
- 1.2. Market Segmentation
- 1.3. Research Methodology
- 1.4. Definitions and Assumptions
- 2. Executive Summary
- 2.1. Introduction
- 3. Market Dynamics
- 3.1. Introduction
- 3.2. Market Drivers
- 3.2.1. Increasing Adoption in Machine Vision Applications; Rising Demand in Military and Defense Operations
- 3.3. Market Restrains
- 3.3.1. Customized Demands by Drillers; Decline in Drilling Activities and Rig Counts
- 3.4. Market Trends
- 3.4.1. Industrial Automation Expected to Occupy the Largest Market Share
- 4. Market Factor Analysis
- 4.1. Porters Five Forces
- 4.2. Supply/Value Chain
- 4.3. PESTEL analysis
- 4.4. Market Entropy
- 4.5. Patent/Trademark Analysis
- 5. Global InGaAs Camera Industry Analysis, Insights and Forecast, 2019-2031
- 5.1. Market Analysis, Insights and Forecast - by Application
- 5.1.1. Military and Defense
- 5.1.2. Industrial Automation
- 5.1.3. Surveillance and Security
- 5.1.4. Other Applications
- 5.2. Market Analysis, Insights and Forecast - by Region
- 5.2.1. North America
- 5.2.2. Europe
- 5.2.3. Asia-Pacific
- 5.2.4. Rest of the World
- 5.3. Market Analysis, Insights and Forecast - by Region
- 5.3.1. North America
- 5.3.2. Europe
- 5.3.3. Asia
- 5.3.4. Latin America
- 5.3.5. Middle East and Africa
- 5.1. Market Analysis, Insights and Forecast - by Application
- 6. North America InGaAs Camera Industry Analysis, Insights and Forecast, 2019-2031
- 6.1. Market Analysis, Insights and Forecast - by Application
- 6.1.1. Military and Defense
- 6.1.2. Industrial Automation
- 6.1.3. Surveillance and Security
- 6.1.4. Other Applications
- 6.2. Market Analysis, Insights and Forecast - by Region
- 6.2.1. North America
- 6.2.2. Europe
- 6.2.3. Asia-Pacific
- 6.2.4. Rest of the World
- 6.1. Market Analysis, Insights and Forecast - by Application
- 7. Europe InGaAs Camera Industry Analysis, Insights and Forecast, 2019-2031
- 7.1. Market Analysis, Insights and Forecast - by Application
- 7.1.1. Military and Defense
- 7.1.2. Industrial Automation
- 7.1.3. Surveillance and Security
- 7.1.4. Other Applications
- 7.2. Market Analysis, Insights and Forecast - by Region
- 7.2.1. North America
- 7.2.2. Europe
- 7.2.3. Asia-Pacific
- 7.2.4. Rest of the World
- 7.1. Market Analysis, Insights and Forecast - by Application
- 8. Asia InGaAs Camera Industry Analysis, Insights and Forecast, 2019-2031
- 8.1. Market Analysis, Insights and Forecast - by Application
- 8.1.1. Military and Defense
- 8.1.2. Industrial Automation
- 8.1.3. Surveillance and Security
- 8.1.4. Other Applications
- 8.2. Market Analysis, Insights and Forecast - by Region
- 8.2.1. North America
- 8.2.2. Europe
- 8.2.3. Asia-Pacific
- 8.2.4. Rest of the World
- 8.1. Market Analysis, Insights and Forecast - by Application
- 9. Latin America InGaAs Camera Industry Analysis, Insights and Forecast, 2019-2031
- 9.1. Market Analysis, Insights and Forecast - by Application
- 9.1.1. Military and Defense
- 9.1.2. Industrial Automation
- 9.1.3. Surveillance and Security
- 9.1.4. Other Applications
- 9.2. Market Analysis, Insights and Forecast - by Region
- 9.2.1. North America
- 9.2.2. Europe
- 9.2.3. Asia-Pacific
- 9.2.4. Rest of the World
- 9.1. Market Analysis, Insights and Forecast - by Application
- 10. Middle East and Africa InGaAs Camera Industry Analysis, Insights and Forecast, 2019-2031
- 10.1. Market Analysis, Insights and Forecast - by Application
- 10.1.1. Military and Defense
- 10.1.2. Industrial Automation
- 10.1.3. Surveillance and Security
- 10.1.4. Other Applications
- 10.2. Market Analysis, Insights and Forecast - by Region
- 10.2.1. North America
- 10.2.2. Europe
- 10.2.3. Asia-Pacific
- 10.2.4. Rest of the World
- 10.1. Market Analysis, Insights and Forecast - by Application
- 11. North America InGaAs Camera Industry Analysis, Insights and Forecast, 2019-2031
- 11.1. Market Analysis, Insights and Forecast - By Country/Sub-region
- 11.1.1 United States
- 11.1.2 Canada
- 11.1.3 Mexico
- 12. Europe InGaAs Camera Industry Analysis, Insights and Forecast, 2019-2031
- 12.1. Market Analysis, Insights and Forecast - By Country/Sub-region
- 12.1.1 Germany
- 12.1.2 United Kingdom
- 12.1.3 France
- 12.1.4 Spain
- 12.1.5 Italy
- 12.1.6 Spain
- 12.1.7 Belgium
- 12.1.8 Netherland
- 12.1.9 Nordics
- 12.1.10 Rest of Europe
- 13. Asia Pacific InGaAs Camera Industry Analysis, Insights and Forecast, 2019-2031
- 13.1. Market Analysis, Insights and Forecast - By Country/Sub-region
- 13.1.1 China
- 13.1.2 Japan
- 13.1.3 India
- 13.1.4 South Korea
- 13.1.5 Southeast Asia
- 13.1.6 Australia
- 13.1.7 Indonesia
- 13.1.8 Phillipes
- 13.1.9 Singapore
- 13.1.10 Thailandc
- 13.1.11 Rest of Asia Pacific
- 14. South America InGaAs Camera Industry Analysis, Insights and Forecast, 2019-2031
- 14.1. Market Analysis, Insights and Forecast - By Country/Sub-region
- 14.1.1 Brazil
- 14.1.2 Argentina
- 14.1.3 Peru
- 14.1.4 Chile
- 14.1.5 Colombia
- 14.1.6 Ecuador
- 14.1.7 Venezuela
- 14.1.8 Rest of South America
- 15. North America InGaAs Camera Industry Analysis, Insights and Forecast, 2019-2031
- 15.1. Market Analysis, Insights and Forecast - By Country/Sub-region
- 15.1.1 United States
- 15.1.2 Canada
- 15.1.3 Mexico
- 16. MEA InGaAs Camera Industry Analysis, Insights and Forecast, 2019-2031
- 16.1. Market Analysis, Insights and Forecast - By Country/Sub-region
- 16.1.1 United Arab Emirates
- 16.1.2 Saudi Arabia
- 16.1.3 South Africa
- 16.1.4 Rest of Middle East and Africa
- 17. Competitive Analysis
- 17.1. Global Market Share Analysis 2024
- 17.2. Company Profiles
- 17.2.1 Coherent Inc
- 17.2.1.1. Overview
- 17.2.1.2. Products
- 17.2.1.3. SWOT Analysis
- 17.2.1.4. Recent Developments
- 17.2.1.5. Financials (Based on Availability)
- 17.2.2 Lambda Photometrics Ltd
- 17.2.2.1. Overview
- 17.2.2.2. Products
- 17.2.2.3. SWOT Analysis
- 17.2.2.4. Recent Developments
- 17.2.2.5. Financials (Based on Availability)
- 17.2.3 FluxData Inc
- 17.2.3.1. Overview
- 17.2.3.2. Products
- 17.2.3.3. SWOT Analysis
- 17.2.3.4. Recent Developments
- 17.2.3.5. Financials (Based on Availability)
- 17.2.4 Hamamatsu Photonics KK
- 17.2.4.1. Overview
- 17.2.4.2. Products
- 17.2.4.3. SWOT Analysis
- 17.2.4.4. Recent Developments
- 17.2.4.5. Financials (Based on Availability)
- 17.2.5 Xenics Inc
- 17.2.5.1. Overview
- 17.2.5.2. Products
- 17.2.5.3. SWOT Analysis
- 17.2.5.4. Recent Developments
- 17.2.5.5. Financials (Based on Availability)
- 17.2.6 Raptor Photonics Ltd
- 17.2.6.1. Overview
- 17.2.6.2. Products
- 17.2.6.3. SWOT Analysis
- 17.2.6.4. Recent Developments
- 17.2.6.5. Financials (Based on Availability)
- 17.2.7 Specim Spectral Imaging Ltd
- 17.2.7.1. Overview
- 17.2.7.2. Products
- 17.2.7.3. SWOT Analysis
- 17.2.7.4. Recent Developments
- 17.2.7.5. Financials (Based on Availability)
- 17.2.8 New Imaging Technologies
- 17.2.8.1. Overview
- 17.2.8.2. Products
- 17.2.8.3. SWOT Analysis
- 17.2.8.4. Recent Developments
- 17.2.8.5. Financials (Based on Availability)
- 17.2.9 Allied Vision Technologies GmbH (TKH group)
- 17.2.9.1. Overview
- 17.2.9.2. Products
- 17.2.9.3. SWOT Analysis
- 17.2.9.4. Recent Developments
- 17.2.9.5. Financials (Based on Availability)
- 17.2.10 Flir Systems Inc
- 17.2.10.1. Overview
- 17.2.10.2. Products
- 17.2.10.3. SWOT Analysis
- 17.2.10.4. Recent Developments
- 17.2.10.5. Financials (Based on Availability)
- 17.2.11 Sensors Unlimited (Collins Aerospace Company)
- 17.2.11.1. Overview
- 17.2.11.2. Products
- 17.2.11.3. SWOT Analysis
- 17.2.11.4. Recent Developments
- 17.2.11.5. Financials (Based on Availability)
- 17.2.12 Acal BFI Limited Company (Discoverie Group PLC)
- 17.2.12.1. Overview
- 17.2.12.2. Products
- 17.2.12.3. SWOT Analysis
- 17.2.12.4. Recent Developments
- 17.2.12.5. Financials (Based on Availability)
- 17.2.1 Coherent Inc
List of Figures
- Figure 1: Global InGaAs Camera Industry Revenue Breakdown (Million, %) by Region 2024 & 2032
- Figure 2: Global InGaAs Camera Industry Volume Breakdown (K Unit, %) by Region 2024 & 2032
- Figure 3: North America InGaAs Camera Industry Revenue (Million), by Country 2024 & 2032
- Figure 4: North America InGaAs Camera Industry Volume (K Unit), by Country 2024 & 2032
- Figure 5: North America InGaAs Camera Industry Revenue Share (%), by Country 2024 & 2032
- Figure 6: North America InGaAs Camera Industry Volume Share (%), by Country 2024 & 2032
- Figure 7: Europe InGaAs Camera Industry Revenue (Million), by Country 2024 & 2032
- Figure 8: Europe InGaAs Camera Industry Volume (K Unit), by Country 2024 & 2032
- Figure 9: Europe InGaAs Camera Industry Revenue Share (%), by Country 2024 & 2032
- Figure 10: Europe InGaAs Camera Industry Volume Share (%), by Country 2024 & 2032
- Figure 11: Asia Pacific InGaAs Camera Industry Revenue (Million), by Country 2024 & 2032
- Figure 12: Asia Pacific InGaAs Camera Industry Volume (K Unit), by Country 2024 & 2032
- Figure 13: Asia Pacific InGaAs Camera Industry Revenue Share (%), by Country 2024 & 2032
- Figure 14: Asia Pacific InGaAs Camera Industry Volume Share (%), by Country 2024 & 2032
- Figure 15: South America InGaAs Camera Industry Revenue (Million), by Country 2024 & 2032
- Figure 16: South America InGaAs Camera Industry Volume (K Unit), by Country 2024 & 2032
- Figure 17: South America InGaAs Camera Industry Revenue Share (%), by Country 2024 & 2032
- Figure 18: South America InGaAs Camera Industry Volume Share (%), by Country 2024 & 2032
- Figure 19: North America InGaAs Camera Industry Revenue (Million), by Country 2024 & 2032
- Figure 20: North America InGaAs Camera Industry Volume (K Unit), by Country 2024 & 2032
- Figure 21: North America InGaAs Camera Industry Revenue Share (%), by Country 2024 & 2032
- Figure 22: North America InGaAs Camera Industry Volume Share (%), by Country 2024 & 2032
- Figure 23: MEA InGaAs Camera Industry Revenue (Million), by Country 2024 & 2032
- Figure 24: MEA InGaAs Camera Industry Volume (K Unit), by Country 2024 & 2032
- Figure 25: MEA InGaAs Camera Industry Revenue Share (%), by Country 2024 & 2032
- Figure 26: MEA InGaAs Camera Industry Volume Share (%), by Country 2024 & 2032
- Figure 27: North America InGaAs Camera Industry Revenue (Million), by Application 2024 & 2032
- Figure 28: North America InGaAs Camera Industry Volume (K Unit), by Application 2024 & 2032
- Figure 29: North America InGaAs Camera Industry Revenue Share (%), by Application 2024 & 2032
- Figure 30: North America InGaAs Camera Industry Volume Share (%), by Application 2024 & 2032
- Figure 31: North America InGaAs Camera Industry Revenue (Million), by Region 2024 & 2032
- Figure 32: North America InGaAs Camera Industry Volume (K Unit), by Region 2024 & 2032
- Figure 33: North America InGaAs Camera Industry Revenue Share (%), by Region 2024 & 2032
- Figure 34: North America InGaAs Camera Industry Volume Share (%), by Region 2024 & 2032
- Figure 35: North America InGaAs Camera Industry Revenue (Million), by Country 2024 & 2032
- Figure 36: North America InGaAs Camera Industry Volume (K Unit), by Country 2024 & 2032
- Figure 37: North America InGaAs Camera Industry Revenue Share (%), by Country 2024 & 2032
- Figure 38: North America InGaAs Camera Industry Volume Share (%), by Country 2024 & 2032
- Figure 39: Europe InGaAs Camera Industry Revenue (Million), by Application 2024 & 2032
- Figure 40: Europe InGaAs Camera Industry Volume (K Unit), by Application 2024 & 2032
- Figure 41: Europe InGaAs Camera Industry Revenue Share (%), by Application 2024 & 2032
- Figure 42: Europe InGaAs Camera Industry Volume Share (%), by Application 2024 & 2032
- Figure 43: Europe InGaAs Camera Industry Revenue (Million), by Region 2024 & 2032
- Figure 44: Europe InGaAs Camera Industry Volume (K Unit), by Region 2024 & 2032
- Figure 45: Europe InGaAs Camera Industry Revenue Share (%), by Region 2024 & 2032
- Figure 46: Europe InGaAs Camera Industry Volume Share (%), by Region 2024 & 2032
- Figure 47: Europe InGaAs Camera Industry Revenue (Million), by Country 2024 & 2032
- Figure 48: Europe InGaAs Camera Industry Volume (K Unit), by Country 2024 & 2032
- Figure 49: Europe InGaAs Camera Industry Revenue Share (%), by Country 2024 & 2032
- Figure 50: Europe InGaAs Camera Industry Volume Share (%), by Country 2024 & 2032
- Figure 51: Asia InGaAs Camera Industry Revenue (Million), by Application 2024 & 2032
- Figure 52: Asia InGaAs Camera Industry Volume (K Unit), by Application 2024 & 2032
- Figure 53: Asia InGaAs Camera Industry Revenue Share (%), by Application 2024 & 2032
- Figure 54: Asia InGaAs Camera Industry Volume Share (%), by Application 2024 & 2032
- Figure 55: Asia InGaAs Camera Industry Revenue (Million), by Region 2024 & 2032
- Figure 56: Asia InGaAs Camera Industry Volume (K Unit), by Region 2024 & 2032
- Figure 57: Asia InGaAs Camera Industry Revenue Share (%), by Region 2024 & 2032
- Figure 58: Asia InGaAs Camera Industry Volume Share (%), by Region 2024 & 2032
- Figure 59: Asia InGaAs Camera Industry Revenue (Million), by Country 2024 & 2032
- Figure 60: Asia InGaAs Camera Industry Volume (K Unit), by Country 2024 & 2032
- Figure 61: Asia InGaAs Camera Industry Revenue Share (%), by Country 2024 & 2032
- Figure 62: Asia InGaAs Camera Industry Volume Share (%), by Country 2024 & 2032
- Figure 63: Latin America InGaAs Camera Industry Revenue (Million), by Application 2024 & 2032
- Figure 64: Latin America InGaAs Camera Industry Volume (K Unit), by Application 2024 & 2032
- Figure 65: Latin America InGaAs Camera Industry Revenue Share (%), by Application 2024 & 2032
- Figure 66: Latin America InGaAs Camera Industry Volume Share (%), by Application 2024 & 2032
- Figure 67: Latin America InGaAs Camera Industry Revenue (Million), by Region 2024 & 2032
- Figure 68: Latin America InGaAs Camera Industry Volume (K Unit), by Region 2024 & 2032
- Figure 69: Latin America InGaAs Camera Industry Revenue Share (%), by Region 2024 & 2032
- Figure 70: Latin America InGaAs Camera Industry Volume Share (%), by Region 2024 & 2032
- Figure 71: Latin America InGaAs Camera Industry Revenue (Million), by Country 2024 & 2032
- Figure 72: Latin America InGaAs Camera Industry Volume (K Unit), by Country 2024 & 2032
- Figure 73: Latin America InGaAs Camera Industry Revenue Share (%), by Country 2024 & 2032
- Figure 74: Latin America InGaAs Camera Industry Volume Share (%), by Country 2024 & 2032
- Figure 75: Middle East and Africa InGaAs Camera Industry Revenue (Million), by Application 2024 & 2032
- Figure 76: Middle East and Africa InGaAs Camera Industry Volume (K Unit), by Application 2024 & 2032
- Figure 77: Middle East and Africa InGaAs Camera Industry Revenue Share (%), by Application 2024 & 2032
- Figure 78: Middle East and Africa InGaAs Camera Industry Volume Share (%), by Application 2024 & 2032
- Figure 79: Middle East and Africa InGaAs Camera Industry Revenue (Million), by Region 2024 & 2032
- Figure 80: Middle East and Africa InGaAs Camera Industry Volume (K Unit), by Region 2024 & 2032
- Figure 81: Middle East and Africa InGaAs Camera Industry Revenue Share (%), by Region 2024 & 2032
- Figure 82: Middle East and Africa InGaAs Camera Industry Volume Share (%), by Region 2024 & 2032
- Figure 83: Middle East and Africa InGaAs Camera Industry Revenue (Million), by Country 2024 & 2032
- Figure 84: Middle East and Africa InGaAs Camera Industry Volume (K Unit), by Country 2024 & 2032
- Figure 85: Middle East and Africa InGaAs Camera Industry Revenue Share (%), by Country 2024 & 2032
- Figure 86: Middle East and Africa InGaAs Camera Industry Volume Share (%), by Country 2024 & 2032
List of Tables
- Table 1: Global InGaAs Camera Industry Revenue Million Forecast, by Region 2019 & 2032
- Table 2: Global InGaAs Camera Industry Volume K Unit Forecast, by Region 2019 & 2032
- Table 3: Global InGaAs Camera Industry Revenue Million Forecast, by Application 2019 & 2032
- Table 4: Global InGaAs Camera Industry Volume K Unit Forecast, by Application 2019 & 2032
- Table 5: Global InGaAs Camera Industry Revenue Million Forecast, by Region 2019 & 2032
- Table 6: Global InGaAs Camera Industry Volume K Unit Forecast, by Region 2019 & 2032
- Table 7: Global InGaAs Camera Industry Revenue Million Forecast, by Region 2019 & 2032
- Table 8: Global InGaAs Camera Industry Volume K Unit Forecast, by Region 2019 & 2032
- Table 9: Global InGaAs Camera Industry Revenue Million Forecast, by Country 2019 & 2032
- Table 10: Global InGaAs Camera Industry Volume K Unit Forecast, by Country 2019 & 2032
- Table 11: United States InGaAs Camera Industry Revenue (Million) Forecast, by Application 2019 & 2032
- Table 12: United States InGaAs Camera Industry Volume (K Unit) Forecast, by Application 2019 & 2032
- Table 13: Canada InGaAs Camera Industry Revenue (Million) Forecast, by Application 2019 & 2032
- Table 14: Canada InGaAs Camera Industry Volume (K Unit) Forecast, by Application 2019 & 2032
- Table 15: Mexico InGaAs Camera Industry Revenue (Million) Forecast, by Application 2019 & 2032
- Table 16: Mexico InGaAs Camera Industry Volume (K Unit) Forecast, by Application 2019 & 2032
- Table 17: Global InGaAs Camera Industry Revenue Million Forecast, by Country 2019 & 2032
- Table 18: Global InGaAs Camera Industry Volume K Unit Forecast, by Country 2019 & 2032
- Table 19: Germany InGaAs Camera Industry Revenue (Million) Forecast, by Application 2019 & 2032
- Table 20: Germany InGaAs Camera Industry Volume (K Unit) Forecast, by Application 2019 & 2032
- Table 21: United Kingdom InGaAs Camera Industry Revenue (Million) Forecast, by Application 2019 & 2032
- Table 22: United Kingdom InGaAs Camera Industry Volume (K Unit) Forecast, by Application 2019 & 2032
- Table 23: France InGaAs Camera Industry Revenue (Million) Forecast, by Application 2019 & 2032
- Table 24: France InGaAs Camera Industry Volume (K Unit) Forecast, by Application 2019 & 2032
- Table 25: Spain InGaAs Camera Industry Revenue (Million) Forecast, by Application 2019 & 2032
- Table 26: Spain InGaAs Camera Industry Volume (K Unit) Forecast, by Application 2019 & 2032
- Table 27: Italy InGaAs Camera Industry Revenue (Million) Forecast, by Application 2019 & 2032
- Table 28: Italy InGaAs Camera Industry Volume (K Unit) Forecast, by Application 2019 & 2032
- Table 29: Spain InGaAs Camera Industry Revenue (Million) Forecast, by Application 2019 & 2032
- Table 30: Spain InGaAs Camera Industry Volume (K Unit) Forecast, by Application 2019 & 2032
- Table 31: Belgium InGaAs Camera Industry Revenue (Million) Forecast, by Application 2019 & 2032
- Table 32: Belgium InGaAs Camera Industry Volume (K Unit) Forecast, by Application 2019 & 2032
- Table 33: Netherland InGaAs Camera Industry Revenue (Million) Forecast, by Application 2019 & 2032
- Table 34: Netherland InGaAs Camera Industry Volume (K Unit) Forecast, by Application 2019 & 2032
- Table 35: Nordics InGaAs Camera Industry Revenue (Million) Forecast, by Application 2019 & 2032
- Table 36: Nordics InGaAs Camera Industry Volume (K Unit) Forecast, by Application 2019 & 2032
- Table 37: Rest of Europe InGaAs Camera Industry Revenue (Million) Forecast, by Application 2019 & 2032
- Table 38: Rest of Europe InGaAs Camera Industry Volume (K Unit) Forecast, by Application 2019 & 2032
- Table 39: Global InGaAs Camera Industry Revenue Million Forecast, by Country 2019 & 2032
- Table 40: Global InGaAs Camera Industry Volume K Unit Forecast, by Country 2019 & 2032
- Table 41: China InGaAs Camera Industry Revenue (Million) Forecast, by Application 2019 & 2032
- Table 42: China InGaAs Camera Industry Volume (K Unit) Forecast, by Application 2019 & 2032
- Table 43: Japan InGaAs Camera Industry Revenue (Million) Forecast, by Application 2019 & 2032
- Table 44: Japan InGaAs Camera Industry Volume (K Unit) Forecast, by Application 2019 & 2032
- Table 45: India InGaAs Camera Industry Revenue (Million) Forecast, by Application 2019 & 2032
- Table 46: India InGaAs Camera Industry Volume (K Unit) Forecast, by Application 2019 & 2032
- Table 47: South Korea InGaAs Camera Industry Revenue (Million) Forecast, by Application 2019 & 2032
- Table 48: South Korea InGaAs Camera Industry Volume (K Unit) Forecast, by Application 2019 & 2032
- Table 49: Southeast Asia InGaAs Camera Industry Revenue (Million) Forecast, by Application 2019 & 2032
- Table 50: Southeast Asia InGaAs Camera Industry Volume (K Unit) Forecast, by Application 2019 & 2032
- Table 51: Australia InGaAs Camera Industry Revenue (Million) Forecast, by Application 2019 & 2032
- Table 52: Australia InGaAs Camera Industry Volume (K Unit) Forecast, by Application 2019 & 2032
- Table 53: Indonesia InGaAs Camera Industry Revenue (Million) Forecast, by Application 2019 & 2032
- Table 54: Indonesia InGaAs Camera Industry Volume (K Unit) Forecast, by Application 2019 & 2032
- Table 55: Phillipes InGaAs Camera Industry Revenue (Million) Forecast, by Application 2019 & 2032
- Table 56: Phillipes InGaAs Camera Industry Volume (K Unit) Forecast, by Application 2019 & 2032
- Table 57: Singapore InGaAs Camera Industry Revenue (Million) Forecast, by Application 2019 & 2032
- Table 58: Singapore InGaAs Camera Industry Volume (K Unit) Forecast, by Application 2019 & 2032
- Table 59: Thailandc InGaAs Camera Industry Revenue (Million) Forecast, by Application 2019 & 2032
- Table 60: Thailandc InGaAs Camera Industry Volume (K Unit) Forecast, by Application 2019 & 2032
- Table 61: Rest of Asia Pacific InGaAs Camera Industry Revenue (Million) Forecast, by Application 2019 & 2032
- Table 62: Rest of Asia Pacific InGaAs Camera Industry Volume (K Unit) Forecast, by Application 2019 & 2032
- Table 63: Global InGaAs Camera Industry Revenue Million Forecast, by Country 2019 & 2032
- Table 64: Global InGaAs Camera Industry Volume K Unit Forecast, by Country 2019 & 2032
- Table 65: Brazil InGaAs Camera Industry Revenue (Million) Forecast, by Application 2019 & 2032
- Table 66: Brazil InGaAs Camera Industry Volume (K Unit) Forecast, by Application 2019 & 2032
- Table 67: Argentina InGaAs Camera Industry Revenue (Million) Forecast, by Application 2019 & 2032
- Table 68: Argentina InGaAs Camera Industry Volume (K Unit) Forecast, by Application 2019 & 2032
- Table 69: Peru InGaAs Camera Industry Revenue (Million) Forecast, by Application 2019 & 2032
- Table 70: Peru InGaAs Camera Industry Volume (K Unit) Forecast, by Application 2019 & 2032
- Table 71: Chile InGaAs Camera Industry Revenue (Million) Forecast, by Application 2019 & 2032
- Table 72: Chile InGaAs Camera Industry Volume (K Unit) Forecast, by Application 2019 & 2032
- Table 73: Colombia InGaAs Camera Industry Revenue (Million) Forecast, by Application 2019 & 2032
- Table 74: Colombia InGaAs Camera Industry Volume (K Unit) Forecast, by Application 2019 & 2032
- Table 75: Ecuador InGaAs Camera Industry Revenue (Million) Forecast, by Application 2019 & 2032
- Table 76: Ecuador InGaAs Camera Industry Volume (K Unit) Forecast, by Application 2019 & 2032
- Table 77: Venezuela InGaAs Camera Industry Revenue (Million) Forecast, by Application 2019 & 2032
- Table 78: Venezuela InGaAs Camera Industry Volume (K Unit) Forecast, by Application 2019 & 2032
- Table 79: Rest of South America InGaAs Camera Industry Revenue (Million) Forecast, by Application 2019 & 2032
- Table 80: Rest of South America InGaAs Camera Industry Volume (K Unit) Forecast, by Application 2019 & 2032
- Table 81: Global InGaAs Camera Industry Revenue Million Forecast, by Country 2019 & 2032
- Table 82: Global InGaAs Camera Industry Volume K Unit Forecast, by Country 2019 & 2032
- Table 83: United States InGaAs Camera Industry Revenue (Million) Forecast, by Application 2019 & 2032
- Table 84: United States InGaAs Camera Industry Volume (K Unit) Forecast, by Application 2019 & 2032
- Table 85: Canada InGaAs Camera Industry Revenue (Million) Forecast, by Application 2019 & 2032
- Table 86: Canada InGaAs Camera Industry Volume (K Unit) Forecast, by Application 2019 & 2032
- Table 87: Mexico InGaAs Camera Industry Revenue (Million) Forecast, by Application 2019 & 2032
- Table 88: Mexico InGaAs Camera Industry Volume (K Unit) Forecast, by Application 2019 & 2032
- Table 89: Global InGaAs Camera Industry Revenue Million Forecast, by Country 2019 & 2032
- Table 90: Global InGaAs Camera Industry Volume K Unit Forecast, by Country 2019 & 2032
- Table 91: United Arab Emirates InGaAs Camera Industry Revenue (Million) Forecast, by Application 2019 & 2032
- Table 92: United Arab Emirates InGaAs Camera Industry Volume (K Unit) Forecast, by Application 2019 & 2032
- Table 93: Saudi Arabia InGaAs Camera Industry Revenue (Million) Forecast, by Application 2019 & 2032
- Table 94: Saudi Arabia InGaAs Camera Industry Volume (K Unit) Forecast, by Application 2019 & 2032
- Table 95: South Africa InGaAs Camera Industry Revenue (Million) Forecast, by Application 2019 & 2032
- Table 96: South Africa InGaAs Camera Industry Volume (K Unit) Forecast, by Application 2019 & 2032
- Table 97: Rest of Middle East and Africa InGaAs Camera Industry Revenue (Million) Forecast, by Application 2019 & 2032
- Table 98: Rest of Middle East and Africa InGaAs Camera Industry Volume (K Unit) Forecast, by Application 2019 & 2032
- Table 99: Global InGaAs Camera Industry Revenue Million Forecast, by Application 2019 & 2032
- Table 100: Global InGaAs Camera Industry Volume K Unit Forecast, by Application 2019 & 2032
- Table 101: Global InGaAs Camera Industry Revenue Million Forecast, by Region 2019 & 2032
- Table 102: Global InGaAs Camera Industry Volume K Unit Forecast, by Region 2019 & 2032
- Table 103: Global InGaAs Camera Industry Revenue Million Forecast, by Country 2019 & 2032
- Table 104: Global InGaAs Camera Industry Volume K Unit Forecast, by Country 2019 & 2032
- Table 105: United States InGaAs Camera Industry Revenue (Million) Forecast, by Application 2019 & 2032
- Table 106: United States InGaAs Camera Industry Volume (K Unit) Forecast, by Application 2019 & 2032
- Table 107: Canada InGaAs Camera Industry Revenue (Million) Forecast, by Application 2019 & 2032
- Table 108: Canada InGaAs Camera Industry Volume (K Unit) Forecast, by Application 2019 & 2032
- Table 109: Global InGaAs Camera Industry Revenue Million Forecast, by Application 2019 & 2032
- Table 110: Global InGaAs Camera Industry Volume K Unit Forecast, by Application 2019 & 2032
- Table 111: Global InGaAs Camera Industry Revenue Million Forecast, by Region 2019 & 2032
- Table 112: Global InGaAs Camera Industry Volume K Unit Forecast, by Region 2019 & 2032
- Table 113: Global InGaAs Camera Industry Revenue Million Forecast, by Country 2019 & 2032
- Table 114: Global InGaAs Camera Industry Volume K Unit Forecast, by Country 2019 & 2032
- Table 115: United Kingdom InGaAs Camera Industry Revenue (Million) Forecast, by Application 2019 & 2032
- Table 116: United Kingdom InGaAs Camera Industry Volume (K Unit) Forecast, by Application 2019 & 2032
- Table 117: Germany InGaAs Camera Industry Revenue (Million) Forecast, by Application 2019 & 2032
- Table 118: Germany InGaAs Camera Industry Volume (K Unit) Forecast, by Application 2019 & 2032
- Table 119: France InGaAs Camera Industry Revenue (Million) Forecast, by Application 2019 & 2032
- Table 120: France InGaAs Camera Industry Volume (K Unit) Forecast, by Application 2019 & 2032
- Table 121: Italy InGaAs Camera Industry Revenue (Million) Forecast, by Application 2019 & 2032
- Table 122: Italy InGaAs Camera Industry Volume (K Unit) Forecast, by Application 2019 & 2032
- Table 123: Global InGaAs Camera Industry Revenue Million Forecast, by Application 2019 & 2032
- Table 124: Global InGaAs Camera Industry Volume K Unit Forecast, by Application 2019 & 2032
- Table 125: Global InGaAs Camera Industry Revenue Million Forecast, by Region 2019 & 2032
- Table 126: Global InGaAs Camera Industry Volume K Unit Forecast, by Region 2019 & 2032
- Table 127: Global InGaAs Camera Industry Revenue Million Forecast, by Country 2019 & 2032
- Table 128: Global InGaAs Camera Industry Volume K Unit Forecast, by Country 2019 & 2032
- Table 129: China InGaAs Camera Industry Revenue (Million) Forecast, by Application 2019 & 2032
- Table 130: China InGaAs Camera Industry Volume (K Unit) Forecast, by Application 2019 & 2032
- Table 131: India InGaAs Camera Industry Revenue (Million) Forecast, by Application 2019 & 2032
- Table 132: India InGaAs Camera Industry Volume (K Unit) Forecast, by Application 2019 & 2032
- Table 133: Japan InGaAs Camera Industry Revenue (Million) Forecast, by Application 2019 & 2032
- Table 134: Japan InGaAs Camera Industry Volume (K Unit) Forecast, by Application 2019 & 2032
- Table 135: Australia and New Zealand InGaAs Camera Industry Revenue (Million) Forecast, by Application 2019 & 2032
- Table 136: Australia and New Zealand InGaAs Camera Industry Volume (K Unit) Forecast, by Application 2019 & 2032
- Table 137: South East Asia InGaAs Camera Industry Revenue (Million) Forecast, by Application 2019 & 2032
- Table 138: South East Asia InGaAs Camera Industry Volume (K Unit) Forecast, by Application 2019 & 2032
- Table 139: Global InGaAs Camera Industry Revenue Million Forecast, by Application 2019 & 2032
- Table 140: Global InGaAs Camera Industry Volume K Unit Forecast, by Application 2019 & 2032
- Table 141: Global InGaAs Camera Industry Revenue Million Forecast, by Region 2019 & 2032
- Table 142: Global InGaAs Camera Industry Volume K Unit Forecast, by Region 2019 & 2032
- Table 143: Global InGaAs Camera Industry Revenue Million Forecast, by Country 2019 & 2032
- Table 144: Global InGaAs Camera Industry Volume K Unit Forecast, by Country 2019 & 2032
- Table 145: Global InGaAs Camera Industry Revenue Million Forecast, by Application 2019 & 2032
- Table 146: Global InGaAs Camera Industry Volume K Unit Forecast, by Application 2019 & 2032
- Table 147: Global InGaAs Camera Industry Revenue Million Forecast, by Region 2019 & 2032
- Table 148: Global InGaAs Camera Industry Volume K Unit Forecast, by Region 2019 & 2032
- Table 149: Global InGaAs Camera Industry Revenue Million Forecast, by Country 2019 & 2032
- Table 150: Global InGaAs Camera Industry Volume K Unit Forecast, by Country 2019 & 2032
Frequently Asked Questions
1. What is the projected Compound Annual Growth Rate (CAGR) of the InGaAs Camera Industry?
The projected CAGR is approximately 12.81%.
2. Which companies are prominent players in the InGaAs Camera Industry?
Key companies in the market include Coherent Inc, Lambda Photometrics Ltd, FluxData Inc, Hamamatsu Photonics KK, Xenics Inc, Raptor Photonics Ltd, Specim Spectral Imaging Ltd, New Imaging Technologies, Allied Vision Technologies GmbH (TKH group), Flir Systems Inc, Sensors Unlimited (Collins Aerospace Company), Acal BFI Limited Company (Discoverie Group PLC).
3. What are the main segments of the InGaAs Camera Industry?
The market segments include Application, Region .
4. Can you provide details about the market size?
The market size is estimated to be USD 152.77 Million as of 2022.
5. What are some drivers contributing to market growth?
Increasing Adoption in Machine Vision Applications; Rising Demand in Military and Defense Operations.
6. What are the notable trends driving market growth?
Industrial Automation Expected to Occupy the Largest Market Share.
7. Are there any restraints impacting market growth?
Customized Demands by Drillers; Decline in Drilling Activities and Rig Counts.
8. Can you provide examples of recent developments in the market?
April 2022: 3D PLUS expanded its space camera head family by including a high-density, high-performance 1.31 Mpixels SWIR Camera Head for space applications. The 3DCM830 SWIR Space Camera Head embeds a SWIR InGaAs image sensor with associated memories and a high-performance FPGA-based electronic architecture, allowing for efficient sensor operation and the integration of image processing and formatting close to the image sensor.
9. What pricing options are available for accessing the report?
Pricing options include single-user, multi-user, and enterprise licenses priced at USD 4750, USD 5250, and USD 8750 respectively.
10. Is the market size provided in terms of value or volume?
The market size is provided in terms of value, measured in Million and volume, measured in K Unit.
11. Are there any specific market keywords associated with the report?
Yes, the market keyword associated with the report is "InGaAs Camera Industry," which aids in identifying and referencing the specific market segment covered.
12. How do I determine which pricing option suits my needs best?
The pricing options vary based on user requirements and access needs. Individual users may opt for single-user licenses, while businesses requiring broader access may choose multi-user or enterprise licenses for cost-effective access to the report.
13. Are there any additional resources or data provided in the InGaAs Camera Industry report?
While the report offers comprehensive insights, it's advisable to review the specific contents or supplementary materials provided to ascertain if additional resources or data are available.
14. How can I stay updated on further developments or reports in the InGaAs Camera Industry?
To stay informed about further developments, trends, and reports in the InGaAs Camera Industry, consider subscribing to industry newsletters, following relevant companies and organizations, or regularly checking reputable industry news sources and publications.
Methodology
Step 1 - Identification of Relevant Samples Size from Population Database


Step 2 - Approaches for Defining Global Market Size (Value, Volume* & Price*)

Note*: In applicable scenarios
Step 3 - Data Sources
Primary Research
- Web Analytics
- Survey Reports
- Research Institute
- Latest Research Reports
- Opinion Leaders
Secondary Research
- Annual Reports
- White Paper
- Latest Press Release
- Industry Association
- Paid Database
- Investor Presentations

Step 4 - Data Triangulation
Involves using different sources of information in order to increase the validity of a study
These sources are likely to be stakeholders in a program - participants, other researchers, program staff, other community members, and so on.
Then we put all data in single framework & apply various statistical tools to find out the dynamic on the market.
During the analysis stage, feedback from the stakeholder groups would be compared to determine areas of agreement as well as areas of divergence
