

Key Insights
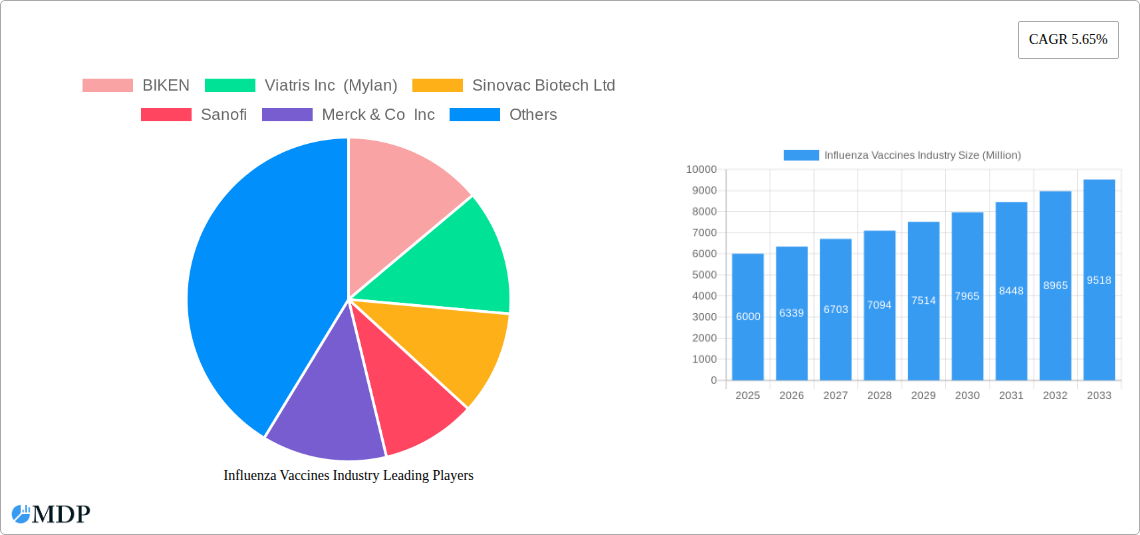
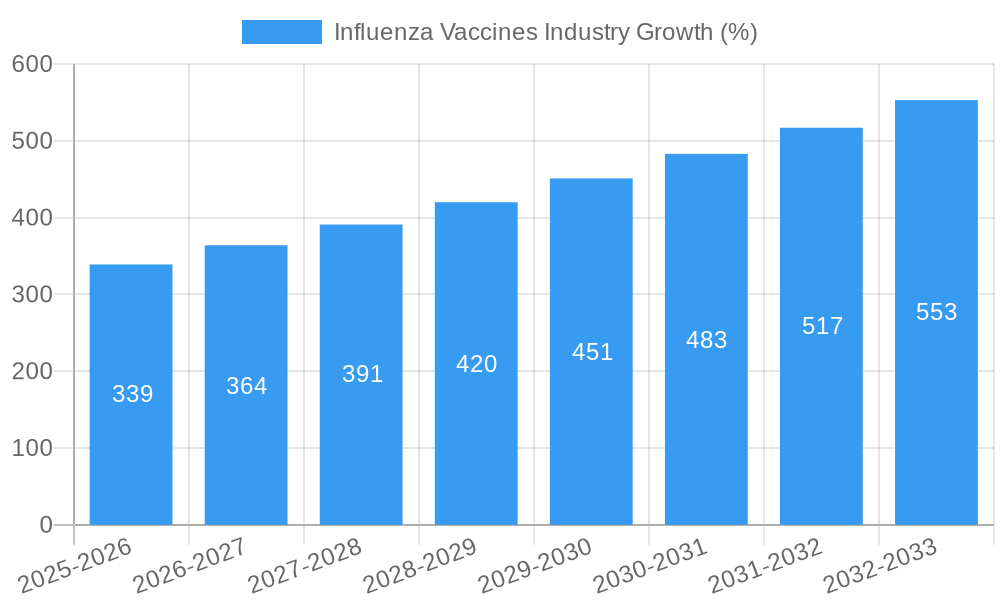
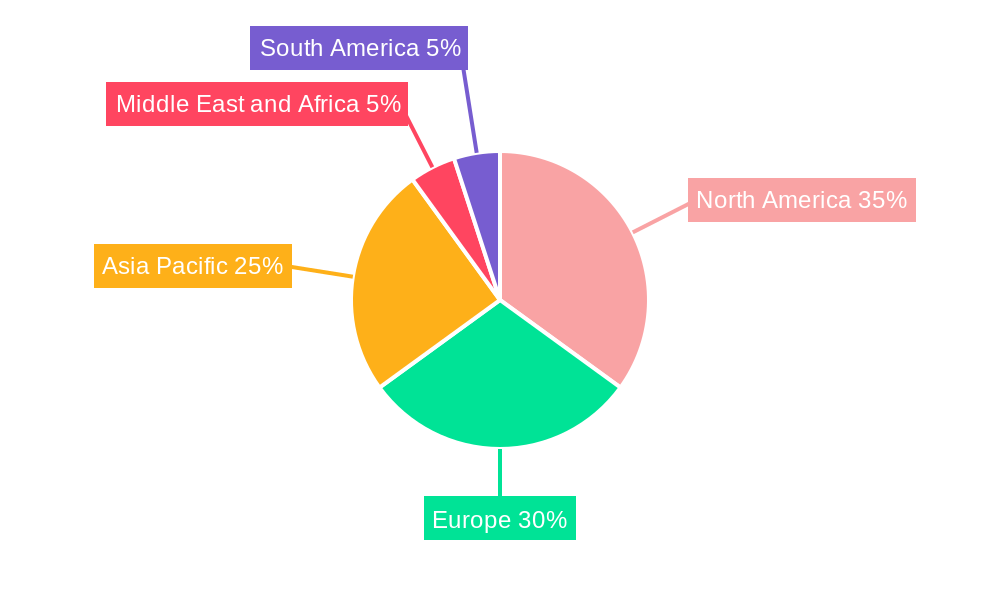
The global influenza vaccine market, valued at approximately $6 billion in 2025, is projected to experience robust growth, exhibiting a compound annual growth rate (CAGR) of 5.65% from 2025 to 2033. This expansion is driven by several key factors. Increasing geriatric populations globally represent a significant driver, as older adults are particularly susceptible to influenza complications and thus constitute a key target market for vaccination. Furthermore, heightened awareness of influenza's potential severity, coupled with proactive public health initiatives emphasizing preventative measures, fuels demand. Advancements in vaccine technology, such as the development of cell-based and quadrivalent vaccines offering broader protection, contribute significantly to market growth. The market is segmented by age group (pediatric and adult), route of administration (injection and nasal spray), vaccine type (quadrivalent and trivalent), and type (seasonal and pandemic). The injection route currently dominates, but nasal spray vaccines are gaining traction, especially in the pediatric segment. The increasing prevalence of multi-strain influenza viruses also drives the preference for quadrivalent vaccines over trivalent options. Geographic variations exist, with North America and Europe currently holding significant market shares, however, the Asia-Pacific region is poised for substantial growth due to rising disposable incomes and improving healthcare infrastructure.
Despite these positive factors, the market faces certain challenges. Production complexities and logistical hurdles associated with maintaining the cold chain for vaccine distribution can pose constraints, particularly in developing economies. Fluctuation in influenza virus strains and the need for annual vaccine updates to maintain efficacy can also impact market dynamics. Furthermore, vaccine hesitancy and anti-vaccine sentiment, although lessening in recent years, remain potential obstacles to market penetration. Competition among major pharmaceutical players like Pfizer, Sanofi, and GSK is intense, driving innovation and price competitiveness. The ongoing research and development efforts focusing on improved efficacy and novel delivery systems are expected to further shape market trajectory in the coming years, maintaining a positive growth outlook.
Influenza Vaccines Industry: A Comprehensive Market Report (2019-2033)
This comprehensive report provides an in-depth analysis of the global influenza vaccines industry, offering actionable insights for stakeholders across the value chain. With a study period spanning 2019-2033, a base year of 2025, and a forecast period of 2025-2033, this report leverages historical data (2019-2024) to project future market trends and opportunities. The analysis covers key segments including age groups (pediatric and adults), routes of administration (injection and nasal spray), vaccine types (quadrivalent and trivalent), vaccine classifications (seasonal and pandemic), and technologies (egg-based and cell-based). Leading players like Pfizer, Sanofi, Merck, and others are profiled, offering a granular understanding of market dynamics and competitive landscapes. The report's value is enhanced with specific data points and projections to minimize the need for any further modification.
Influenza Vaccines Industry Market Dynamics & Concentration
The global influenza vaccines market is characterized by a moderately concentrated landscape, with several large multinational pharmaceutical companies holding significant market share. Market concentration is expected to remain relatively stable during the forecast period, though strategic alliances and mergers & acquisitions (M&A) activity could impact the competitive dynamics. Innovation plays a crucial role, driving the development of novel vaccine technologies and formulations to improve efficacy, safety, and convenience. Regulatory frameworks, including stringent approval processes, significantly influence market entry and product lifecycle. The availability of product substitutes, such as antiviral medications, impacts market penetration. End-user trends, particularly increased awareness of influenza prevention and vaccination uptake, are key growth drivers.
- Market Share (2025 Estimate): Pfizer: xx%; Sanofi: xx%; Merck: xx%; Others: xx% (Total Market Value: $xx Million)
- M&A Activity (2019-2024): xx deals, primarily focused on technology licensing and smaller companies acquisitions.
Influenza Vaccines Industry Industry Trends & Analysis
The influenza vaccines market is experiencing robust growth, driven by several factors. The increasing prevalence of influenza outbreaks globally fuels demand, especially for seasonal vaccines. Technological advancements, including the development of cell-based and mRNA-based vaccines, are leading to improved vaccine efficacy and manufacturing processes. Consumer preferences are shifting towards higher-efficacy, quadrivalent vaccines, and convenient administration methods like pre-filled syringes. Competitive dynamics remain intense, with companies investing heavily in R&D to enhance their product portfolios and expand market share.
- CAGR (2025-2033): xx%
- Market Penetration (2025): xx% of the target population
Leading Markets & Segments in Influenza Vaccines Industry
The North American market currently dominates the global influenza vaccines industry, followed by Europe and Asia-Pacific. Within these regions, specific countries like the U.S., Japan, and Germany exhibit higher per capita vaccination rates.
Dominant Segments:
- Age Group: Adults represent the largest segment, but the pediatric segment is showing significant growth driven by increased vaccination recommendations.
- Route of Administration: Intramuscular injection remains the dominant route, although the nasal spray segment is experiencing gradual expansion, particularly in the pediatric population.
- Vaccine Type: Quadrivalent vaccines are gaining traction over trivalent vaccines due to their broader protection against influenza strains.
- Vaccine Type: Seasonal vaccines constitute the largest share, while the pandemic vaccine segment's size fluctuates based on global health emergencies.
- Technology: Egg-based technology remains the dominant production method; however, cell-based technology is gaining momentum due to its potential for improved production efficiency and reduced risks.
Key Drivers: Strong healthcare infrastructure, high awareness of influenza prevention, favorable government policies supporting vaccination programs, robust healthcare spending, and advanced research capabilities.
Influenza Vaccines Industry Product Developments
Recent product innovations focus on enhancing vaccine efficacy, safety, and manufacturing processes. Companies are developing novel vaccine platforms, such as cell-based and mRNA technologies, to address limitations of traditional egg-based vaccines. These advancements aim to improve the speed and efficiency of vaccine production and reduce the risk of egg-related side effects. This is leading to higher efficacy vaccines with better tolerability and enhanced shelf-life. The market is seeing the introduction of pre-filled syringes, improving ease of administration and reducing wastage.
Key Drivers of Influenza Vaccines Industry Growth
Several factors are driving growth in the influenza vaccine industry:
- Rising prevalence of influenza: Increased incidence of influenza infections globally fuels demand for vaccines.
- Technological advancements: Development of cell-based and mRNA vaccines enhances efficacy and production efficiency.
- Government initiatives: Public health programs supporting influenza vaccination increase vaccine uptake.
- Growing awareness: Increased public awareness about the benefits of vaccination boosts demand.
Challenges in the Influenza Vaccines Industry Market
The industry faces several challenges:
- Regulatory hurdles: Stringent approval processes and evolving regulatory guidelines increase development costs and timelines.
- Supply chain disruptions: Global supply chain issues can impact vaccine production and distribution.
- Price competition: Intense competition among manufacturers may exert downward pressure on prices.
- Vaccine hesitancy: Concerns about vaccine safety and efficacy can hinder vaccine uptake.
Emerging Opportunities in Influenza Vaccines Industry
Emerging opportunities lie in developing advanced vaccine technologies, including mRNA and next-generation adjuvants. Strategic partnerships and collaborations between pharmaceutical companies and research institutions are paving the way for innovative vaccine platforms. Expansion into emerging markets with high unmet needs represents a significant growth potential.
Leading Players in the Influenza Vaccines Industry Sector
- BIKEN
- Viatris Inc (Mylan)
- Sinovac Biotech Ltd
- Sanofi
- Merck & Co Inc
- AstraZeneca PLC
- Abbott Laboratories
- CSL Limited
- Gamma Vaccines Pvt Ltd
- Emergent BioSolutions
- GlaxoSmithKline PLC
- Pfizer Inc
Key Milestones in Influenza Vaccines Industry Industry
- March 2022: Sanofi launched Fluzone, a high-dose influenza vaccine offering protection against four strains in Australia.
- September 2022: Pfizer initiated a Phase 3 clinical trial for its quadrivalent modified RNA influenza vaccine candidate.
Strategic Outlook for Influenza Vaccines Industry Market
The influenza vaccines market is poised for significant growth driven by technological advancements, increased vaccination rates, and expanded market access in emerging economies. Strategic partnerships, investments in R&D, and product diversification will be critical for companies to maintain their competitive edge and capitalize on the industry's future potential. The development of universal influenza vaccines represents a major long-term opportunity, offering the potential for broader protection against a wider range of influenza strains.
Influenza Vaccines Industry Segmentation
-
1. Vaccine Type
- 1.1. Quadrivalent
- 1.2. Trivalent
-
2. Type
- 2.1. Seasonal
- 2.2. Pandemic
-
3. Technology
- 3.1. Egg-based
- 3.2. Cell-based
-
4. Age Group
- 4.1. Pediatric
- 4.2. Adults
-
5. Route of Administration
- 5.1. Injection
- 5.2. Nasal Spray
Influenza Vaccines Industry Segmentation By Geography
-
1. North America
- 1.1. United States
- 1.2. Canada
- 1.3. Mexico
-
2. Europe
- 2.1. Germany
- 2.2. United Kingdom
- 2.3. France
- 2.4. Spain
- 2.5. Italy
- 2.6. Rest of Europe
-
3. Asia Pacific
- 3.1. China
- 3.2. Japan
- 3.3. India
- 3.4. Austalia
- 3.5. South Korea
- 3.6. Rest of Asia Pacific
-
4. Middle East and Africa
- 4.1. GCC
- 4.2. South Africa
- 4.3. Rest of Middle East and Africa
-
5. South America
- 5.1. Brazil
- 5.2. Argentina
- 5.3. Rest of South America
Influenza Vaccines Industry REPORT HIGHLIGHTS
| Aspects | Details |
|---|---|
| Study Period | 2019-2033 |
| Base Year | 2024 |
| Estimated Year | 2025 |
| Forecast Period | 2025-2033 |
| Historical Period | 2019-2024 |
| Growth Rate | CAGR of 5.65% from 2019-2033 |
| Segmentation |
|
Table of Contents
- 1. Introduction
- 1.1. Research Scope
- 1.2. Market Segmentation
- 1.3. Research Methodology
- 1.4. Definitions and Assumptions
- 2. Executive Summary
- 2.1. Introduction
- 3. Market Dynamics
- 3.1. Introduction
- 3.2. Market Drivers
- 3.2.1. Rising Government Initiatives for Spreading Awareness; Continuous Advancement in Developing New Vaccines
- 3.3. Market Restrains
- 3.3.1. Requires High R&D Budget; Longer Timeline Required for New Vaccines
- 3.4. Market Trends
- 3.4.1. The Quadrivalent Segment is Expected to Hold a Major Share in the Market over the Forecast Period
- 4. Market Factor Analysis
- 4.1. Porters Five Forces
- 4.2. Supply/Value Chain
- 4.3. PESTEL analysis
- 4.4. Market Entropy
- 4.5. Patent/Trademark Analysis
- 5. Global Influenza Vaccines Industry Analysis, Insights and Forecast, 2019-2031
- 5.1. Market Analysis, Insights and Forecast - by Vaccine Type
- 5.1.1. Quadrivalent
- 5.1.2. Trivalent
- 5.2. Market Analysis, Insights and Forecast - by Type
- 5.2.1. Seasonal
- 5.2.2. Pandemic
- 5.3. Market Analysis, Insights and Forecast - by Technology
- 5.3.1. Egg-based
- 5.3.2. Cell-based
- 5.4. Market Analysis, Insights and Forecast - by Age Group
- 5.4.1. Pediatric
- 5.4.2. Adults
- 5.5. Market Analysis, Insights and Forecast - by Route of Administration
- 5.5.1. Injection
- 5.5.2. Nasal Spray
- 5.6. Market Analysis, Insights and Forecast - by Region
- 5.6.1. North America
- 5.6.2. Europe
- 5.6.3. Asia Pacific
- 5.6.4. Middle East and Africa
- 5.6.5. South America
- 5.1. Market Analysis, Insights and Forecast - by Vaccine Type
- 6. North America Influenza Vaccines Industry Analysis, Insights and Forecast, 2019-2031
- 6.1. Market Analysis, Insights and Forecast - by Vaccine Type
- 6.1.1. Quadrivalent
- 6.1.2. Trivalent
- 6.2. Market Analysis, Insights and Forecast - by Type
- 6.2.1. Seasonal
- 6.2.2. Pandemic
- 6.3. Market Analysis, Insights and Forecast - by Technology
- 6.3.1. Egg-based
- 6.3.2. Cell-based
- 6.4. Market Analysis, Insights and Forecast - by Age Group
- 6.4.1. Pediatric
- 6.4.2. Adults
- 6.5. Market Analysis, Insights and Forecast - by Route of Administration
- 6.5.1. Injection
- 6.5.2. Nasal Spray
- 6.1. Market Analysis, Insights and Forecast - by Vaccine Type
- 7. Europe Influenza Vaccines Industry Analysis, Insights and Forecast, 2019-2031
- 7.1. Market Analysis, Insights and Forecast - by Vaccine Type
- 7.1.1. Quadrivalent
- 7.1.2. Trivalent
- 7.2. Market Analysis, Insights and Forecast - by Type
- 7.2.1. Seasonal
- 7.2.2. Pandemic
- 7.3. Market Analysis, Insights and Forecast - by Technology
- 7.3.1. Egg-based
- 7.3.2. Cell-based
- 7.4. Market Analysis, Insights and Forecast - by Age Group
- 7.4.1. Pediatric
- 7.4.2. Adults
- 7.5. Market Analysis, Insights and Forecast - by Route of Administration
- 7.5.1. Injection
- 7.5.2. Nasal Spray
- 7.1. Market Analysis, Insights and Forecast - by Vaccine Type
- 8. Asia Pacific Influenza Vaccines Industry Analysis, Insights and Forecast, 2019-2031
- 8.1. Market Analysis, Insights and Forecast - by Vaccine Type
- 8.1.1. Quadrivalent
- 8.1.2. Trivalent
- 8.2. Market Analysis, Insights and Forecast - by Type
- 8.2.1. Seasonal
- 8.2.2. Pandemic
- 8.3. Market Analysis, Insights and Forecast - by Technology
- 8.3.1. Egg-based
- 8.3.2. Cell-based
- 8.4. Market Analysis, Insights and Forecast - by Age Group
- 8.4.1. Pediatric
- 8.4.2. Adults
- 8.5. Market Analysis, Insights and Forecast - by Route of Administration
- 8.5.1. Injection
- 8.5.2. Nasal Spray
- 8.1. Market Analysis, Insights and Forecast - by Vaccine Type
- 9. Middle East and Africa Influenza Vaccines Industry Analysis, Insights and Forecast, 2019-2031
- 9.1. Market Analysis, Insights and Forecast - by Vaccine Type
- 9.1.1. Quadrivalent
- 9.1.2. Trivalent
- 9.2. Market Analysis, Insights and Forecast - by Type
- 9.2.1. Seasonal
- 9.2.2. Pandemic
- 9.3. Market Analysis, Insights and Forecast - by Technology
- 9.3.1. Egg-based
- 9.3.2. Cell-based
- 9.4. Market Analysis, Insights and Forecast - by Age Group
- 9.4.1. Pediatric
- 9.4.2. Adults
- 9.5. Market Analysis, Insights and Forecast - by Route of Administration
- 9.5.1. Injection
- 9.5.2. Nasal Spray
- 9.1. Market Analysis, Insights and Forecast - by Vaccine Type
- 10. South America Influenza Vaccines Industry Analysis, Insights and Forecast, 2019-2031
- 10.1. Market Analysis, Insights and Forecast - by Vaccine Type
- 10.1.1. Quadrivalent
- 10.1.2. Trivalent
- 10.2. Market Analysis, Insights and Forecast - by Type
- 10.2.1. Seasonal
- 10.2.2. Pandemic
- 10.3. Market Analysis, Insights and Forecast - by Technology
- 10.3.1. Egg-based
- 10.3.2. Cell-based
- 10.4. Market Analysis, Insights and Forecast - by Age Group
- 10.4.1. Pediatric
- 10.4.2. Adults
- 10.5. Market Analysis, Insights and Forecast - by Route of Administration
- 10.5.1. Injection
- 10.5.2. Nasal Spray
- 10.1. Market Analysis, Insights and Forecast - by Vaccine Type
- 11. North America Influenza Vaccines Industry Analysis, Insights and Forecast, 2019-2031
- 11.1. Market Analysis, Insights and Forecast - By Country/Sub-region
- 11.1.1. undefined
- 12. Europe Influenza Vaccines Industry Analysis, Insights and Forecast, 2019-2031
- 12.1. Market Analysis, Insights and Forecast - By Country/Sub-region
- 12.1.1. undefined
- 13. Asia Pacific Influenza Vaccines Industry Analysis, Insights and Forecast, 2019-2031
- 13.1. Market Analysis, Insights and Forecast - By Country/Sub-region
- 13.1.1. undefined
- 14. Middle East and Africa Influenza Vaccines Industry Analysis, Insights and Forecast, 2019-2031
- 14.1. Market Analysis, Insights and Forecast - By Country/Sub-region
- 14.1.1. undefined
- 15. South America Influenza Vaccines Industry Analysis, Insights and Forecast, 2019-2031
- 15.1. Market Analysis, Insights and Forecast - By Country/Sub-region
- 15.1.1. undefined
- 16. Competitive Analysis
- 16.1. Global Market Share Analysis 2024
- 16.2. Company Profiles
- 16.2.1 BIKEN
- 16.2.1.1. Overview
- 16.2.1.2. Products
- 16.2.1.3. SWOT Analysis
- 16.2.1.4. Recent Developments
- 16.2.1.5. Financials (Based on Availability)
- 16.2.2 Viatris Inc (Mylan)
- 16.2.2.1. Overview
- 16.2.2.2. Products
- 16.2.2.3. SWOT Analysis
- 16.2.2.4. Recent Developments
- 16.2.2.5. Financials (Based on Availability)
- 16.2.3 Sinovac Biotech Ltd
- 16.2.3.1. Overview
- 16.2.3.2. Products
- 16.2.3.3. SWOT Analysis
- 16.2.3.4. Recent Developments
- 16.2.3.5. Financials (Based on Availability)
- 16.2.4 Sanofi
- 16.2.4.1. Overview
- 16.2.4.2. Products
- 16.2.4.3. SWOT Analysis
- 16.2.4.4. Recent Developments
- 16.2.4.5. Financials (Based on Availability)
- 16.2.5 Merck & Co Inc
- 16.2.5.1. Overview
- 16.2.5.2. Products
- 16.2.5.3. SWOT Analysis
- 16.2.5.4. Recent Developments
- 16.2.5.5. Financials (Based on Availability)
- 16.2.6 AstraZeneca PLC
- 16.2.6.1. Overview
- 16.2.6.2. Products
- 16.2.6.3. SWOT Analysis
- 16.2.6.4. Recent Developments
- 16.2.6.5. Financials (Based on Availability)
- 16.2.7 Abbott Laboratories
- 16.2.7.1. Overview
- 16.2.7.2. Products
- 16.2.7.3. SWOT Analysis
- 16.2.7.4. Recent Developments
- 16.2.7.5. Financials (Based on Availability)
- 16.2.8 CSL Limited
- 16.2.8.1. Overview
- 16.2.8.2. Products
- 16.2.8.3. SWOT Analysis
- 16.2.8.4. Recent Developments
- 16.2.8.5. Financials (Based on Availability)
- 16.2.9 Gamma Vaccines Pvt Ltd
- 16.2.9.1. Overview
- 16.2.9.2. Products
- 16.2.9.3. SWOT Analysis
- 16.2.9.4. Recent Developments
- 16.2.9.5. Financials (Based on Availability)
- 16.2.10 Emergent BioSolutions
- 16.2.10.1. Overview
- 16.2.10.2. Products
- 16.2.10.3. SWOT Analysis
- 16.2.10.4. Recent Developments
- 16.2.10.5. Financials (Based on Availability)
- 16.2.11 GlaxoSmithKline PLC
- 16.2.11.1. Overview
- 16.2.11.2. Products
- 16.2.11.3. SWOT Analysis
- 16.2.11.4. Recent Developments
- 16.2.11.5. Financials (Based on Availability)
- 16.2.12 Pfizer Inc
- 16.2.12.1. Overview
- 16.2.12.2. Products
- 16.2.12.3. SWOT Analysis
- 16.2.12.4. Recent Developments
- 16.2.12.5. Financials (Based on Availability)
- 16.2.1 BIKEN
List of Figures
- Figure 1: Global Influenza Vaccines Industry Revenue Breakdown (Million, %) by Region 2024 & 2032
- Figure 2: Global Influenza Vaccines Industry Volume Breakdown (K Unit, %) by Region 2024 & 2032
- Figure 3: North America Influenza Vaccines Industry Revenue (Million), by Country 2024 & 2032
- Figure 4: North America Influenza Vaccines Industry Volume (K Unit), by Country 2024 & 2032
- Figure 5: North America Influenza Vaccines Industry Revenue Share (%), by Country 2024 & 2032
- Figure 6: North America Influenza Vaccines Industry Volume Share (%), by Country 2024 & 2032
- Figure 7: Europe Influenza Vaccines Industry Revenue (Million), by Country 2024 & 2032
- Figure 8: Europe Influenza Vaccines Industry Volume (K Unit), by Country 2024 & 2032
- Figure 9: Europe Influenza Vaccines Industry Revenue Share (%), by Country 2024 & 2032
- Figure 10: Europe Influenza Vaccines Industry Volume Share (%), by Country 2024 & 2032
- Figure 11: Asia Pacific Influenza Vaccines Industry Revenue (Million), by Country 2024 & 2032
- Figure 12: Asia Pacific Influenza Vaccines Industry Volume (K Unit), by Country 2024 & 2032
- Figure 13: Asia Pacific Influenza Vaccines Industry Revenue Share (%), by Country 2024 & 2032
- Figure 14: Asia Pacific Influenza Vaccines Industry Volume Share (%), by Country 2024 & 2032
- Figure 15: Middle East and Africa Influenza Vaccines Industry Revenue (Million), by Country 2024 & 2032
- Figure 16: Middle East and Africa Influenza Vaccines Industry Volume (K Unit), by Country 2024 & 2032
- Figure 17: Middle East and Africa Influenza Vaccines Industry Revenue Share (%), by Country 2024 & 2032
- Figure 18: Middle East and Africa Influenza Vaccines Industry Volume Share (%), by Country 2024 & 2032
- Figure 19: South America Influenza Vaccines Industry Revenue (Million), by Country 2024 & 2032
- Figure 20: South America Influenza Vaccines Industry Volume (K Unit), by Country 2024 & 2032
- Figure 21: South America Influenza Vaccines Industry Revenue Share (%), by Country 2024 & 2032
- Figure 22: South America Influenza Vaccines Industry Volume Share (%), by Country 2024 & 2032
- Figure 23: North America Influenza Vaccines Industry Revenue (Million), by Vaccine Type 2024 & 2032
- Figure 24: North America Influenza Vaccines Industry Volume (K Unit), by Vaccine Type 2024 & 2032
- Figure 25: North America Influenza Vaccines Industry Revenue Share (%), by Vaccine Type 2024 & 2032
- Figure 26: North America Influenza Vaccines Industry Volume Share (%), by Vaccine Type 2024 & 2032
- Figure 27: North America Influenza Vaccines Industry Revenue (Million), by Type 2024 & 2032
- Figure 28: North America Influenza Vaccines Industry Volume (K Unit), by Type 2024 & 2032
- Figure 29: North America Influenza Vaccines Industry Revenue Share (%), by Type 2024 & 2032
- Figure 30: North America Influenza Vaccines Industry Volume Share (%), by Type 2024 & 2032
- Figure 31: North America Influenza Vaccines Industry Revenue (Million), by Technology 2024 & 2032
- Figure 32: North America Influenza Vaccines Industry Volume (K Unit), by Technology 2024 & 2032
- Figure 33: North America Influenza Vaccines Industry Revenue Share (%), by Technology 2024 & 2032
- Figure 34: North America Influenza Vaccines Industry Volume Share (%), by Technology 2024 & 2032
- Figure 35: North America Influenza Vaccines Industry Revenue (Million), by Age Group 2024 & 2032
- Figure 36: North America Influenza Vaccines Industry Volume (K Unit), by Age Group 2024 & 2032
- Figure 37: North America Influenza Vaccines Industry Revenue Share (%), by Age Group 2024 & 2032
- Figure 38: North America Influenza Vaccines Industry Volume Share (%), by Age Group 2024 & 2032
- Figure 39: North America Influenza Vaccines Industry Revenue (Million), by Route of Administration 2024 & 2032
- Figure 40: North America Influenza Vaccines Industry Volume (K Unit), by Route of Administration 2024 & 2032
- Figure 41: North America Influenza Vaccines Industry Revenue Share (%), by Route of Administration 2024 & 2032
- Figure 42: North America Influenza Vaccines Industry Volume Share (%), by Route of Administration 2024 & 2032
- Figure 43: North America Influenza Vaccines Industry Revenue (Million), by Country 2024 & 2032
- Figure 44: North America Influenza Vaccines Industry Volume (K Unit), by Country 2024 & 2032
- Figure 45: North America Influenza Vaccines Industry Revenue Share (%), by Country 2024 & 2032
- Figure 46: North America Influenza Vaccines Industry Volume Share (%), by Country 2024 & 2032
- Figure 47: Europe Influenza Vaccines Industry Revenue (Million), by Vaccine Type 2024 & 2032
- Figure 48: Europe Influenza Vaccines Industry Volume (K Unit), by Vaccine Type 2024 & 2032
- Figure 49: Europe Influenza Vaccines Industry Revenue Share (%), by Vaccine Type 2024 & 2032
- Figure 50: Europe Influenza Vaccines Industry Volume Share (%), by Vaccine Type 2024 & 2032
- Figure 51: Europe Influenza Vaccines Industry Revenue (Million), by Type 2024 & 2032
- Figure 52: Europe Influenza Vaccines Industry Volume (K Unit), by Type 2024 & 2032
- Figure 53: Europe Influenza Vaccines Industry Revenue Share (%), by Type 2024 & 2032
- Figure 54: Europe Influenza Vaccines Industry Volume Share (%), by Type 2024 & 2032
- Figure 55: Europe Influenza Vaccines Industry Revenue (Million), by Technology 2024 & 2032
- Figure 56: Europe Influenza Vaccines Industry Volume (K Unit), by Technology 2024 & 2032
- Figure 57: Europe Influenza Vaccines Industry Revenue Share (%), by Technology 2024 & 2032
- Figure 58: Europe Influenza Vaccines Industry Volume Share (%), by Technology 2024 & 2032
- Figure 59: Europe Influenza Vaccines Industry Revenue (Million), by Age Group 2024 & 2032
- Figure 60: Europe Influenza Vaccines Industry Volume (K Unit), by Age Group 2024 & 2032
- Figure 61: Europe Influenza Vaccines Industry Revenue Share (%), by Age Group 2024 & 2032
- Figure 62: Europe Influenza Vaccines Industry Volume Share (%), by Age Group 2024 & 2032
- Figure 63: Europe Influenza Vaccines Industry Revenue (Million), by Route of Administration 2024 & 2032
- Figure 64: Europe Influenza Vaccines Industry Volume (K Unit), by Route of Administration 2024 & 2032
- Figure 65: Europe Influenza Vaccines Industry Revenue Share (%), by Route of Administration 2024 & 2032
- Figure 66: Europe Influenza Vaccines Industry Volume Share (%), by Route of Administration 2024 & 2032
- Figure 67: Europe Influenza Vaccines Industry Revenue (Million), by Country 2024 & 2032
- Figure 68: Europe Influenza Vaccines Industry Volume (K Unit), by Country 2024 & 2032
- Figure 69: Europe Influenza Vaccines Industry Revenue Share (%), by Country 2024 & 2032
- Figure 70: Europe Influenza Vaccines Industry Volume Share (%), by Country 2024 & 2032
- Figure 71: Asia Pacific Influenza Vaccines Industry Revenue (Million), by Vaccine Type 2024 & 2032
- Figure 72: Asia Pacific Influenza Vaccines Industry Volume (K Unit), by Vaccine Type 2024 & 2032
- Figure 73: Asia Pacific Influenza Vaccines Industry Revenue Share (%), by Vaccine Type 2024 & 2032
- Figure 74: Asia Pacific Influenza Vaccines Industry Volume Share (%), by Vaccine Type 2024 & 2032
- Figure 75: Asia Pacific Influenza Vaccines Industry Revenue (Million), by Type 2024 & 2032
- Figure 76: Asia Pacific Influenza Vaccines Industry Volume (K Unit), by Type 2024 & 2032
- Figure 77: Asia Pacific Influenza Vaccines Industry Revenue Share (%), by Type 2024 & 2032
- Figure 78: Asia Pacific Influenza Vaccines Industry Volume Share (%), by Type 2024 & 2032
- Figure 79: Asia Pacific Influenza Vaccines Industry Revenue (Million), by Technology 2024 & 2032
- Figure 80: Asia Pacific Influenza Vaccines Industry Volume (K Unit), by Technology 2024 & 2032
- Figure 81: Asia Pacific Influenza Vaccines Industry Revenue Share (%), by Technology 2024 & 2032
- Figure 82: Asia Pacific Influenza Vaccines Industry Volume Share (%), by Technology 2024 & 2032
- Figure 83: Asia Pacific Influenza Vaccines Industry Revenue (Million), by Age Group 2024 & 2032
- Figure 84: Asia Pacific Influenza Vaccines Industry Volume (K Unit), by Age Group 2024 & 2032
- Figure 85: Asia Pacific Influenza Vaccines Industry Revenue Share (%), by Age Group 2024 & 2032
- Figure 86: Asia Pacific Influenza Vaccines Industry Volume Share (%), by Age Group 2024 & 2032
- Figure 87: Asia Pacific Influenza Vaccines Industry Revenue (Million), by Route of Administration 2024 & 2032
- Figure 88: Asia Pacific Influenza Vaccines Industry Volume (K Unit), by Route of Administration 2024 & 2032
- Figure 89: Asia Pacific Influenza Vaccines Industry Revenue Share (%), by Route of Administration 2024 & 2032
- Figure 90: Asia Pacific Influenza Vaccines Industry Volume Share (%), by Route of Administration 2024 & 2032
- Figure 91: Asia Pacific Influenza Vaccines Industry Revenue (Million), by Country 2024 & 2032
- Figure 92: Asia Pacific Influenza Vaccines Industry Volume (K Unit), by Country 2024 & 2032
- Figure 93: Asia Pacific Influenza Vaccines Industry Revenue Share (%), by Country 2024 & 2032
- Figure 94: Asia Pacific Influenza Vaccines Industry Volume Share (%), by Country 2024 & 2032
- Figure 95: Middle East and Africa Influenza Vaccines Industry Revenue (Million), by Vaccine Type 2024 & 2032
- Figure 96: Middle East and Africa Influenza Vaccines Industry Volume (K Unit), by Vaccine Type 2024 & 2032
- Figure 97: Middle East and Africa Influenza Vaccines Industry Revenue Share (%), by Vaccine Type 2024 & 2032
- Figure 98: Middle East and Africa Influenza Vaccines Industry Volume Share (%), by Vaccine Type 2024 & 2032
- Figure 99: Middle East and Africa Influenza Vaccines Industry Revenue (Million), by Type 2024 & 2032
- Figure 100: Middle East and Africa Influenza Vaccines Industry Volume (K Unit), by Type 2024 & 2032
- Figure 101: Middle East and Africa Influenza Vaccines Industry Revenue Share (%), by Type 2024 & 2032
- Figure 102: Middle East and Africa Influenza Vaccines Industry Volume Share (%), by Type 2024 & 2032
- Figure 103: Middle East and Africa Influenza Vaccines Industry Revenue (Million), by Technology 2024 & 2032
- Figure 104: Middle East and Africa Influenza Vaccines Industry Volume (K Unit), by Technology 2024 & 2032
- Figure 105: Middle East and Africa Influenza Vaccines Industry Revenue Share (%), by Technology 2024 & 2032
- Figure 106: Middle East and Africa Influenza Vaccines Industry Volume Share (%), by Technology 2024 & 2032
- Figure 107: Middle East and Africa Influenza Vaccines Industry Revenue (Million), by Age Group 2024 & 2032
- Figure 108: Middle East and Africa Influenza Vaccines Industry Volume (K Unit), by Age Group 2024 & 2032
- Figure 109: Middle East and Africa Influenza Vaccines Industry Revenue Share (%), by Age Group 2024 & 2032
- Figure 110: Middle East and Africa Influenza Vaccines Industry Volume Share (%), by Age Group 2024 & 2032
- Figure 111: Middle East and Africa Influenza Vaccines Industry Revenue (Million), by Route of Administration 2024 & 2032
- Figure 112: Middle East and Africa Influenza Vaccines Industry Volume (K Unit), by Route of Administration 2024 & 2032
- Figure 113: Middle East and Africa Influenza Vaccines Industry Revenue Share (%), by Route of Administration 2024 & 2032
- Figure 114: Middle East and Africa Influenza Vaccines Industry Volume Share (%), by Route of Administration 2024 & 2032
- Figure 115: Middle East and Africa Influenza Vaccines Industry Revenue (Million), by Country 2024 & 2032
- Figure 116: Middle East and Africa Influenza Vaccines Industry Volume (K Unit), by Country 2024 & 2032
- Figure 117: Middle East and Africa Influenza Vaccines Industry Revenue Share (%), by Country 2024 & 2032
- Figure 118: Middle East and Africa Influenza Vaccines Industry Volume Share (%), by Country 2024 & 2032
- Figure 119: South America Influenza Vaccines Industry Revenue (Million), by Vaccine Type 2024 & 2032
- Figure 120: South America Influenza Vaccines Industry Volume (K Unit), by Vaccine Type 2024 & 2032
- Figure 121: South America Influenza Vaccines Industry Revenue Share (%), by Vaccine Type 2024 & 2032
- Figure 122: South America Influenza Vaccines Industry Volume Share (%), by Vaccine Type 2024 & 2032
- Figure 123: South America Influenza Vaccines Industry Revenue (Million), by Type 2024 & 2032
- Figure 124: South America Influenza Vaccines Industry Volume (K Unit), by Type 2024 & 2032
- Figure 125: South America Influenza Vaccines Industry Revenue Share (%), by Type 2024 & 2032
- Figure 126: South America Influenza Vaccines Industry Volume Share (%), by Type 2024 & 2032
- Figure 127: South America Influenza Vaccines Industry Revenue (Million), by Technology 2024 & 2032
- Figure 128: South America Influenza Vaccines Industry Volume (K Unit), by Technology 2024 & 2032
- Figure 129: South America Influenza Vaccines Industry Revenue Share (%), by Technology 2024 & 2032
- Figure 130: South America Influenza Vaccines Industry Volume Share (%), by Technology 2024 & 2032
- Figure 131: South America Influenza Vaccines Industry Revenue (Million), by Age Group 2024 & 2032
- Figure 132: South America Influenza Vaccines Industry Volume (K Unit), by Age Group 2024 & 2032
- Figure 133: South America Influenza Vaccines Industry Revenue Share (%), by Age Group 2024 & 2032
- Figure 134: South America Influenza Vaccines Industry Volume Share (%), by Age Group 2024 & 2032
- Figure 135: South America Influenza Vaccines Industry Revenue (Million), by Route of Administration 2024 & 2032
- Figure 136: South America Influenza Vaccines Industry Volume (K Unit), by Route of Administration 2024 & 2032
- Figure 137: South America Influenza Vaccines Industry Revenue Share (%), by Route of Administration 2024 & 2032
- Figure 138: South America Influenza Vaccines Industry Volume Share (%), by Route of Administration 2024 & 2032
- Figure 139: South America Influenza Vaccines Industry Revenue (Million), by Country 2024 & 2032
- Figure 140: South America Influenza Vaccines Industry Volume (K Unit), by Country 2024 & 2032
- Figure 141: South America Influenza Vaccines Industry Revenue Share (%), by Country 2024 & 2032
- Figure 142: South America Influenza Vaccines Industry Volume Share (%), by Country 2024 & 2032
List of Tables
- Table 1: Global Influenza Vaccines Industry Revenue Million Forecast, by Region 2019 & 2032
- Table 2: Global Influenza Vaccines Industry Volume K Unit Forecast, by Region 2019 & 2032
- Table 3: Global Influenza Vaccines Industry Revenue Million Forecast, by Vaccine Type 2019 & 2032
- Table 4: Global Influenza Vaccines Industry Volume K Unit Forecast, by Vaccine Type 2019 & 2032
- Table 5: Global Influenza Vaccines Industry Revenue Million Forecast, by Type 2019 & 2032
- Table 6: Global Influenza Vaccines Industry Volume K Unit Forecast, by Type 2019 & 2032
- Table 7: Global Influenza Vaccines Industry Revenue Million Forecast, by Technology 2019 & 2032
- Table 8: Global Influenza Vaccines Industry Volume K Unit Forecast, by Technology 2019 & 2032
- Table 9: Global Influenza Vaccines Industry Revenue Million Forecast, by Age Group 2019 & 2032
- Table 10: Global Influenza Vaccines Industry Volume K Unit Forecast, by Age Group 2019 & 2032
- Table 11: Global Influenza Vaccines Industry Revenue Million Forecast, by Route of Administration 2019 & 2032
- Table 12: Global Influenza Vaccines Industry Volume K Unit Forecast, by Route of Administration 2019 & 2032
- Table 13: Global Influenza Vaccines Industry Revenue Million Forecast, by Region 2019 & 2032
- Table 14: Global Influenza Vaccines Industry Volume K Unit Forecast, by Region 2019 & 2032
- Table 15: Global Influenza Vaccines Industry Revenue Million Forecast, by Country 2019 & 2032
- Table 16: Global Influenza Vaccines Industry Volume K Unit Forecast, by Country 2019 & 2032
- Table 17: Global Influenza Vaccines Industry Revenue Million Forecast, by Country 2019 & 2032
- Table 18: Global Influenza Vaccines Industry Volume K Unit Forecast, by Country 2019 & 2032
- Table 19: Global Influenza Vaccines Industry Revenue Million Forecast, by Country 2019 & 2032
- Table 20: Global Influenza Vaccines Industry Volume K Unit Forecast, by Country 2019 & 2032
- Table 21: Global Influenza Vaccines Industry Revenue Million Forecast, by Country 2019 & 2032
- Table 22: Global Influenza Vaccines Industry Volume K Unit Forecast, by Country 2019 & 2032
- Table 23: Global Influenza Vaccines Industry Revenue Million Forecast, by Country 2019 & 2032
- Table 24: Global Influenza Vaccines Industry Volume K Unit Forecast, by Country 2019 & 2032
- Table 25: Global Influenza Vaccines Industry Revenue Million Forecast, by Vaccine Type 2019 & 2032
- Table 26: Global Influenza Vaccines Industry Volume K Unit Forecast, by Vaccine Type 2019 & 2032
- Table 27: Global Influenza Vaccines Industry Revenue Million Forecast, by Type 2019 & 2032
- Table 28: Global Influenza Vaccines Industry Volume K Unit Forecast, by Type 2019 & 2032
- Table 29: Global Influenza Vaccines Industry Revenue Million Forecast, by Technology 2019 & 2032
- Table 30: Global Influenza Vaccines Industry Volume K Unit Forecast, by Technology 2019 & 2032
- Table 31: Global Influenza Vaccines Industry Revenue Million Forecast, by Age Group 2019 & 2032
- Table 32: Global Influenza Vaccines Industry Volume K Unit Forecast, by Age Group 2019 & 2032
- Table 33: Global Influenza Vaccines Industry Revenue Million Forecast, by Route of Administration 2019 & 2032
- Table 34: Global Influenza Vaccines Industry Volume K Unit Forecast, by Route of Administration 2019 & 2032
- Table 35: Global Influenza Vaccines Industry Revenue Million Forecast, by Country 2019 & 2032
- Table 36: Global Influenza Vaccines Industry Volume K Unit Forecast, by Country 2019 & 2032
- Table 37: United States Influenza Vaccines Industry Revenue (Million) Forecast, by Application 2019 & 2032
- Table 38: United States Influenza Vaccines Industry Volume (K Unit) Forecast, by Application 2019 & 2032
- Table 39: Canada Influenza Vaccines Industry Revenue (Million) Forecast, by Application 2019 & 2032
- Table 40: Canada Influenza Vaccines Industry Volume (K Unit) Forecast, by Application 2019 & 2032
- Table 41: Mexico Influenza Vaccines Industry Revenue (Million) Forecast, by Application 2019 & 2032
- Table 42: Mexico Influenza Vaccines Industry Volume (K Unit) Forecast, by Application 2019 & 2032
- Table 43: Global Influenza Vaccines Industry Revenue Million Forecast, by Vaccine Type 2019 & 2032
- Table 44: Global Influenza Vaccines Industry Volume K Unit Forecast, by Vaccine Type 2019 & 2032
- Table 45: Global Influenza Vaccines Industry Revenue Million Forecast, by Type 2019 & 2032
- Table 46: Global Influenza Vaccines Industry Volume K Unit Forecast, by Type 2019 & 2032
- Table 47: Global Influenza Vaccines Industry Revenue Million Forecast, by Technology 2019 & 2032
- Table 48: Global Influenza Vaccines Industry Volume K Unit Forecast, by Technology 2019 & 2032
- Table 49: Global Influenza Vaccines Industry Revenue Million Forecast, by Age Group 2019 & 2032
- Table 50: Global Influenza Vaccines Industry Volume K Unit Forecast, by Age Group 2019 & 2032
- Table 51: Global Influenza Vaccines Industry Revenue Million Forecast, by Route of Administration 2019 & 2032
- Table 52: Global Influenza Vaccines Industry Volume K Unit Forecast, by Route of Administration 2019 & 2032
- Table 53: Global Influenza Vaccines Industry Revenue Million Forecast, by Country 2019 & 2032
- Table 54: Global Influenza Vaccines Industry Volume K Unit Forecast, by Country 2019 & 2032
- Table 55: Germany Influenza Vaccines Industry Revenue (Million) Forecast, by Application 2019 & 2032
- Table 56: Germany Influenza Vaccines Industry Volume (K Unit) Forecast, by Application 2019 & 2032
- Table 57: United Kingdom Influenza Vaccines Industry Revenue (Million) Forecast, by Application 2019 & 2032
- Table 58: United Kingdom Influenza Vaccines Industry Volume (K Unit) Forecast, by Application 2019 & 2032
- Table 59: France Influenza Vaccines Industry Revenue (Million) Forecast, by Application 2019 & 2032
- Table 60: France Influenza Vaccines Industry Volume (K Unit) Forecast, by Application 2019 & 2032
- Table 61: Spain Influenza Vaccines Industry Revenue (Million) Forecast, by Application 2019 & 2032
- Table 62: Spain Influenza Vaccines Industry Volume (K Unit) Forecast, by Application 2019 & 2032
- Table 63: Italy Influenza Vaccines Industry Revenue (Million) Forecast, by Application 2019 & 2032
- Table 64: Italy Influenza Vaccines Industry Volume (K Unit) Forecast, by Application 2019 & 2032
- Table 65: Rest of Europe Influenza Vaccines Industry Revenue (Million) Forecast, by Application 2019 & 2032
- Table 66: Rest of Europe Influenza Vaccines Industry Volume (K Unit) Forecast, by Application 2019 & 2032
- Table 67: Global Influenza Vaccines Industry Revenue Million Forecast, by Vaccine Type 2019 & 2032
- Table 68: Global Influenza Vaccines Industry Volume K Unit Forecast, by Vaccine Type 2019 & 2032
- Table 69: Global Influenza Vaccines Industry Revenue Million Forecast, by Type 2019 & 2032
- Table 70: Global Influenza Vaccines Industry Volume K Unit Forecast, by Type 2019 & 2032
- Table 71: Global Influenza Vaccines Industry Revenue Million Forecast, by Technology 2019 & 2032
- Table 72: Global Influenza Vaccines Industry Volume K Unit Forecast, by Technology 2019 & 2032
- Table 73: Global Influenza Vaccines Industry Revenue Million Forecast, by Age Group 2019 & 2032
- Table 74: Global Influenza Vaccines Industry Volume K Unit Forecast, by Age Group 2019 & 2032
- Table 75: Global Influenza Vaccines Industry Revenue Million Forecast, by Route of Administration 2019 & 2032
- Table 76: Global Influenza Vaccines Industry Volume K Unit Forecast, by Route of Administration 2019 & 2032
- Table 77: Global Influenza Vaccines Industry Revenue Million Forecast, by Country 2019 & 2032
- Table 78: Global Influenza Vaccines Industry Volume K Unit Forecast, by Country 2019 & 2032
- Table 79: China Influenza Vaccines Industry Revenue (Million) Forecast, by Application 2019 & 2032
- Table 80: China Influenza Vaccines Industry Volume (K Unit) Forecast, by Application 2019 & 2032
- Table 81: Japan Influenza Vaccines Industry Revenue (Million) Forecast, by Application 2019 & 2032
- Table 82: Japan Influenza Vaccines Industry Volume (K Unit) Forecast, by Application 2019 & 2032
- Table 83: India Influenza Vaccines Industry Revenue (Million) Forecast, by Application 2019 & 2032
- Table 84: India Influenza Vaccines Industry Volume (K Unit) Forecast, by Application 2019 & 2032
- Table 85: Austalia Influenza Vaccines Industry Revenue (Million) Forecast, by Application 2019 & 2032
- Table 86: Austalia Influenza Vaccines Industry Volume (K Unit) Forecast, by Application 2019 & 2032
- Table 87: South Korea Influenza Vaccines Industry Revenue (Million) Forecast, by Application 2019 & 2032
- Table 88: South Korea Influenza Vaccines Industry Volume (K Unit) Forecast, by Application 2019 & 2032
- Table 89: Rest of Asia Pacific Influenza Vaccines Industry Revenue (Million) Forecast, by Application 2019 & 2032
- Table 90: Rest of Asia Pacific Influenza Vaccines Industry Volume (K Unit) Forecast, by Application 2019 & 2032
- Table 91: Global Influenza Vaccines Industry Revenue Million Forecast, by Vaccine Type 2019 & 2032
- Table 92: Global Influenza Vaccines Industry Volume K Unit Forecast, by Vaccine Type 2019 & 2032
- Table 93: Global Influenza Vaccines Industry Revenue Million Forecast, by Type 2019 & 2032
- Table 94: Global Influenza Vaccines Industry Volume K Unit Forecast, by Type 2019 & 2032
- Table 95: Global Influenza Vaccines Industry Revenue Million Forecast, by Technology 2019 & 2032
- Table 96: Global Influenza Vaccines Industry Volume K Unit Forecast, by Technology 2019 & 2032
- Table 97: Global Influenza Vaccines Industry Revenue Million Forecast, by Age Group 2019 & 2032
- Table 98: Global Influenza Vaccines Industry Volume K Unit Forecast, by Age Group 2019 & 2032
- Table 99: Global Influenza Vaccines Industry Revenue Million Forecast, by Route of Administration 2019 & 2032
- Table 100: Global Influenza Vaccines Industry Volume K Unit Forecast, by Route of Administration 2019 & 2032
- Table 101: Global Influenza Vaccines Industry Revenue Million Forecast, by Country 2019 & 2032
- Table 102: Global Influenza Vaccines Industry Volume K Unit Forecast, by Country 2019 & 2032
- Table 103: GCC Influenza Vaccines Industry Revenue (Million) Forecast, by Application 2019 & 2032
- Table 104: GCC Influenza Vaccines Industry Volume (K Unit) Forecast, by Application 2019 & 2032
- Table 105: South Africa Influenza Vaccines Industry Revenue (Million) Forecast, by Application 2019 & 2032
- Table 106: South Africa Influenza Vaccines Industry Volume (K Unit) Forecast, by Application 2019 & 2032
- Table 107: Rest of Middle East and Africa Influenza Vaccines Industry Revenue (Million) Forecast, by Application 2019 & 2032
- Table 108: Rest of Middle East and Africa Influenza Vaccines Industry Volume (K Unit) Forecast, by Application 2019 & 2032
- Table 109: Global Influenza Vaccines Industry Revenue Million Forecast, by Vaccine Type 2019 & 2032
- Table 110: Global Influenza Vaccines Industry Volume K Unit Forecast, by Vaccine Type 2019 & 2032
- Table 111: Global Influenza Vaccines Industry Revenue Million Forecast, by Type 2019 & 2032
- Table 112: Global Influenza Vaccines Industry Volume K Unit Forecast, by Type 2019 & 2032
- Table 113: Global Influenza Vaccines Industry Revenue Million Forecast, by Technology 2019 & 2032
- Table 114: Global Influenza Vaccines Industry Volume K Unit Forecast, by Technology 2019 & 2032
- Table 115: Global Influenza Vaccines Industry Revenue Million Forecast, by Age Group 2019 & 2032
- Table 116: Global Influenza Vaccines Industry Volume K Unit Forecast, by Age Group 2019 & 2032
- Table 117: Global Influenza Vaccines Industry Revenue Million Forecast, by Route of Administration 2019 & 2032
- Table 118: Global Influenza Vaccines Industry Volume K Unit Forecast, by Route of Administration 2019 & 2032
- Table 119: Global Influenza Vaccines Industry Revenue Million Forecast, by Country 2019 & 2032
- Table 120: Global Influenza Vaccines Industry Volume K Unit Forecast, by Country 2019 & 2032
- Table 121: Brazil Influenza Vaccines Industry Revenue (Million) Forecast, by Application 2019 & 2032
- Table 122: Brazil Influenza Vaccines Industry Volume (K Unit) Forecast, by Application 2019 & 2032
- Table 123: Argentina Influenza Vaccines Industry Revenue (Million) Forecast, by Application 2019 & 2032
- Table 124: Argentina Influenza Vaccines Industry Volume (K Unit) Forecast, by Application 2019 & 2032
- Table 125: Rest of South America Influenza Vaccines Industry Revenue (Million) Forecast, by Application 2019 & 2032
- Table 126: Rest of South America Influenza Vaccines Industry Volume (K Unit) Forecast, by Application 2019 & 2032
Frequently Asked Questions
1. What is the projected Compound Annual Growth Rate (CAGR) of the Influenza Vaccines Industry?
The projected CAGR is approximately 5.65%.
2. Which companies are prominent players in the Influenza Vaccines Industry?
Key companies in the market include BIKEN, Viatris Inc (Mylan), Sinovac Biotech Ltd, Sanofi, Merck & Co Inc, AstraZeneca PLC, Abbott Laboratories, CSL Limited, Gamma Vaccines Pvt Ltd, Emergent BioSolutions, GlaxoSmithKline PLC, Pfizer Inc.
3. What are the main segments of the Influenza Vaccines Industry?
The market segments include Vaccine Type, Type, Technology, Age Group, Route of Administration.
4. Can you provide details about the market size?
The market size is estimated to be USD XX Million as of 2022.
5. What are some drivers contributing to market growth?
Rising Government Initiatives for Spreading Awareness; Continuous Advancement in Developing New Vaccines.
6. What are the notable trends driving market growth?
The Quadrivalent Segment is Expected to Hold a Major Share in the Market over the Forecast Period.
7. Are there any restraints impacting market growth?
Requires High R&D Budget; Longer Timeline Required for New Vaccines.
8. Can you provide examples of recent developments in the market?
September 2022: Pfizer Inc announced that the first participants have been dosed in a pivotal phase 3 clinical trial to evaluate the efficacy, safety, tolerability, and immunogenicity of the company's quadrivalent modified RNA influenza vaccine candidate.
9. What pricing options are available for accessing the report?
Pricing options include single-user, multi-user, and enterprise licenses priced at USD 4750, USD 5250, and USD 8750 respectively.
10. Is the market size provided in terms of value or volume?
The market size is provided in terms of value, measured in Million and volume, measured in K Unit.
11. Are there any specific market keywords associated with the report?
Yes, the market keyword associated with the report is "Influenza Vaccines Industry," which aids in identifying and referencing the specific market segment covered.
12. How do I determine which pricing option suits my needs best?
The pricing options vary based on user requirements and access needs. Individual users may opt for single-user licenses, while businesses requiring broader access may choose multi-user or enterprise licenses for cost-effective access to the report.
13. Are there any additional resources or data provided in the Influenza Vaccines Industry report?
While the report offers comprehensive insights, it's advisable to review the specific contents or supplementary materials provided to ascertain if additional resources or data are available.
14. How can I stay updated on further developments or reports in the Influenza Vaccines Industry?
To stay informed about further developments, trends, and reports in the Influenza Vaccines Industry, consider subscribing to industry newsletters, following relevant companies and organizations, or regularly checking reputable industry news sources and publications.
Methodology
Step 1 - Identification of Relevant Samples Size from Population Database


Step 2 - Approaches for Defining Global Market Size (Value, Volume* & Price*)

Note*: In applicable scenarios
Step 3 - Data Sources
Primary Research
- Web Analytics
- Survey Reports
- Research Institute
- Latest Research Reports
- Opinion Leaders
Secondary Research
- Annual Reports
- White Paper
- Latest Press Release
- Industry Association
- Paid Database
- Investor Presentations

Step 4 - Data Triangulation
Involves using different sources of information in order to increase the validity of a study
These sources are likely to be stakeholders in a program - participants, other researchers, program staff, other community members, and so on.
Then we put all data in single framework & apply various statistical tools to find out the dynamic on the market.
During the analysis stage, feedback from the stakeholder groups would be compared to determine areas of agreement as well as areas of divergence
