

Key Insights
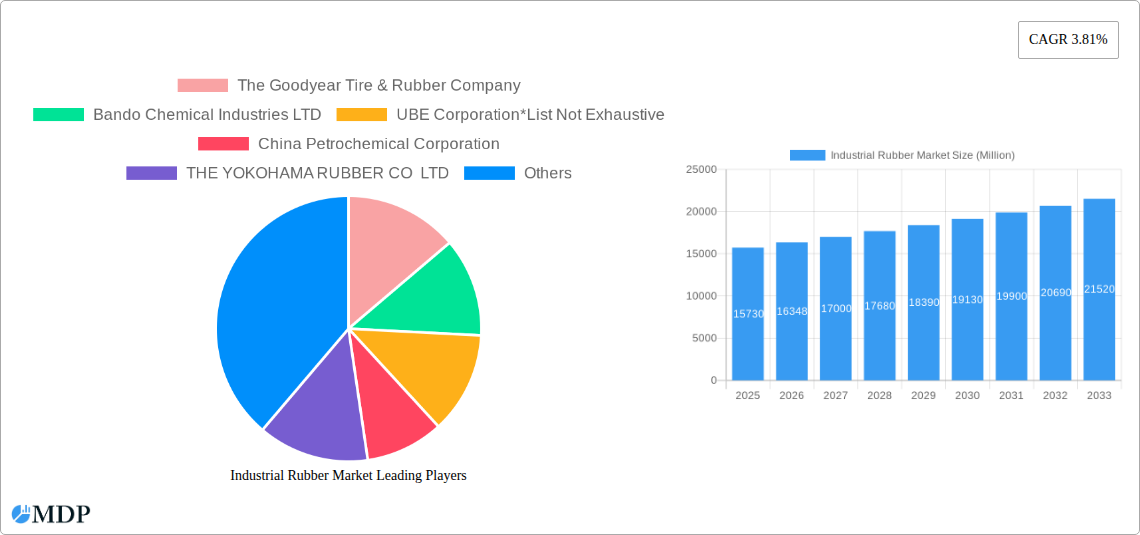
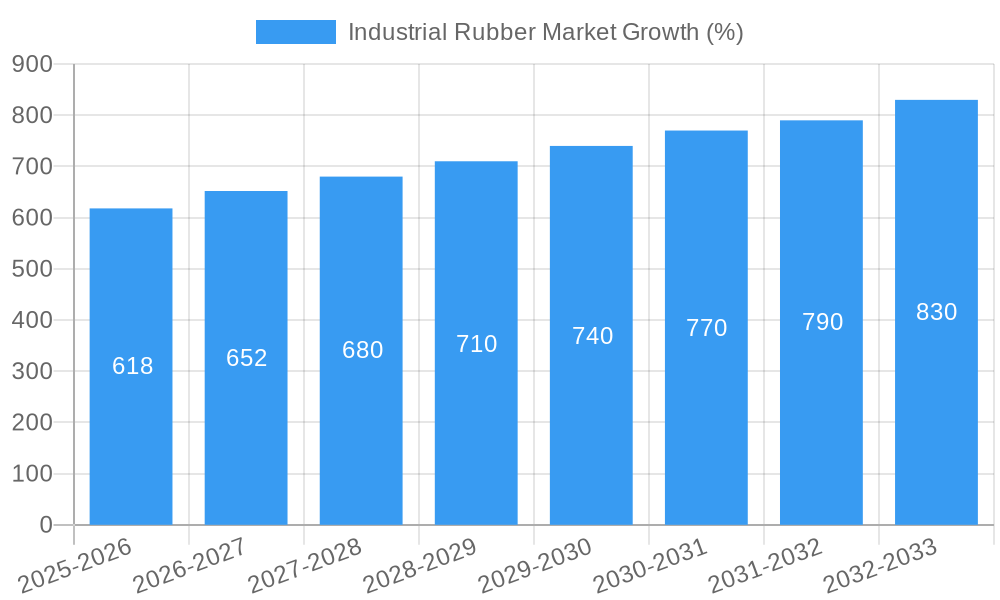
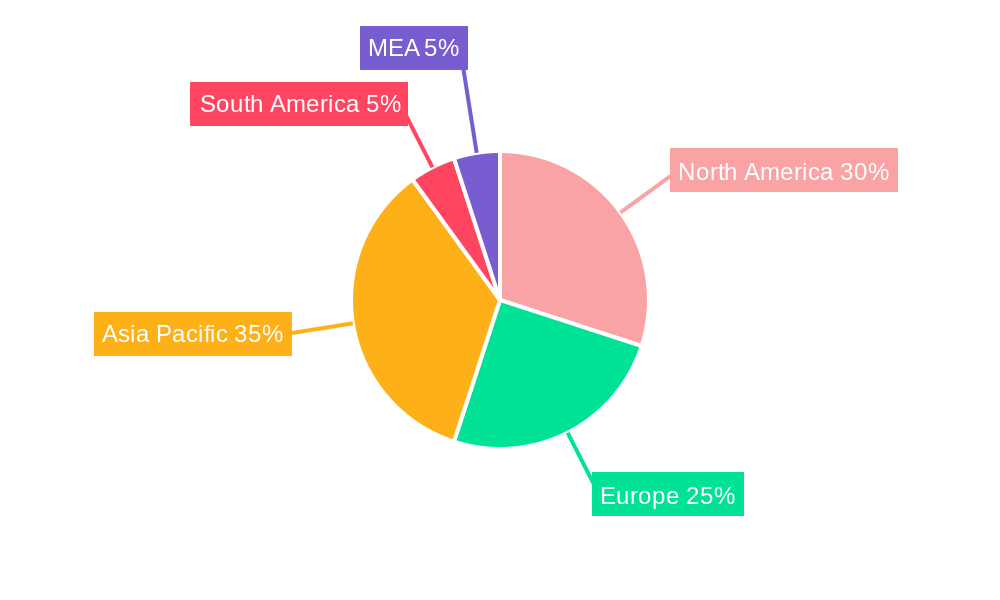
The global industrial rubber market, valued at $15.73 billion in 2025, is projected to experience steady growth, driven by increasing industrial automation, rising demand for durable and high-performance materials across various sectors, and the expanding automotive and construction industries. The 3.81% CAGR from 2019-2033 indicates a sustained market expansion, although growth may fluctuate year-to-year due to economic cycles and raw material price volatility. Key application segments include conveyor belts, crucial for material handling in manufacturing and logistics; transmission belts, essential for power transmission in machinery; and pressure hoses, vital for fluid transfer in various industrial processes. Other applications, such as seals, gaskets, and vibration dampeners, contribute significantly to market volume. Major players like Goodyear, Bridgestone, and Bando Chemical Industries dominate the market, leveraging their extensive distribution networks and technological advancements in material formulations. Geographical distribution sees North America and Asia-Pacific as leading regions, reflecting robust industrial activity and manufacturing bases in these areas. However, emerging economies in regions like South America and MEA are expected to contribute to market growth as industrialization accelerates. Challenges include fluctuating natural rubber prices, increasing environmental concerns about the sustainability of manufacturing processes, and competition from alternative materials like plastics and composites.
Growth within the industrial rubber market will be influenced by several factors. The ongoing expansion of e-commerce and related logistics operations will significantly boost demand for conveyor belts and other rubber components. Government initiatives promoting infrastructure development and industrial modernization, especially in developing countries, will create additional opportunities. Furthermore, advancements in rubber compound technology, focused on improved durability, resilience, and resistance to harsh environments, will drive market growth. Companies are also investing in sustainable manufacturing practices to mitigate environmental concerns, which is expected to improve the market’s long-term prospects. However, it’s crucial to acknowledge potential headwinds such as economic slowdowns, geopolitical instability, and potential disruptions in the supply chains of raw materials.
Industrial Rubber Market Report: 2019-2033 Forecast
This comprehensive report provides a detailed analysis of the global industrial rubber market, offering invaluable insights for stakeholders seeking to navigate this dynamic sector. The study period spans 2019-2033, with a base year of 2025 and a forecast period of 2025-2033. The report leverages robust data analysis to present a clear picture of market dynamics, trends, and future opportunities. Key segments analyzed include conveyor belts, transmission belts, pressure hoses, and other applications. Leading players like The Goodyear Tire & Rubber Company, Bridgestone Corporation, and Yokohama Rubber Co. Ltd. are profiled, alongside an overview of significant market developments. Download now to gain a competitive edge.
Industrial Rubber Market Market Dynamics & Concentration
The industrial rubber market exhibits a moderately concentrated landscape, with a handful of multinational corporations holding significant market share. However, the presence of numerous smaller players, particularly in regional markets, contributes to a dynamic competitive environment. Market share data for 2024 suggests that the top five players collectively account for approximately xx% of the global market. This concentration is partly driven by economies of scale in production and extensive distribution networks.
Market Concentration Drivers:
- Economies of Scale: Large players benefit from lower production costs, facilitating competitive pricing.
- Technological Advancements: Continuous innovation in materials science and manufacturing processes creates a barrier to entry for smaller players.
- Strong Brand Recognition: Established brands enjoy higher consumer trust and preference.
- Extensive Distribution Networks: Well-established distribution channels provide broader market access.
Regulatory Frameworks & M&A Activities:
Stringent environmental regulations related to rubber production and disposal are shaping market dynamics, driving innovation in sustainable materials and manufacturing processes. The number of M&A deals in the sector has remained relatively stable in recent years, averaging approximately xx deals annually between 2020 and 2024. These transactions often involve strategic acquisitions aimed at expanding product portfolios or geographical reach. The impact of these deals on market concentration is expected to be moderate in the near future.
Industrial Rubber Market Industry Trends & Analysis
The industrial rubber market is experiencing steady growth, driven by increasing demand from diverse end-use industries. The Compound Annual Growth Rate (CAGR) is projected to be xx% during the forecast period (2025-2033). Key growth drivers include the expansion of infrastructure projects, particularly in emerging economies, and the rising adoption of advanced materials in various industrial applications. Technological advancements in rubber compounding, leading to improved durability and performance, are further boosting market expansion.
Market penetration for high-performance rubber products, such as those incorporating nanomaterials or advanced polymers, is increasing gradually. This is attributed to the increasing focus on improving the efficiency and lifespan of industrial components. Competitive dynamics are characterized by intense rivalry among major players, who are constantly striving for innovation and differentiation through product development and strategic partnerships. Consumer preferences are increasingly leaning towards sustainable and environmentally friendly rubber products, prompting manufacturers to invest in eco-conscious solutions.
Leading Markets & Segments in Industrial Rubber Market
The Asia-Pacific region currently dominates the industrial rubber market, driven by rapid industrialization and infrastructure development in countries like China and India. Within the application segments, conveyor belts account for the largest market share, owing to their widespread use in mining, construction, and manufacturing.
Key Drivers of Regional Dominance (Asia-Pacific):
- Rapid Industrialization: Significant investment in manufacturing and infrastructure projects fuels demand.
- Economic Growth: Rising disposable incomes and increased consumer spending drive demand for goods requiring industrial rubber components.
- Government Support: Favorable government policies and investment in infrastructure projects further stimulate market growth.
Segment Dominance Analysis:
Conveyor belts maintain their leading position due to their crucial role in material handling across diverse industries. The robust growth of the construction and mining sectors, coupled with the demand for improved efficiency and durability in material handling, drives strong demand for high-quality conveyor belts. Transmission belts also represent a significant segment, driven by their widespread use in various machinery and power transmission systems. Growth in this segment is closely linked to the expansion of manufacturing and industrial automation. Pressure hoses and other applications constitute significant, yet smaller, market segments.
Industrial Rubber Market Product Developments
Recent product innovations focus on enhancing durability, performance, and sustainability. For example, Cabot Corporation’s E2C DX9660 offers a 30% improvement in abrasion resistance, extending the lifespan of rubber components. Yokohama Rubber Co. Ltd.’s Hamaheat Super 80 represents a significant advancement in high-temperature resistant conveyor belts. These developments highlight the industry's commitment to providing superior products that address the demands of increasingly challenging industrial applications. Furthermore, the focus on sustainable materials and manufacturing processes is creating a new generation of environmentally friendly rubber products, catering to growing environmental concerns.
Key Drivers of Industrial Rubber Market Growth
Several factors contribute to the sustained growth of the industrial rubber market. Technological advancements, such as the development of new polymer blends and improved manufacturing techniques, enhance product performance and durability. The expansion of infrastructure projects globally, particularly in emerging economies, creates significant demand for industrial rubber components. Furthermore, supportive government policies and regulations promoting industrial development contribute to market expansion.
Challenges in the Industrial Rubber Market Market
The industrial rubber market faces challenges including fluctuating raw material prices, which impact production costs and profitability. Supply chain disruptions can also lead to production delays and increased costs. Intense competition among established players and the emergence of new entrants create pressure on pricing and margins. Environmental regulations are becoming increasingly stringent, requiring manufacturers to invest in sustainable production methods.
Emerging Opportunities in Industrial Rubber Market
The industrial rubber market presents significant opportunities for growth through the development of innovative, high-performance rubber materials. Strategic partnerships and collaborations between rubber manufacturers and end-use industries can unlock new market segments. Expansion into emerging markets with high growth potential offers significant opportunities for increased market penetration. Focus on eco-friendly materials and sustainable production processes is expected to open up new markets and enhance the industry's image.
Leading Players in the Industrial Rubber Market Sector
- The Goodyear Tire & Rubber Company
- Bando Chemical Industries LTD
- UBE Corporation
- China Petrochemical Corporation
- THE YOKOHAMA RUBBER CO LTD
- ENEOS Corporation
- Trinseo
- Denka Company Limited
- SIBUR Holding PJSC
- Rondex (Thailand) Co Ltd
- AMMEGA
- Bridgestone Corporation
- TSRC
Key Milestones in Industrial Rubber Market Industry
- February 2023: Cabot Corporation introduced E2C DX9660, enhancing rubber longevity with a 30% improvement in abrasion resistance.
- March 2023: Yokohama Rubber Co. Ltd. launched Hamaheat Super 80, a high-temperature heat-resistant conveyor belt (180°C/350°F).
- April 2023: Sinopec subsidiary launched styrene-butadiene copolymer (SBC) production with a 170,000-ton annual capacity.
- January 2024: AMMEGA Group invested USD 100 Million in the Americas to expand conveyor belt production and service capabilities.
Strategic Outlook for Industrial Rubber Market Market
The future of the industrial rubber market looks promising, with sustained growth driven by technological innovations and expanding industrial activities globally. Strategic partnerships, focused on developing sustainable and high-performance materials, will be crucial for success. Companies focusing on efficient supply chains and environmentally conscious manufacturing practices are well-positioned for long-term success in this evolving market. The focus should be on creating value through innovation, sustainability, and strategic alliances to capitalize on the substantial growth opportunities in the years ahead.
Industrial Rubber Market Segmentation
-
1. Application
- 1.1. Conveyor Belts
- 1.2. Transmission Belts
- 1.3. Pressure Hoses
- 1.4. Other Applications
Industrial Rubber Market Segmentation By Geography
-
1. Asia Pacific
- 1.1. China
- 1.2. India
- 1.3. Japan
- 1.4. South Korea
- 1.5. Thailand
- 1.6. Indonesia
- 1.7. Vietnam
- 1.8. Malaysia
- 1.9. Rest of Asia Pacific
-
2. North America
- 2.1. United States
- 2.2. Canada
- 2.3. Mexico
-
3. Europe
- 3.1. Germany
- 3.2. United Kingdom
- 3.3. France
- 3.4. Italy
- 3.5. Spain
- 3.6. Russia
- 3.7. NORDIC
- 3.8. Turkey
- 3.9. Rest of Europe
-
4. South America
- 4.1. Brazil
- 4.2. Argentina
- 4.3. Colombia
- 4.4. Rest of South America
-
5. Middle East and Africa
- 5.1. Saudi Arabia
- 5.2. South Africa
- 5.3. United Arab Emirates
- 5.4. Qatar
- 5.5. Nigeria
- 5.6. Egypt
- 5.7. Rest of Middle East and Africa
Industrial Rubber Market REPORT HIGHLIGHTS
| Aspects | Details |
|---|---|
| Study Period | 2019-2033 |
| Base Year | 2024 |
| Estimated Year | 2025 |
| Forecast Period | 2025-2033 |
| Historical Period | 2019-2024 |
| Growth Rate | CAGR of 3.81% from 2019-2033 |
| Segmentation |
|
Table of Contents
- 1. Introduction
- 1.1. Research Scope
- 1.2. Market Segmentation
- 1.3. Research Methodology
- 1.4. Definitions and Assumptions
- 2. Executive Summary
- 2.1. Introduction
- 3. Market Dynamics
- 3.1. Introduction
- 3.2. Market Drivers
- 3.2.1. Increasing Application as Conveyor and Transmission Belts; Growing Demand for High-pressure Hoses
- 3.3. Market Restrains
- 3.3.1. Stringent Environmental Regulations; Other Restraints
- 3.4. Market Trends
- 3.4.1. Increasing Application as Conveyor and Transmission Belts
- 4. Market Factor Analysis
- 4.1. Porters Five Forces
- 4.2. Supply/Value Chain
- 4.3. PESTEL analysis
- 4.4. Market Entropy
- 4.5. Patent/Trademark Analysis
- 5. Global Industrial Rubber Market Analysis, Insights and Forecast, 2019-2031
- 5.1. Market Analysis, Insights and Forecast - by Application
- 5.1.1. Conveyor Belts
- 5.1.2. Transmission Belts
- 5.1.3. Pressure Hoses
- 5.1.4. Other Applications
- 5.2. Market Analysis, Insights and Forecast - by Region
- 5.2.1. Asia Pacific
- 5.2.2. North America
- 5.2.3. Europe
- 5.2.4. South America
- 5.2.5. Middle East and Africa
- 5.1. Market Analysis, Insights and Forecast - by Application
- 6. Asia Pacific Industrial Rubber Market Analysis, Insights and Forecast, 2019-2031
- 6.1. Market Analysis, Insights and Forecast - by Application
- 6.1.1. Conveyor Belts
- 6.1.2. Transmission Belts
- 6.1.3. Pressure Hoses
- 6.1.4. Other Applications
- 6.1. Market Analysis, Insights and Forecast - by Application
- 7. North America Industrial Rubber Market Analysis, Insights and Forecast, 2019-2031
- 7.1. Market Analysis, Insights and Forecast - by Application
- 7.1.1. Conveyor Belts
- 7.1.2. Transmission Belts
- 7.1.3. Pressure Hoses
- 7.1.4. Other Applications
- 7.1. Market Analysis, Insights and Forecast - by Application
- 8. Europe Industrial Rubber Market Analysis, Insights and Forecast, 2019-2031
- 8.1. Market Analysis, Insights and Forecast - by Application
- 8.1.1. Conveyor Belts
- 8.1.2. Transmission Belts
- 8.1.3. Pressure Hoses
- 8.1.4. Other Applications
- 8.1. Market Analysis, Insights and Forecast - by Application
- 9. South America Industrial Rubber Market Analysis, Insights and Forecast, 2019-2031
- 9.1. Market Analysis, Insights and Forecast - by Application
- 9.1.1. Conveyor Belts
- 9.1.2. Transmission Belts
- 9.1.3. Pressure Hoses
- 9.1.4. Other Applications
- 9.1. Market Analysis, Insights and Forecast - by Application
- 10. Middle East and Africa Industrial Rubber Market Analysis, Insights and Forecast, 2019-2031
- 10.1. Market Analysis, Insights and Forecast - by Application
- 10.1.1. Conveyor Belts
- 10.1.2. Transmission Belts
- 10.1.3. Pressure Hoses
- 10.1.4. Other Applications
- 10.1. Market Analysis, Insights and Forecast - by Application
- 11. North America Industrial Rubber Market Analysis, Insights and Forecast, 2019-2031
- 11.1. Market Analysis, Insights and Forecast - By Country/Sub-region
- 11.1.1 United States
- 11.1.2 Canada
- 11.1.3 Mexico
- 12. Europe Industrial Rubber Market Analysis, Insights and Forecast, 2019-2031
- 12.1. Market Analysis, Insights and Forecast - By Country/Sub-region
- 12.1.1 Germany
- 12.1.2 United Kingdom
- 12.1.3 France
- 12.1.4 Spain
- 12.1.5 Italy
- 12.1.6 Spain
- 12.1.7 Belgium
- 12.1.8 Netherland
- 12.1.9 Nordics
- 12.1.10 Rest of Europe
- 13. Asia Pacific Industrial Rubber Market Analysis, Insights and Forecast, 2019-2031
- 13.1. Market Analysis, Insights and Forecast - By Country/Sub-region
- 13.1.1 China
- 13.1.2 Japan
- 13.1.3 India
- 13.1.4 South Korea
- 13.1.5 Southeast Asia
- 13.1.6 Australia
- 13.1.7 Indonesia
- 13.1.8 Phillipes
- 13.1.9 Singapore
- 13.1.10 Thailandc
- 13.1.11 Rest of Asia Pacific
- 14. South America Industrial Rubber Market Analysis, Insights and Forecast, 2019-2031
- 14.1. Market Analysis, Insights and Forecast - By Country/Sub-region
- 14.1.1 Brazil
- 14.1.2 Argentina
- 14.1.3 Peru
- 14.1.4 Chile
- 14.1.5 Colombia
- 14.1.6 Ecuador
- 14.1.7 Venezuela
- 14.1.8 Rest of South America
- 15. North America Industrial Rubber Market Analysis, Insights and Forecast, 2019-2031
- 15.1. Market Analysis, Insights and Forecast - By Country/Sub-region
- 15.1.1 United States
- 15.1.2 Canada
- 15.1.3 Mexico
- 16. MEA Industrial Rubber Market Analysis, Insights and Forecast, 2019-2031
- 16.1. Market Analysis, Insights and Forecast - By Country/Sub-region
- 16.1.1 United Arab Emirates
- 16.1.2 Saudi Arabia
- 16.1.3 South Africa
- 16.1.4 Rest of Middle East and Africa
- 17. Competitive Analysis
- 17.1. Global Market Share Analysis 2024
- 17.2. Company Profiles
- 17.2.1 The Goodyear Tire & Rubber Company
- 17.2.1.1. Overview
- 17.2.1.2. Products
- 17.2.1.3. SWOT Analysis
- 17.2.1.4. Recent Developments
- 17.2.1.5. Financials (Based on Availability)
- 17.2.2 Bando Chemical Industries LTD
- 17.2.2.1. Overview
- 17.2.2.2. Products
- 17.2.2.3. SWOT Analysis
- 17.2.2.4. Recent Developments
- 17.2.2.5. Financials (Based on Availability)
- 17.2.3 UBE Corporation*List Not Exhaustive
- 17.2.3.1. Overview
- 17.2.3.2. Products
- 17.2.3.3. SWOT Analysis
- 17.2.3.4. Recent Developments
- 17.2.3.5. Financials (Based on Availability)
- 17.2.4 China Petrochemical Corporation
- 17.2.4.1. Overview
- 17.2.4.2. Products
- 17.2.4.3. SWOT Analysis
- 17.2.4.4. Recent Developments
- 17.2.4.5. Financials (Based on Availability)
- 17.2.5 THE YOKOHAMA RUBBER CO LTD
- 17.2.5.1. Overview
- 17.2.5.2. Products
- 17.2.5.3. SWOT Analysis
- 17.2.5.4. Recent Developments
- 17.2.5.5. Financials (Based on Availability)
- 17.2.6 ENEOS Corporation
- 17.2.6.1. Overview
- 17.2.6.2. Products
- 17.2.6.3. SWOT Analysis
- 17.2.6.4. Recent Developments
- 17.2.6.5. Financials (Based on Availability)
- 17.2.7 Trinseo
- 17.2.7.1. Overview
- 17.2.7.2. Products
- 17.2.7.3. SWOT Analysis
- 17.2.7.4. Recent Developments
- 17.2.7.5. Financials (Based on Availability)
- 17.2.8 Denka Company Limited
- 17.2.8.1. Overview
- 17.2.8.2. Products
- 17.2.8.3. SWOT Analysis
- 17.2.8.4. Recent Developments
- 17.2.8.5. Financials (Based on Availability)
- 17.2.9 SIBUR Holding PJSC
- 17.2.9.1. Overview
- 17.2.9.2. Products
- 17.2.9.3. SWOT Analysis
- 17.2.9.4. Recent Developments
- 17.2.9.5. Financials (Based on Availability)
- 17.2.10 Rondex (Thailand) Co Ltd
- 17.2.10.1. Overview
- 17.2.10.2. Products
- 17.2.10.3. SWOT Analysis
- 17.2.10.4. Recent Developments
- 17.2.10.5. Financials (Based on Availability)
- 17.2.11 AMMEGA
- 17.2.11.1. Overview
- 17.2.11.2. Products
- 17.2.11.3. SWOT Analysis
- 17.2.11.4. Recent Developments
- 17.2.11.5. Financials (Based on Availability)
- 17.2.12 Bridgestone Corporation
- 17.2.12.1. Overview
- 17.2.12.2. Products
- 17.2.12.3. SWOT Analysis
- 17.2.12.4. Recent Developments
- 17.2.12.5. Financials (Based on Availability)
- 17.2.13 TSRC
- 17.2.13.1. Overview
- 17.2.13.2. Products
- 17.2.13.3. SWOT Analysis
- 17.2.13.4. Recent Developments
- 17.2.13.5. Financials (Based on Availability)
- 17.2.1 The Goodyear Tire & Rubber Company
List of Figures
- Figure 1: Global Industrial Rubber Market Revenue Breakdown (Million, %) by Region 2024 & 2032
- Figure 2: North America Industrial Rubber Market Revenue (Million), by Country 2024 & 2032
- Figure 3: North America Industrial Rubber Market Revenue Share (%), by Country 2024 & 2032
- Figure 4: Europe Industrial Rubber Market Revenue (Million), by Country 2024 & 2032
- Figure 5: Europe Industrial Rubber Market Revenue Share (%), by Country 2024 & 2032
- Figure 6: Asia Pacific Industrial Rubber Market Revenue (Million), by Country 2024 & 2032
- Figure 7: Asia Pacific Industrial Rubber Market Revenue Share (%), by Country 2024 & 2032
- Figure 8: South America Industrial Rubber Market Revenue (Million), by Country 2024 & 2032
- Figure 9: South America Industrial Rubber Market Revenue Share (%), by Country 2024 & 2032
- Figure 10: North America Industrial Rubber Market Revenue (Million), by Country 2024 & 2032
- Figure 11: North America Industrial Rubber Market Revenue Share (%), by Country 2024 & 2032
- Figure 12: MEA Industrial Rubber Market Revenue (Million), by Country 2024 & 2032
- Figure 13: MEA Industrial Rubber Market Revenue Share (%), by Country 2024 & 2032
- Figure 14: Asia Pacific Industrial Rubber Market Revenue (Million), by Application 2024 & 2032
- Figure 15: Asia Pacific Industrial Rubber Market Revenue Share (%), by Application 2024 & 2032
- Figure 16: Asia Pacific Industrial Rubber Market Revenue (Million), by Country 2024 & 2032
- Figure 17: Asia Pacific Industrial Rubber Market Revenue Share (%), by Country 2024 & 2032
- Figure 18: North America Industrial Rubber Market Revenue (Million), by Application 2024 & 2032
- Figure 19: North America Industrial Rubber Market Revenue Share (%), by Application 2024 & 2032
- Figure 20: North America Industrial Rubber Market Revenue (Million), by Country 2024 & 2032
- Figure 21: North America Industrial Rubber Market Revenue Share (%), by Country 2024 & 2032
- Figure 22: Europe Industrial Rubber Market Revenue (Million), by Application 2024 & 2032
- Figure 23: Europe Industrial Rubber Market Revenue Share (%), by Application 2024 & 2032
- Figure 24: Europe Industrial Rubber Market Revenue (Million), by Country 2024 & 2032
- Figure 25: Europe Industrial Rubber Market Revenue Share (%), by Country 2024 & 2032
- Figure 26: South America Industrial Rubber Market Revenue (Million), by Application 2024 & 2032
- Figure 27: South America Industrial Rubber Market Revenue Share (%), by Application 2024 & 2032
- Figure 28: South America Industrial Rubber Market Revenue (Million), by Country 2024 & 2032
- Figure 29: South America Industrial Rubber Market Revenue Share (%), by Country 2024 & 2032
- Figure 30: Middle East and Africa Industrial Rubber Market Revenue (Million), by Application 2024 & 2032
- Figure 31: Middle East and Africa Industrial Rubber Market Revenue Share (%), by Application 2024 & 2032
- Figure 32: Middle East and Africa Industrial Rubber Market Revenue (Million), by Country 2024 & 2032
- Figure 33: Middle East and Africa Industrial Rubber Market Revenue Share (%), by Country 2024 & 2032
List of Tables
- Table 1: Global Industrial Rubber Market Revenue Million Forecast, by Region 2019 & 2032
- Table 2: Global Industrial Rubber Market Revenue Million Forecast, by Application 2019 & 2032
- Table 3: Global Industrial Rubber Market Revenue Million Forecast, by Region 2019 & 2032
- Table 4: Global Industrial Rubber Market Revenue Million Forecast, by Country 2019 & 2032
- Table 5: United States Industrial Rubber Market Revenue (Million) Forecast, by Application 2019 & 2032
- Table 6: Canada Industrial Rubber Market Revenue (Million) Forecast, by Application 2019 & 2032
- Table 7: Mexico Industrial Rubber Market Revenue (Million) Forecast, by Application 2019 & 2032
- Table 8: Global Industrial Rubber Market Revenue Million Forecast, by Country 2019 & 2032
- Table 9: Germany Industrial Rubber Market Revenue (Million) Forecast, by Application 2019 & 2032
- Table 10: United Kingdom Industrial Rubber Market Revenue (Million) Forecast, by Application 2019 & 2032
- Table 11: France Industrial Rubber Market Revenue (Million) Forecast, by Application 2019 & 2032
- Table 12: Spain Industrial Rubber Market Revenue (Million) Forecast, by Application 2019 & 2032
- Table 13: Italy Industrial Rubber Market Revenue (Million) Forecast, by Application 2019 & 2032
- Table 14: Spain Industrial Rubber Market Revenue (Million) Forecast, by Application 2019 & 2032
- Table 15: Belgium Industrial Rubber Market Revenue (Million) Forecast, by Application 2019 & 2032
- Table 16: Netherland Industrial Rubber Market Revenue (Million) Forecast, by Application 2019 & 2032
- Table 17: Nordics Industrial Rubber Market Revenue (Million) Forecast, by Application 2019 & 2032
- Table 18: Rest of Europe Industrial Rubber Market Revenue (Million) Forecast, by Application 2019 & 2032
- Table 19: Global Industrial Rubber Market Revenue Million Forecast, by Country 2019 & 2032
- Table 20: China Industrial Rubber Market Revenue (Million) Forecast, by Application 2019 & 2032
- Table 21: Japan Industrial Rubber Market Revenue (Million) Forecast, by Application 2019 & 2032
- Table 22: India Industrial Rubber Market Revenue (Million) Forecast, by Application 2019 & 2032
- Table 23: South Korea Industrial Rubber Market Revenue (Million) Forecast, by Application 2019 & 2032
- Table 24: Southeast Asia Industrial Rubber Market Revenue (Million) Forecast, by Application 2019 & 2032
- Table 25: Australia Industrial Rubber Market Revenue (Million) Forecast, by Application 2019 & 2032
- Table 26: Indonesia Industrial Rubber Market Revenue (Million) Forecast, by Application 2019 & 2032
- Table 27: Phillipes Industrial Rubber Market Revenue (Million) Forecast, by Application 2019 & 2032
- Table 28: Singapore Industrial Rubber Market Revenue (Million) Forecast, by Application 2019 & 2032
- Table 29: Thailandc Industrial Rubber Market Revenue (Million) Forecast, by Application 2019 & 2032
- Table 30: Rest of Asia Pacific Industrial Rubber Market Revenue (Million) Forecast, by Application 2019 & 2032
- Table 31: Global Industrial Rubber Market Revenue Million Forecast, by Country 2019 & 2032
- Table 32: Brazil Industrial Rubber Market Revenue (Million) Forecast, by Application 2019 & 2032
- Table 33: Argentina Industrial Rubber Market Revenue (Million) Forecast, by Application 2019 & 2032
- Table 34: Peru Industrial Rubber Market Revenue (Million) Forecast, by Application 2019 & 2032
- Table 35: Chile Industrial Rubber Market Revenue (Million) Forecast, by Application 2019 & 2032
- Table 36: Colombia Industrial Rubber Market Revenue (Million) Forecast, by Application 2019 & 2032
- Table 37: Ecuador Industrial Rubber Market Revenue (Million) Forecast, by Application 2019 & 2032
- Table 38: Venezuela Industrial Rubber Market Revenue (Million) Forecast, by Application 2019 & 2032
- Table 39: Rest of South America Industrial Rubber Market Revenue (Million) Forecast, by Application 2019 & 2032
- Table 40: Global Industrial Rubber Market Revenue Million Forecast, by Country 2019 & 2032
- Table 41: United States Industrial Rubber Market Revenue (Million) Forecast, by Application 2019 & 2032
- Table 42: Canada Industrial Rubber Market Revenue (Million) Forecast, by Application 2019 & 2032
- Table 43: Mexico Industrial Rubber Market Revenue (Million) Forecast, by Application 2019 & 2032
- Table 44: Global Industrial Rubber Market Revenue Million Forecast, by Country 2019 & 2032
- Table 45: United Arab Emirates Industrial Rubber Market Revenue (Million) Forecast, by Application 2019 & 2032
- Table 46: Saudi Arabia Industrial Rubber Market Revenue (Million) Forecast, by Application 2019 & 2032
- Table 47: South Africa Industrial Rubber Market Revenue (Million) Forecast, by Application 2019 & 2032
- Table 48: Rest of Middle East and Africa Industrial Rubber Market Revenue (Million) Forecast, by Application 2019 & 2032
- Table 49: Global Industrial Rubber Market Revenue Million Forecast, by Application 2019 & 2032
- Table 50: Global Industrial Rubber Market Revenue Million Forecast, by Country 2019 & 2032
- Table 51: China Industrial Rubber Market Revenue (Million) Forecast, by Application 2019 & 2032
- Table 52: India Industrial Rubber Market Revenue (Million) Forecast, by Application 2019 & 2032
- Table 53: Japan Industrial Rubber Market Revenue (Million) Forecast, by Application 2019 & 2032
- Table 54: South Korea Industrial Rubber Market Revenue (Million) Forecast, by Application 2019 & 2032
- Table 55: Thailand Industrial Rubber Market Revenue (Million) Forecast, by Application 2019 & 2032
- Table 56: Indonesia Industrial Rubber Market Revenue (Million) Forecast, by Application 2019 & 2032
- Table 57: Vietnam Industrial Rubber Market Revenue (Million) Forecast, by Application 2019 & 2032
- Table 58: Malaysia Industrial Rubber Market Revenue (Million) Forecast, by Application 2019 & 2032
- Table 59: Rest of Asia Pacific Industrial Rubber Market Revenue (Million) Forecast, by Application 2019 & 2032
- Table 60: Global Industrial Rubber Market Revenue Million Forecast, by Application 2019 & 2032
- Table 61: Global Industrial Rubber Market Revenue Million Forecast, by Country 2019 & 2032
- Table 62: United States Industrial Rubber Market Revenue (Million) Forecast, by Application 2019 & 2032
- Table 63: Canada Industrial Rubber Market Revenue (Million) Forecast, by Application 2019 & 2032
- Table 64: Mexico Industrial Rubber Market Revenue (Million) Forecast, by Application 2019 & 2032
- Table 65: Global Industrial Rubber Market Revenue Million Forecast, by Application 2019 & 2032
- Table 66: Global Industrial Rubber Market Revenue Million Forecast, by Country 2019 & 2032
- Table 67: Germany Industrial Rubber Market Revenue (Million) Forecast, by Application 2019 & 2032
- Table 68: United Kingdom Industrial Rubber Market Revenue (Million) Forecast, by Application 2019 & 2032
- Table 69: France Industrial Rubber Market Revenue (Million) Forecast, by Application 2019 & 2032
- Table 70: Italy Industrial Rubber Market Revenue (Million) Forecast, by Application 2019 & 2032
- Table 71: Spain Industrial Rubber Market Revenue (Million) Forecast, by Application 2019 & 2032
- Table 72: Russia Industrial Rubber Market Revenue (Million) Forecast, by Application 2019 & 2032
- Table 73: NORDIC Industrial Rubber Market Revenue (Million) Forecast, by Application 2019 & 2032
- Table 74: Turkey Industrial Rubber Market Revenue (Million) Forecast, by Application 2019 & 2032
- Table 75: Rest of Europe Industrial Rubber Market Revenue (Million) Forecast, by Application 2019 & 2032
- Table 76: Global Industrial Rubber Market Revenue Million Forecast, by Application 2019 & 2032
- Table 77: Global Industrial Rubber Market Revenue Million Forecast, by Country 2019 & 2032
- Table 78: Brazil Industrial Rubber Market Revenue (Million) Forecast, by Application 2019 & 2032
- Table 79: Argentina Industrial Rubber Market Revenue (Million) Forecast, by Application 2019 & 2032
- Table 80: Colombia Industrial Rubber Market Revenue (Million) Forecast, by Application 2019 & 2032
- Table 81: Rest of South America Industrial Rubber Market Revenue (Million) Forecast, by Application 2019 & 2032
- Table 82: Global Industrial Rubber Market Revenue Million Forecast, by Application 2019 & 2032
- Table 83: Global Industrial Rubber Market Revenue Million Forecast, by Country 2019 & 2032
- Table 84: Saudi Arabia Industrial Rubber Market Revenue (Million) Forecast, by Application 2019 & 2032
- Table 85: South Africa Industrial Rubber Market Revenue (Million) Forecast, by Application 2019 & 2032
- Table 86: United Arab Emirates Industrial Rubber Market Revenue (Million) Forecast, by Application 2019 & 2032
- Table 87: Qatar Industrial Rubber Market Revenue (Million) Forecast, by Application 2019 & 2032
- Table 88: Nigeria Industrial Rubber Market Revenue (Million) Forecast, by Application 2019 & 2032
- Table 89: Egypt Industrial Rubber Market Revenue (Million) Forecast, by Application 2019 & 2032
- Table 90: Rest of Middle East and Africa Industrial Rubber Market Revenue (Million) Forecast, by Application 2019 & 2032
Frequently Asked Questions
1. What is the projected Compound Annual Growth Rate (CAGR) of the Industrial Rubber Market?
The projected CAGR is approximately 3.81%.
2. Which companies are prominent players in the Industrial Rubber Market?
Key companies in the market include The Goodyear Tire & Rubber Company, Bando Chemical Industries LTD, UBE Corporation*List Not Exhaustive, China Petrochemical Corporation, THE YOKOHAMA RUBBER CO LTD, ENEOS Corporation, Trinseo, Denka Company Limited, SIBUR Holding PJSC, Rondex (Thailand) Co Ltd, AMMEGA, Bridgestone Corporation, TSRC.
3. What are the main segments of the Industrial Rubber Market?
The market segments include Application.
4. Can you provide details about the market size?
The market size is estimated to be USD 15.73 Million as of 2022.
5. What are some drivers contributing to market growth?
Increasing Application as Conveyor and Transmission Belts; Growing Demand for High-pressure Hoses.
6. What are the notable trends driving market growth?
Increasing Application as Conveyor and Transmission Belts.
7. Are there any restraints impacting market growth?
Stringent Environmental Regulations; Other Restraints.
8. Can you provide examples of recent developments in the market?
January 2024: AMMEGA Group announced an investment of USD 100 million in the Americas to expand the production of conveyor belts and improve the company's service capabilities.
9. What pricing options are available for accessing the report?
Pricing options include single-user, multi-user, and enterprise licenses priced at USD 4750, USD 5250, and USD 8750 respectively.
10. Is the market size provided in terms of value or volume?
The market size is provided in terms of value, measured in Million.
11. Are there any specific market keywords associated with the report?
Yes, the market keyword associated with the report is "Industrial Rubber Market," which aids in identifying and referencing the specific market segment covered.
12. How do I determine which pricing option suits my needs best?
The pricing options vary based on user requirements and access needs. Individual users may opt for single-user licenses, while businesses requiring broader access may choose multi-user or enterprise licenses for cost-effective access to the report.
13. Are there any additional resources or data provided in the Industrial Rubber Market report?
While the report offers comprehensive insights, it's advisable to review the specific contents or supplementary materials provided to ascertain if additional resources or data are available.
14. How can I stay updated on further developments or reports in the Industrial Rubber Market?
To stay informed about further developments, trends, and reports in the Industrial Rubber Market, consider subscribing to industry newsletters, following relevant companies and organizations, or regularly checking reputable industry news sources and publications.
Methodology
Step 1 - Identification of Relevant Samples Size from Population Database


Step 2 - Approaches for Defining Global Market Size (Value, Volume* & Price*)

Note*: In applicable scenarios
Step 3 - Data Sources
Primary Research
- Web Analytics
- Survey Reports
- Research Institute
- Latest Research Reports
- Opinion Leaders
Secondary Research
- Annual Reports
- White Paper
- Latest Press Release
- Industry Association
- Paid Database
- Investor Presentations

Step 4 - Data Triangulation
Involves using different sources of information in order to increase the validity of a study
These sources are likely to be stakeholders in a program - participants, other researchers, program staff, other community members, and so on.
Then we put all data in single framework & apply various statistical tools to find out the dynamic on the market.
During the analysis stage, feedback from the stakeholder groups would be compared to determine areas of agreement as well as areas of divergence
