

Key Insights
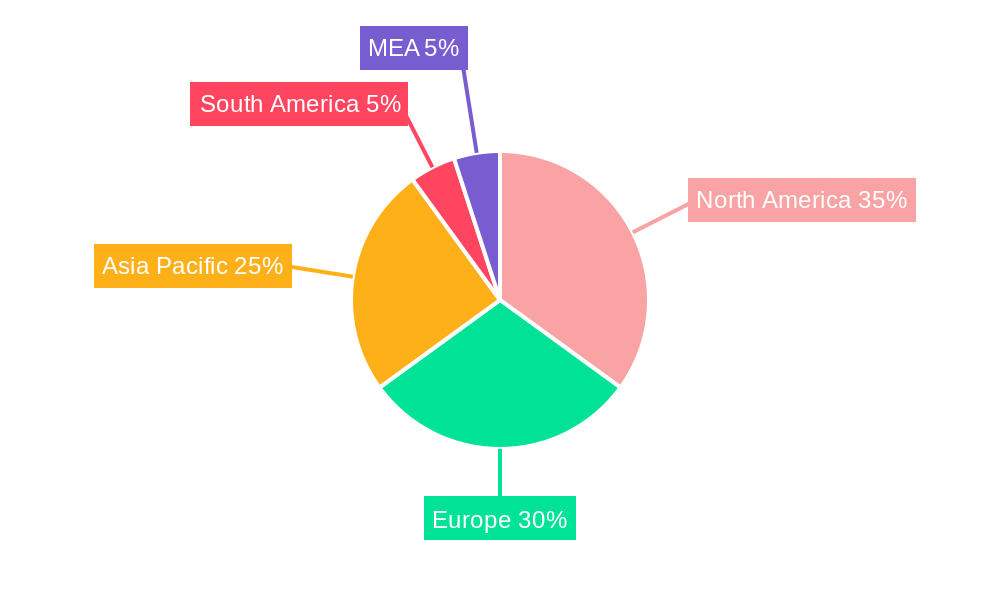
The high-performance polyamides (HPP) market is experiencing robust growth, driven by increasing demand across diverse end-use industries. A CAGR exceeding 6% indicates a significant expansion, projected to reach substantial market value by 2033. The automotive sector, fueled by lightweighting initiatives and the rising adoption of electric vehicles, is a major driver, followed by aerospace and defense, where HPP's high strength-to-weight ratio and resistance to extreme conditions are crucial. The medical industry's demand for biocompatible and durable materials for implants and devices further contributes to market expansion. Polyamide 11, known for its excellent elasticity and biodegradability, and polyphthalamides, valued for their high-temperature resistance, are key types fueling market growth. While raw material price fluctuations and supply chain complexities pose challenges, technological advancements in HPP synthesis and processing are mitigating these restraints. Regional growth is expected to be diverse, with North America and Asia-Pacific leading the way, driven by strong manufacturing bases and increasing consumer demand for advanced materials in respective regions. Competitive dynamics are intense, with established players like BASF, DuPont, and Solvay competing with emerging specialized manufacturers. The market's future hinges on continued innovation in material properties, expansion into novel applications, and sustainable manufacturing practices.
The market segmentation reveals significant opportunities within specific application areas. The automotive segment’s growth is linked to the increasing adoption of lightweight materials for improved fuel efficiency and performance. In aerospace and defense, the need for high-strength, lightweight components in aircraft and military equipment will drive continued demand. The medical sector’s demand for biocompatible materials is expected to see steady, albeit slower, growth due to stringent regulatory requirements. Technological advancements focusing on improving the biodegradability of HPPs while maintaining their mechanical properties present a lucrative avenue for future growth. Further, the emergence of new polyamide types with enhanced characteristics will attract new applications and contribute to overall market expansion in the forecast period. The geographical distribution of growth will continue to reflect existing manufacturing strengths and emerging economies' rising demand for advanced materials.
High-Performance Polyamides Industry Report: 2019-2033 Forecast
This comprehensive report provides an in-depth analysis of the High-Performance Polyamides industry, offering invaluable insights for stakeholders seeking to navigate this dynamic market. From market sizing and segmentation to competitive landscapes and future growth projections, this report equips you with the knowledge needed to make informed business decisions. Covering the period 2019-2033, with a base year of 2025 and a forecast period of 2025-2033, this study illuminates the key trends, challenges, and opportunities shaping the future of high-performance polyamides. The report projects a market value exceeding XX Million by 2033, driven by robust growth across various end-use sectors.
High-Performance Polyamides Industry Market Dynamics & Concentration
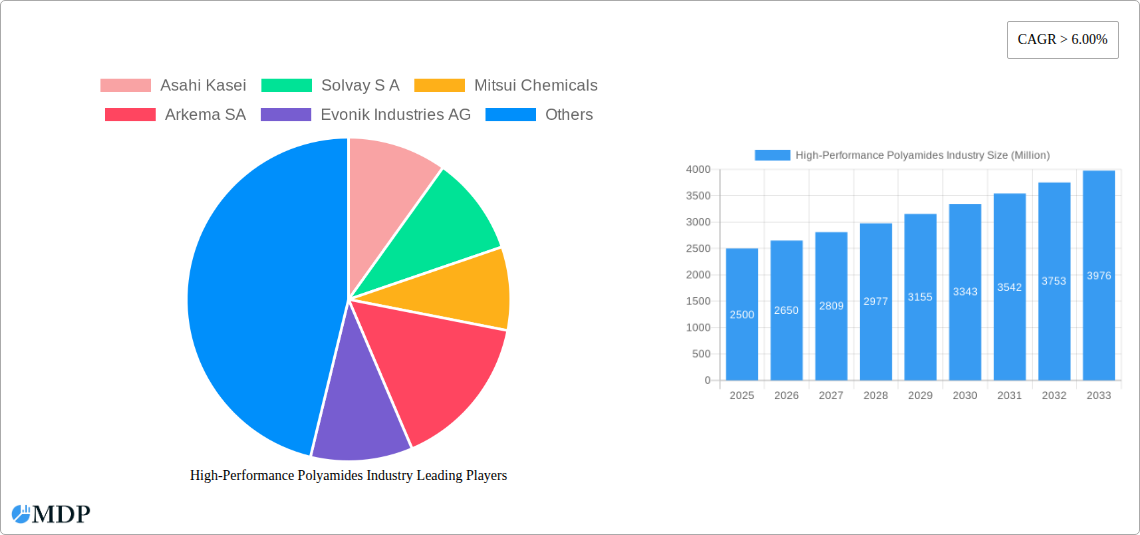
This section analyzes the competitive landscape of the high-performance polyamides market, exploring market concentration, innovation drivers, regulatory influences, and strategic activities. The market is characterized by a moderately concentrated structure, with key players such as Asahi Kasei, Solvay S.A., Mitsui Chemicals, Arkema S.A., Evonik Industries AG, Teknor Apex Company, Toray Industries Inc., BASF SE, DuPont, and Lanxess holding significant market share. The total market size in 2025 is estimated at XX Million.
- Market Share: The top 5 players account for approximately xx% of the global market share in 2025. Exact figures are detailed within the full report.
- M&A Activity: The historical period (2019-2024) witnessed xx M&A deals, primarily focused on expanding product portfolios and geographical reach. The forecast period is expected to see a similar level of activity.
- Innovation Drivers: Research and development efforts focused on enhancing material properties like strength, heat resistance, and chemical resistance are driving market innovation. Stringent regulatory requirements for specific applications (e.g., automotive safety standards) also spur innovation.
- Regulatory Frameworks: Government regulations concerning material safety and environmental impact are influencing the development and adoption of high-performance polyamides.
- Product Substitutes: Competition from other high-performance polymers, such as PEEK and PPS, necessitates continuous product improvement and innovation.
High-Performance Polyamides Industry Industry Trends & Analysis
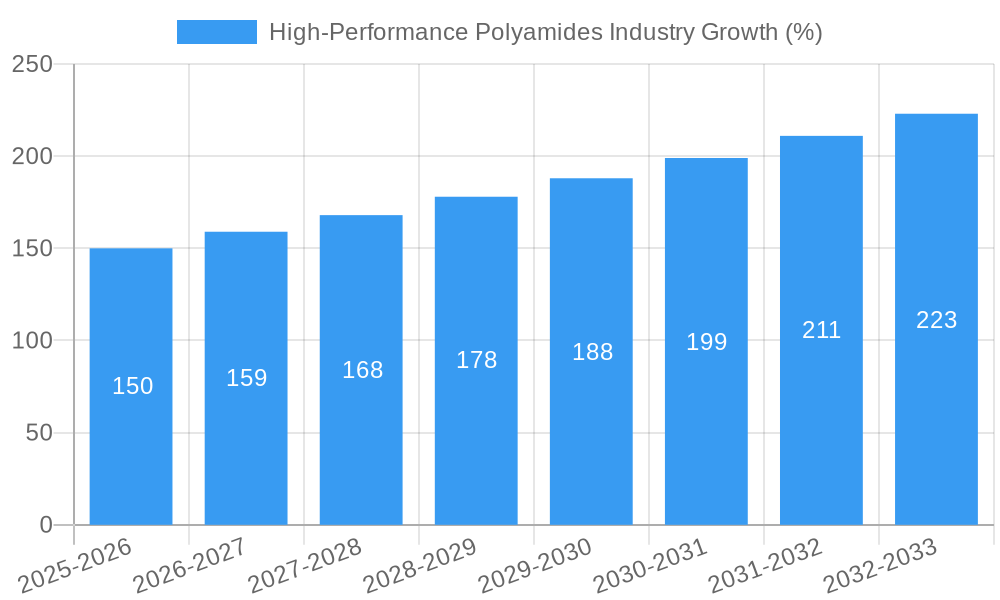
This section delves into the key trends shaping the high-performance polyamides market, encompassing market growth drivers, technological advancements, evolving consumer preferences, and the competitive dynamics at play. The industry is witnessing a CAGR of xx% during the forecast period (2025-2033), driven by the increasing demand from diverse end-use sectors. Market penetration of high-performance polyamides in specific applications, such as lightweight automotive components and high-performance electronics, is expected to significantly increase.
Technological disruptions, including advancements in additive manufacturing (3D printing) and the development of bio-based high-performance polyamides, are reshaping the industry landscape. Consumer preferences are shifting towards sustainable and environmentally friendly materials, which necessitates the development of bio-based and recyclable high-performance polyamides. The competitive landscape is characterized by intense competition among established players and emerging entrants, leading to strategic partnerships, joint ventures, and product diversification initiatives.
Leading Markets & Segments in High-Performance Polyamides Industry
This section identifies the dominant regions, countries, and segments within the high-performance polyamides market.
End-User Industries:
- Automotive: This segment is projected to be the largest end-user industry for high-performance polyamides, driven by the increasing demand for lightweight and high-strength components. Key growth drivers include stringent fuel efficiency regulations and the adoption of electric vehicles.
- Aerospace and Defense: This segment demonstrates strong growth potential due to the demand for high-performance materials with superior strength-to-weight ratios in aircraft and defense applications.
- Medical: The medical segment exhibits steady growth, driven by the need for biocompatible and high-performance materials in medical devices and implants.
- Other End-User Industries: This segment encompasses various applications such as sporting goods, consumer electronics, and industrial machinery, each exhibiting specific growth trajectories.
Types:
- Polyamide 11: This segment is witnessing substantial growth due to its excellent durability and biodegradability.
- Polyamide 46: This segment benefits from superior performance characteristics, driving its adoption in specialized applications.
- Polyphthalamides: This segment exhibits strong growth, particularly in high-temperature applications.
- Polyamide 6T: This segment has established a strong market presence due to its exceptional performance properties.
High-Performance Polyamides Industry Product Developments
Recent product innovations focus on enhancing the mechanical properties, thermal stability, and chemical resistance of high-performance polyamides. New grades with improved processability and enhanced sustainability profiles are gaining traction. These advancements expand applications into high-growth sectors like electric vehicles and medical devices, offering a competitive edge to manufacturers.
Key Drivers of High-Performance Polyamides Industry Growth
Several factors fuel the growth of the high-performance polyamides industry:
- Technological Advancements: Continuous innovations in polymer chemistry and manufacturing processes are driving the development of superior materials with enhanced properties.
- Economic Growth: The expanding global economy, particularly in emerging markets, is driving demand across various end-use sectors.
- Stringent Regulatory Requirements: Regulations promoting lightweighting and sustainable materials are encouraging the adoption of high-performance polyamides.
Challenges in the High-Performance Polyamides Industry Market
The industry faces challenges including:
- Raw Material Price Volatility: Fluctuations in raw material prices impact production costs and profitability.
- Intense Competition: The presence of numerous established and emerging players creates a competitive market.
- Supply Chain Disruptions: Global supply chain uncertainties can lead to production delays and cost increases.
Emerging Opportunities in High-Performance Polyamides Industry
Emerging opportunities include:
- Bio-based High-Performance Polyamides: The increasing demand for sustainable materials presents significant growth prospects.
- Additive Manufacturing: 3D printing technologies are expanding the range of applications for high-performance polyamides.
- Strategic Partnerships: Collaborations among industry players are driving innovation and market penetration.
Leading Players in the High-Performance Polyamides Industry Sector
- Asahi Kasei
- Solvay S.A.
- Mitsui Chemicals
- Arkema S.A.
- Evonik Industries AG
- Teknor Apex Company
- Toray Industries Inc.
- BASF SE
- DuPont
- Lanxess
Key Milestones in High-Performance Polyamides Industry Industry
- 2020: X Company launched a new grade of polyamide 11 with enhanced biodegradability.
- 2022: Y Company announced a significant investment in expanding its production capacity for polyphthalamides.
- 2023: A major merger between two key players reshaped the market landscape. (Further details within the report).
Strategic Outlook for High-Performance Polyamides Industry Market
The future of the high-performance polyamides market looks promising. Continuous innovation, expanding applications, and the increasing demand for sustainable materials will drive substantial growth in the coming years. Strategic partnerships, investment in R&D, and effective supply chain management will be crucial for success in this competitive market. The market is poised for significant expansion, driven by the confluence of technological advancements and growing demand across diverse sectors.
High-Performance Polyamides Industry Segmentation
-
1. Type
- 1.1. Polyamide 11
- 1.2. Polyamide 46
- 1.3. Polyphthalamides
- 1.4. Polyamide 6T
- 1.5. Other Types
-
2. End-user Industry
- 2.1. Automotive
- 2.2. Aerospace and Defense
- 2.3. Medical
- 2.4. Industrial
- 2.5. Electrical and Electronics
- 2.6. Other End-user Industries
High-Performance Polyamides Industry Segmentation By Geography
-
1. Asia Pacific
- 1.1. China
- 1.2. India
- 1.3. Japan
- 1.4. South Korea
- 1.5. Rest of Asia Pacific
-
2. North America
- 2.1. United States
- 2.2. Canada
- 2.3. Mexico
-
3. Europe
- 3.1. Germany
- 3.2. United Kingdom
- 3.3. France
- 3.4. Italy
- 3.5. Rest of Europe
-
4. South America
- 4.1. Brazil
- 4.2. Argentina
- 4.3. Rest of South America
-
5. Middle East and Africa
- 5.1. Saudi Arabia
- 5.2. South Africa
- 5.3. Rest of Middle East and Africa
High-Performance Polyamides Industry REPORT HIGHLIGHTS
| Aspects | Details |
|---|---|
| Study Period | 2019-2033 |
| Base Year | 2024 |
| Estimated Year | 2025 |
| Forecast Period | 2025-2033 |
| Historical Period | 2019-2024 |
| Growth Rate | CAGR of > 6.00% from 2019-2033 |
| Segmentation |
|
Table of Contents
- 1. Introduction
- 1.1. Research Scope
- 1.2. Market Segmentation
- 1.3. Research Methodology
- 1.4. Definitions and Assumptions
- 2. Executive Summary
- 2.1. Introduction
- 3. Market Dynamics
- 3.1. Introduction
- 3.2. Market Drivers
- 3.2.1. ; Increasing Applications for High-Performance Polymers; Growing Demand from the Automobile Industry
- 3.3. Market Restrains
- 3.3.1. ; High cost and Impact of COVID-19; Other Restraints
- 3.4. Market Trends
- 3.4.1. Growing Demand from Automobile Sector
- 4. Market Factor Analysis
- 4.1. Porters Five Forces
- 4.2. Supply/Value Chain
- 4.3. PESTEL analysis
- 4.4. Market Entropy
- 4.5. Patent/Trademark Analysis
- 5. Global High-Performance Polyamides Industry Analysis, Insights and Forecast, 2019-2031
- 5.1. Market Analysis, Insights and Forecast - by Type
- 5.1.1. Polyamide 11
- 5.1.2. Polyamide 46
- 5.1.3. Polyphthalamides
- 5.1.4. Polyamide 6T
- 5.1.5. Other Types
- 5.2. Market Analysis, Insights and Forecast - by End-user Industry
- 5.2.1. Automotive
- 5.2.2. Aerospace and Defense
- 5.2.3. Medical
- 5.2.4. Industrial
- 5.2.5. Electrical and Electronics
- 5.2.6. Other End-user Industries
- 5.3. Market Analysis, Insights and Forecast - by Region
- 5.3.1. Asia Pacific
- 5.3.2. North America
- 5.3.3. Europe
- 5.3.4. South America
- 5.3.5. Middle East and Africa
- 5.1. Market Analysis, Insights and Forecast - by Type
- 6. Asia Pacific High-Performance Polyamides Industry Analysis, Insights and Forecast, 2019-2031
- 6.1. Market Analysis, Insights and Forecast - by Type
- 6.1.1. Polyamide 11
- 6.1.2. Polyamide 46
- 6.1.3. Polyphthalamides
- 6.1.4. Polyamide 6T
- 6.1.5. Other Types
- 6.2. Market Analysis, Insights and Forecast - by End-user Industry
- 6.2.1. Automotive
- 6.2.2. Aerospace and Defense
- 6.2.3. Medical
- 6.2.4. Industrial
- 6.2.5. Electrical and Electronics
- 6.2.6. Other End-user Industries
- 6.1. Market Analysis, Insights and Forecast - by Type
- 7. North America High-Performance Polyamides Industry Analysis, Insights and Forecast, 2019-2031
- 7.1. Market Analysis, Insights and Forecast - by Type
- 7.1.1. Polyamide 11
- 7.1.2. Polyamide 46
- 7.1.3. Polyphthalamides
- 7.1.4. Polyamide 6T
- 7.1.5. Other Types
- 7.2. Market Analysis, Insights and Forecast - by End-user Industry
- 7.2.1. Automotive
- 7.2.2. Aerospace and Defense
- 7.2.3. Medical
- 7.2.4. Industrial
- 7.2.5. Electrical and Electronics
- 7.2.6. Other End-user Industries
- 7.1. Market Analysis, Insights and Forecast - by Type
- 8. Europe High-Performance Polyamides Industry Analysis, Insights and Forecast, 2019-2031
- 8.1. Market Analysis, Insights and Forecast - by Type
- 8.1.1. Polyamide 11
- 8.1.2. Polyamide 46
- 8.1.3. Polyphthalamides
- 8.1.4. Polyamide 6T
- 8.1.5. Other Types
- 8.2. Market Analysis, Insights and Forecast - by End-user Industry
- 8.2.1. Automotive
- 8.2.2. Aerospace and Defense
- 8.2.3. Medical
- 8.2.4. Industrial
- 8.2.5. Electrical and Electronics
- 8.2.6. Other End-user Industries
- 8.1. Market Analysis, Insights and Forecast - by Type
- 9. South America High-Performance Polyamides Industry Analysis, Insights and Forecast, 2019-2031
- 9.1. Market Analysis, Insights and Forecast - by Type
- 9.1.1. Polyamide 11
- 9.1.2. Polyamide 46
- 9.1.3. Polyphthalamides
- 9.1.4. Polyamide 6T
- 9.1.5. Other Types
- 9.2. Market Analysis, Insights and Forecast - by End-user Industry
- 9.2.1. Automotive
- 9.2.2. Aerospace and Defense
- 9.2.3. Medical
- 9.2.4. Industrial
- 9.2.5. Electrical and Electronics
- 9.2.6. Other End-user Industries
- 9.1. Market Analysis, Insights and Forecast - by Type
- 10. Middle East and Africa High-Performance Polyamides Industry Analysis, Insights and Forecast, 2019-2031
- 10.1. Market Analysis, Insights and Forecast - by Type
- 10.1.1. Polyamide 11
- 10.1.2. Polyamide 46
- 10.1.3. Polyphthalamides
- 10.1.4. Polyamide 6T
- 10.1.5. Other Types
- 10.2. Market Analysis, Insights and Forecast - by End-user Industry
- 10.2.1. Automotive
- 10.2.2. Aerospace and Defense
- 10.2.3. Medical
- 10.2.4. Industrial
- 10.2.5. Electrical and Electronics
- 10.2.6. Other End-user Industries
- 10.1. Market Analysis, Insights and Forecast - by Type
- 11. North America High-Performance Polyamides Industry Analysis, Insights and Forecast, 2019-2031
- 11.1. Market Analysis, Insights and Forecast - By Country/Sub-region
- 11.1.1 United States
- 11.1.2 Canada
- 11.1.3 Mexico
- 12. Europe High-Performance Polyamides Industry Analysis, Insights and Forecast, 2019-2031
- 12.1. Market Analysis, Insights and Forecast - By Country/Sub-region
- 12.1.1 Germany
- 12.1.2 France
- 12.1.3 Italy
- 12.1.4 United Kingdom
- 12.1.5 Netherlands
- 12.1.6 Rest of Europe
- 13. Asia Pacific High-Performance Polyamides Industry Analysis, Insights and Forecast, 2019-2031
- 13.1. Market Analysis, Insights and Forecast - By Country/Sub-region
- 13.1.1 China
- 13.1.2 Japan
- 13.1.3 India
- 13.1.4 South Korea
- 13.1.5 Taiwan
- 13.1.6 Australia
- 13.1.7 Rest of Asia-Pacific
- 14. South America High-Performance Polyamides Industry Analysis, Insights and Forecast, 2019-2031
- 14.1. Market Analysis, Insights and Forecast - By Country/Sub-region
- 14.1.1 Brazil
- 14.1.2 Argentina
- 14.1.3 Rest of South America
- 15. MEA High-Performance Polyamides Industry Analysis, Insights and Forecast, 2019-2031
- 15.1. Market Analysis, Insights and Forecast - By Country/Sub-region
- 15.1.1 Middle East
- 15.1.2 Africa
- 16. Competitive Analysis
- 16.1. Global Market Share Analysis 2024
- 16.2. Company Profiles
- 16.2.1 Asahi Kasei
- 16.2.1.1. Overview
- 16.2.1.2. Products
- 16.2.1.3. SWOT Analysis
- 16.2.1.4. Recent Developments
- 16.2.1.5. Financials (Based on Availability)
- 16.2.2 Solvay S A
- 16.2.2.1. Overview
- 16.2.2.2. Products
- 16.2.2.3. SWOT Analysis
- 16.2.2.4. Recent Developments
- 16.2.2.5. Financials (Based on Availability)
- 16.2.3 Mitsui Chemicals
- 16.2.3.1. Overview
- 16.2.3.2. Products
- 16.2.3.3. SWOT Analysis
- 16.2.3.4. Recent Developments
- 16.2.3.5. Financials (Based on Availability)
- 16.2.4 Arkema SA
- 16.2.4.1. Overview
- 16.2.4.2. Products
- 16.2.4.3. SWOT Analysis
- 16.2.4.4. Recent Developments
- 16.2.4.5. Financials (Based on Availability)
- 16.2.5 Evonik Industries AG
- 16.2.5.1. Overview
- 16.2.5.2. Products
- 16.2.5.3. SWOT Analysis
- 16.2.5.4. Recent Developments
- 16.2.5.5. Financials (Based on Availability)
- 16.2.6 Teknor Apex Company
- 16.2.6.1. Overview
- 16.2.6.2. Products
- 16.2.6.3. SWOT Analysis
- 16.2.6.4. Recent Developments
- 16.2.6.5. Financials (Based on Availability)
- 16.2.7 Toray Industries Inc
- 16.2.7.1. Overview
- 16.2.7.2. Products
- 16.2.7.3. SWOT Analysis
- 16.2.7.4. Recent Developments
- 16.2.7.5. Financials (Based on Availability)
- 16.2.8 BASF SE
- 16.2.8.1. Overview
- 16.2.8.2. Products
- 16.2.8.3. SWOT Analysis
- 16.2.8.4. Recent Developments
- 16.2.8.5. Financials (Based on Availability)
- 16.2.9 DuPont
- 16.2.9.1. Overview
- 16.2.9.2. Products
- 16.2.9.3. SWOT Analysis
- 16.2.9.4. Recent Developments
- 16.2.9.5. Financials (Based on Availability)
- 16.2.10 Lanxess
- 16.2.10.1. Overview
- 16.2.10.2. Products
- 16.2.10.3. SWOT Analysis
- 16.2.10.4. Recent Developments
- 16.2.10.5. Financials (Based on Availability)
- 16.2.1 Asahi Kasei
List of Figures
- Figure 1: Global High-Performance Polyamides Industry Revenue Breakdown (Million, %) by Region 2024 & 2032
- Figure 2: Global High-Performance Polyamides Industry Volume Breakdown (K Tons, %) by Region 2024 & 2032
- Figure 3: North America High-Performance Polyamides Industry Revenue (Million), by Country 2024 & 2032
- Figure 4: North America High-Performance Polyamides Industry Volume (K Tons), by Country 2024 & 2032
- Figure 5: North America High-Performance Polyamides Industry Revenue Share (%), by Country 2024 & 2032
- Figure 6: North America High-Performance Polyamides Industry Volume Share (%), by Country 2024 & 2032
- Figure 7: Europe High-Performance Polyamides Industry Revenue (Million), by Country 2024 & 2032
- Figure 8: Europe High-Performance Polyamides Industry Volume (K Tons), by Country 2024 & 2032
- Figure 9: Europe High-Performance Polyamides Industry Revenue Share (%), by Country 2024 & 2032
- Figure 10: Europe High-Performance Polyamides Industry Volume Share (%), by Country 2024 & 2032
- Figure 11: Asia Pacific High-Performance Polyamides Industry Revenue (Million), by Country 2024 & 2032
- Figure 12: Asia Pacific High-Performance Polyamides Industry Volume (K Tons), by Country 2024 & 2032
- Figure 13: Asia Pacific High-Performance Polyamides Industry Revenue Share (%), by Country 2024 & 2032
- Figure 14: Asia Pacific High-Performance Polyamides Industry Volume Share (%), by Country 2024 & 2032
- Figure 15: South America High-Performance Polyamides Industry Revenue (Million), by Country 2024 & 2032
- Figure 16: South America High-Performance Polyamides Industry Volume (K Tons), by Country 2024 & 2032
- Figure 17: South America High-Performance Polyamides Industry Revenue Share (%), by Country 2024 & 2032
- Figure 18: South America High-Performance Polyamides Industry Volume Share (%), by Country 2024 & 2032
- Figure 19: MEA High-Performance Polyamides Industry Revenue (Million), by Country 2024 & 2032
- Figure 20: MEA High-Performance Polyamides Industry Volume (K Tons), by Country 2024 & 2032
- Figure 21: MEA High-Performance Polyamides Industry Revenue Share (%), by Country 2024 & 2032
- Figure 22: MEA High-Performance Polyamides Industry Volume Share (%), by Country 2024 & 2032
- Figure 23: Asia Pacific High-Performance Polyamides Industry Revenue (Million), by Type 2024 & 2032
- Figure 24: Asia Pacific High-Performance Polyamides Industry Volume (K Tons), by Type 2024 & 2032
- Figure 25: Asia Pacific High-Performance Polyamides Industry Revenue Share (%), by Type 2024 & 2032
- Figure 26: Asia Pacific High-Performance Polyamides Industry Volume Share (%), by Type 2024 & 2032
- Figure 27: Asia Pacific High-Performance Polyamides Industry Revenue (Million), by End-user Industry 2024 & 2032
- Figure 28: Asia Pacific High-Performance Polyamides Industry Volume (K Tons), by End-user Industry 2024 & 2032
- Figure 29: Asia Pacific High-Performance Polyamides Industry Revenue Share (%), by End-user Industry 2024 & 2032
- Figure 30: Asia Pacific High-Performance Polyamides Industry Volume Share (%), by End-user Industry 2024 & 2032
- Figure 31: Asia Pacific High-Performance Polyamides Industry Revenue (Million), by Country 2024 & 2032
- Figure 32: Asia Pacific High-Performance Polyamides Industry Volume (K Tons), by Country 2024 & 2032
- Figure 33: Asia Pacific High-Performance Polyamides Industry Revenue Share (%), by Country 2024 & 2032
- Figure 34: Asia Pacific High-Performance Polyamides Industry Volume Share (%), by Country 2024 & 2032
- Figure 35: North America High-Performance Polyamides Industry Revenue (Million), by Type 2024 & 2032
- Figure 36: North America High-Performance Polyamides Industry Volume (K Tons), by Type 2024 & 2032
- Figure 37: North America High-Performance Polyamides Industry Revenue Share (%), by Type 2024 & 2032
- Figure 38: North America High-Performance Polyamides Industry Volume Share (%), by Type 2024 & 2032
- Figure 39: North America High-Performance Polyamides Industry Revenue (Million), by End-user Industry 2024 & 2032
- Figure 40: North America High-Performance Polyamides Industry Volume (K Tons), by End-user Industry 2024 & 2032
- Figure 41: North America High-Performance Polyamides Industry Revenue Share (%), by End-user Industry 2024 & 2032
- Figure 42: North America High-Performance Polyamides Industry Volume Share (%), by End-user Industry 2024 & 2032
- Figure 43: North America High-Performance Polyamides Industry Revenue (Million), by Country 2024 & 2032
- Figure 44: North America High-Performance Polyamides Industry Volume (K Tons), by Country 2024 & 2032
- Figure 45: North America High-Performance Polyamides Industry Revenue Share (%), by Country 2024 & 2032
- Figure 46: North America High-Performance Polyamides Industry Volume Share (%), by Country 2024 & 2032
- Figure 47: Europe High-Performance Polyamides Industry Revenue (Million), by Type 2024 & 2032
- Figure 48: Europe High-Performance Polyamides Industry Volume (K Tons), by Type 2024 & 2032
- Figure 49: Europe High-Performance Polyamides Industry Revenue Share (%), by Type 2024 & 2032
- Figure 50: Europe High-Performance Polyamides Industry Volume Share (%), by Type 2024 & 2032
- Figure 51: Europe High-Performance Polyamides Industry Revenue (Million), by End-user Industry 2024 & 2032
- Figure 52: Europe High-Performance Polyamides Industry Volume (K Tons), by End-user Industry 2024 & 2032
- Figure 53: Europe High-Performance Polyamides Industry Revenue Share (%), by End-user Industry 2024 & 2032
- Figure 54: Europe High-Performance Polyamides Industry Volume Share (%), by End-user Industry 2024 & 2032
- Figure 55: Europe High-Performance Polyamides Industry Revenue (Million), by Country 2024 & 2032
- Figure 56: Europe High-Performance Polyamides Industry Volume (K Tons), by Country 2024 & 2032
- Figure 57: Europe High-Performance Polyamides Industry Revenue Share (%), by Country 2024 & 2032
- Figure 58: Europe High-Performance Polyamides Industry Volume Share (%), by Country 2024 & 2032
- Figure 59: South America High-Performance Polyamides Industry Revenue (Million), by Type 2024 & 2032
- Figure 60: South America High-Performance Polyamides Industry Volume (K Tons), by Type 2024 & 2032
- Figure 61: South America High-Performance Polyamides Industry Revenue Share (%), by Type 2024 & 2032
- Figure 62: South America High-Performance Polyamides Industry Volume Share (%), by Type 2024 & 2032
- Figure 63: South America High-Performance Polyamides Industry Revenue (Million), by End-user Industry 2024 & 2032
- Figure 64: South America High-Performance Polyamides Industry Volume (K Tons), by End-user Industry 2024 & 2032
- Figure 65: South America High-Performance Polyamides Industry Revenue Share (%), by End-user Industry 2024 & 2032
- Figure 66: South America High-Performance Polyamides Industry Volume Share (%), by End-user Industry 2024 & 2032
- Figure 67: South America High-Performance Polyamides Industry Revenue (Million), by Country 2024 & 2032
- Figure 68: South America High-Performance Polyamides Industry Volume (K Tons), by Country 2024 & 2032
- Figure 69: South America High-Performance Polyamides Industry Revenue Share (%), by Country 2024 & 2032
- Figure 70: South America High-Performance Polyamides Industry Volume Share (%), by Country 2024 & 2032
- Figure 71: Middle East and Africa High-Performance Polyamides Industry Revenue (Million), by Type 2024 & 2032
- Figure 72: Middle East and Africa High-Performance Polyamides Industry Volume (K Tons), by Type 2024 & 2032
- Figure 73: Middle East and Africa High-Performance Polyamides Industry Revenue Share (%), by Type 2024 & 2032
- Figure 74: Middle East and Africa High-Performance Polyamides Industry Volume Share (%), by Type 2024 & 2032
- Figure 75: Middle East and Africa High-Performance Polyamides Industry Revenue (Million), by End-user Industry 2024 & 2032
- Figure 76: Middle East and Africa High-Performance Polyamides Industry Volume (K Tons), by End-user Industry 2024 & 2032
- Figure 77: Middle East and Africa High-Performance Polyamides Industry Revenue Share (%), by End-user Industry 2024 & 2032
- Figure 78: Middle East and Africa High-Performance Polyamides Industry Volume Share (%), by End-user Industry 2024 & 2032
- Figure 79: Middle East and Africa High-Performance Polyamides Industry Revenue (Million), by Country 2024 & 2032
- Figure 80: Middle East and Africa High-Performance Polyamides Industry Volume (K Tons), by Country 2024 & 2032
- Figure 81: Middle East and Africa High-Performance Polyamides Industry Revenue Share (%), by Country 2024 & 2032
- Figure 82: Middle East and Africa High-Performance Polyamides Industry Volume Share (%), by Country 2024 & 2032
List of Tables
- Table 1: Global High-Performance Polyamides Industry Revenue Million Forecast, by Region 2019 & 2032
- Table 2: Global High-Performance Polyamides Industry Volume K Tons Forecast, by Region 2019 & 2032
- Table 3: Global High-Performance Polyamides Industry Revenue Million Forecast, by Type 2019 & 2032
- Table 4: Global High-Performance Polyamides Industry Volume K Tons Forecast, by Type 2019 & 2032
- Table 5: Global High-Performance Polyamides Industry Revenue Million Forecast, by End-user Industry 2019 & 2032
- Table 6: Global High-Performance Polyamides Industry Volume K Tons Forecast, by End-user Industry 2019 & 2032
- Table 7: Global High-Performance Polyamides Industry Revenue Million Forecast, by Region 2019 & 2032
- Table 8: Global High-Performance Polyamides Industry Volume K Tons Forecast, by Region 2019 & 2032
- Table 9: Global High-Performance Polyamides Industry Revenue Million Forecast, by Country 2019 & 2032
- Table 10: Global High-Performance Polyamides Industry Volume K Tons Forecast, by Country 2019 & 2032
- Table 11: United States High-Performance Polyamides Industry Revenue (Million) Forecast, by Application 2019 & 2032
- Table 12: United States High-Performance Polyamides Industry Volume (K Tons) Forecast, by Application 2019 & 2032
- Table 13: Canada High-Performance Polyamides Industry Revenue (Million) Forecast, by Application 2019 & 2032
- Table 14: Canada High-Performance Polyamides Industry Volume (K Tons) Forecast, by Application 2019 & 2032
- Table 15: Mexico High-Performance Polyamides Industry Revenue (Million) Forecast, by Application 2019 & 2032
- Table 16: Mexico High-Performance Polyamides Industry Volume (K Tons) Forecast, by Application 2019 & 2032
- Table 17: Global High-Performance Polyamides Industry Revenue Million Forecast, by Country 2019 & 2032
- Table 18: Global High-Performance Polyamides Industry Volume K Tons Forecast, by Country 2019 & 2032
- Table 19: Germany High-Performance Polyamides Industry Revenue (Million) Forecast, by Application 2019 & 2032
- Table 20: Germany High-Performance Polyamides Industry Volume (K Tons) Forecast, by Application 2019 & 2032
- Table 21: France High-Performance Polyamides Industry Revenue (Million) Forecast, by Application 2019 & 2032
- Table 22: France High-Performance Polyamides Industry Volume (K Tons) Forecast, by Application 2019 & 2032
- Table 23: Italy High-Performance Polyamides Industry Revenue (Million) Forecast, by Application 2019 & 2032
- Table 24: Italy High-Performance Polyamides Industry Volume (K Tons) Forecast, by Application 2019 & 2032
- Table 25: United Kingdom High-Performance Polyamides Industry Revenue (Million) Forecast, by Application 2019 & 2032
- Table 26: United Kingdom High-Performance Polyamides Industry Volume (K Tons) Forecast, by Application 2019 & 2032
- Table 27: Netherlands High-Performance Polyamides Industry Revenue (Million) Forecast, by Application 2019 & 2032
- Table 28: Netherlands High-Performance Polyamides Industry Volume (K Tons) Forecast, by Application 2019 & 2032
- Table 29: Rest of Europe High-Performance Polyamides Industry Revenue (Million) Forecast, by Application 2019 & 2032
- Table 30: Rest of Europe High-Performance Polyamides Industry Volume (K Tons) Forecast, by Application 2019 & 2032
- Table 31: Global High-Performance Polyamides Industry Revenue Million Forecast, by Country 2019 & 2032
- Table 32: Global High-Performance Polyamides Industry Volume K Tons Forecast, by Country 2019 & 2032
- Table 33: China High-Performance Polyamides Industry Revenue (Million) Forecast, by Application 2019 & 2032
- Table 34: China High-Performance Polyamides Industry Volume (K Tons) Forecast, by Application 2019 & 2032
- Table 35: Japan High-Performance Polyamides Industry Revenue (Million) Forecast, by Application 2019 & 2032
- Table 36: Japan High-Performance Polyamides Industry Volume (K Tons) Forecast, by Application 2019 & 2032
- Table 37: India High-Performance Polyamides Industry Revenue (Million) Forecast, by Application 2019 & 2032
- Table 38: India High-Performance Polyamides Industry Volume (K Tons) Forecast, by Application 2019 & 2032
- Table 39: South Korea High-Performance Polyamides Industry Revenue (Million) Forecast, by Application 2019 & 2032
- Table 40: South Korea High-Performance Polyamides Industry Volume (K Tons) Forecast, by Application 2019 & 2032
- Table 41: Taiwan High-Performance Polyamides Industry Revenue (Million) Forecast, by Application 2019 & 2032
- Table 42: Taiwan High-Performance Polyamides Industry Volume (K Tons) Forecast, by Application 2019 & 2032
- Table 43: Australia High-Performance Polyamides Industry Revenue (Million) Forecast, by Application 2019 & 2032
- Table 44: Australia High-Performance Polyamides Industry Volume (K Tons) Forecast, by Application 2019 & 2032
- Table 45: Rest of Asia-Pacific High-Performance Polyamides Industry Revenue (Million) Forecast, by Application 2019 & 2032
- Table 46: Rest of Asia-Pacific High-Performance Polyamides Industry Volume (K Tons) Forecast, by Application 2019 & 2032
- Table 47: Global High-Performance Polyamides Industry Revenue Million Forecast, by Country 2019 & 2032
- Table 48: Global High-Performance Polyamides Industry Volume K Tons Forecast, by Country 2019 & 2032
- Table 49: Brazil High-Performance Polyamides Industry Revenue (Million) Forecast, by Application 2019 & 2032
- Table 50: Brazil High-Performance Polyamides Industry Volume (K Tons) Forecast, by Application 2019 & 2032
- Table 51: Argentina High-Performance Polyamides Industry Revenue (Million) Forecast, by Application 2019 & 2032
- Table 52: Argentina High-Performance Polyamides Industry Volume (K Tons) Forecast, by Application 2019 & 2032
- Table 53: Rest of South America High-Performance Polyamides Industry Revenue (Million) Forecast, by Application 2019 & 2032
- Table 54: Rest of South America High-Performance Polyamides Industry Volume (K Tons) Forecast, by Application 2019 & 2032
- Table 55: Global High-Performance Polyamides Industry Revenue Million Forecast, by Country 2019 & 2032
- Table 56: Global High-Performance Polyamides Industry Volume K Tons Forecast, by Country 2019 & 2032
- Table 57: Middle East High-Performance Polyamides Industry Revenue (Million) Forecast, by Application 2019 & 2032
- Table 58: Middle East High-Performance Polyamides Industry Volume (K Tons) Forecast, by Application 2019 & 2032
- Table 59: Africa High-Performance Polyamides Industry Revenue (Million) Forecast, by Application 2019 & 2032
- Table 60: Africa High-Performance Polyamides Industry Volume (K Tons) Forecast, by Application 2019 & 2032
- Table 61: Global High-Performance Polyamides Industry Revenue Million Forecast, by Type 2019 & 2032
- Table 62: Global High-Performance Polyamides Industry Volume K Tons Forecast, by Type 2019 & 2032
- Table 63: Global High-Performance Polyamides Industry Revenue Million Forecast, by End-user Industry 2019 & 2032
- Table 64: Global High-Performance Polyamides Industry Volume K Tons Forecast, by End-user Industry 2019 & 2032
- Table 65: Global High-Performance Polyamides Industry Revenue Million Forecast, by Country 2019 & 2032
- Table 66: Global High-Performance Polyamides Industry Volume K Tons Forecast, by Country 2019 & 2032
- Table 67: China High-Performance Polyamides Industry Revenue (Million) Forecast, by Application 2019 & 2032
- Table 68: China High-Performance Polyamides Industry Volume (K Tons) Forecast, by Application 2019 & 2032
- Table 69: India High-Performance Polyamides Industry Revenue (Million) Forecast, by Application 2019 & 2032
- Table 70: India High-Performance Polyamides Industry Volume (K Tons) Forecast, by Application 2019 & 2032
- Table 71: Japan High-Performance Polyamides Industry Revenue (Million) Forecast, by Application 2019 & 2032
- Table 72: Japan High-Performance Polyamides Industry Volume (K Tons) Forecast, by Application 2019 & 2032
- Table 73: South Korea High-Performance Polyamides Industry Revenue (Million) Forecast, by Application 2019 & 2032
- Table 74: South Korea High-Performance Polyamides Industry Volume (K Tons) Forecast, by Application 2019 & 2032
- Table 75: Rest of Asia Pacific High-Performance Polyamides Industry Revenue (Million) Forecast, by Application 2019 & 2032
- Table 76: Rest of Asia Pacific High-Performance Polyamides Industry Volume (K Tons) Forecast, by Application 2019 & 2032
- Table 77: Global High-Performance Polyamides Industry Revenue Million Forecast, by Type 2019 & 2032
- Table 78: Global High-Performance Polyamides Industry Volume K Tons Forecast, by Type 2019 & 2032
- Table 79: Global High-Performance Polyamides Industry Revenue Million Forecast, by End-user Industry 2019 & 2032
- Table 80: Global High-Performance Polyamides Industry Volume K Tons Forecast, by End-user Industry 2019 & 2032
- Table 81: Global High-Performance Polyamides Industry Revenue Million Forecast, by Country 2019 & 2032
- Table 82: Global High-Performance Polyamides Industry Volume K Tons Forecast, by Country 2019 & 2032
- Table 83: United States High-Performance Polyamides Industry Revenue (Million) Forecast, by Application 2019 & 2032
- Table 84: United States High-Performance Polyamides Industry Volume (K Tons) Forecast, by Application 2019 & 2032
- Table 85: Canada High-Performance Polyamides Industry Revenue (Million) Forecast, by Application 2019 & 2032
- Table 86: Canada High-Performance Polyamides Industry Volume (K Tons) Forecast, by Application 2019 & 2032
- Table 87: Mexico High-Performance Polyamides Industry Revenue (Million) Forecast, by Application 2019 & 2032
- Table 88: Mexico High-Performance Polyamides Industry Volume (K Tons) Forecast, by Application 2019 & 2032
- Table 89: Global High-Performance Polyamides Industry Revenue Million Forecast, by Type 2019 & 2032
- Table 90: Global High-Performance Polyamides Industry Volume K Tons Forecast, by Type 2019 & 2032
- Table 91: Global High-Performance Polyamides Industry Revenue Million Forecast, by End-user Industry 2019 & 2032
- Table 92: Global High-Performance Polyamides Industry Volume K Tons Forecast, by End-user Industry 2019 & 2032
- Table 93: Global High-Performance Polyamides Industry Revenue Million Forecast, by Country 2019 & 2032
- Table 94: Global High-Performance Polyamides Industry Volume K Tons Forecast, by Country 2019 & 2032
- Table 95: Germany High-Performance Polyamides Industry Revenue (Million) Forecast, by Application 2019 & 2032
- Table 96: Germany High-Performance Polyamides Industry Volume (K Tons) Forecast, by Application 2019 & 2032
- Table 97: United Kingdom High-Performance Polyamides Industry Revenue (Million) Forecast, by Application 2019 & 2032
- Table 98: United Kingdom High-Performance Polyamides Industry Volume (K Tons) Forecast, by Application 2019 & 2032
- Table 99: France High-Performance Polyamides Industry Revenue (Million) Forecast, by Application 2019 & 2032
- Table 100: France High-Performance Polyamides Industry Volume (K Tons) Forecast, by Application 2019 & 2032
- Table 101: Italy High-Performance Polyamides Industry Revenue (Million) Forecast, by Application 2019 & 2032
- Table 102: Italy High-Performance Polyamides Industry Volume (K Tons) Forecast, by Application 2019 & 2032
- Table 103: Rest of Europe High-Performance Polyamides Industry Revenue (Million) Forecast, by Application 2019 & 2032
- Table 104: Rest of Europe High-Performance Polyamides Industry Volume (K Tons) Forecast, by Application 2019 & 2032
- Table 105: Global High-Performance Polyamides Industry Revenue Million Forecast, by Type 2019 & 2032
- Table 106: Global High-Performance Polyamides Industry Volume K Tons Forecast, by Type 2019 & 2032
- Table 107: Global High-Performance Polyamides Industry Revenue Million Forecast, by End-user Industry 2019 & 2032
- Table 108: Global High-Performance Polyamides Industry Volume K Tons Forecast, by End-user Industry 2019 & 2032
- Table 109: Global High-Performance Polyamides Industry Revenue Million Forecast, by Country 2019 & 2032
- Table 110: Global High-Performance Polyamides Industry Volume K Tons Forecast, by Country 2019 & 2032
- Table 111: Brazil High-Performance Polyamides Industry Revenue (Million) Forecast, by Application 2019 & 2032
- Table 112: Brazil High-Performance Polyamides Industry Volume (K Tons) Forecast, by Application 2019 & 2032
- Table 113: Argentina High-Performance Polyamides Industry Revenue (Million) Forecast, by Application 2019 & 2032
- Table 114: Argentina High-Performance Polyamides Industry Volume (K Tons) Forecast, by Application 2019 & 2032
- Table 115: Rest of South America High-Performance Polyamides Industry Revenue (Million) Forecast, by Application 2019 & 2032
- Table 116: Rest of South America High-Performance Polyamides Industry Volume (K Tons) Forecast, by Application 2019 & 2032
- Table 117: Global High-Performance Polyamides Industry Revenue Million Forecast, by Type 2019 & 2032
- Table 118: Global High-Performance Polyamides Industry Volume K Tons Forecast, by Type 2019 & 2032
- Table 119: Global High-Performance Polyamides Industry Revenue Million Forecast, by End-user Industry 2019 & 2032
- Table 120: Global High-Performance Polyamides Industry Volume K Tons Forecast, by End-user Industry 2019 & 2032
- Table 121: Global High-Performance Polyamides Industry Revenue Million Forecast, by Country 2019 & 2032
- Table 122: Global High-Performance Polyamides Industry Volume K Tons Forecast, by Country 2019 & 2032
- Table 123: Saudi Arabia High-Performance Polyamides Industry Revenue (Million) Forecast, by Application 2019 & 2032
- Table 124: Saudi Arabia High-Performance Polyamides Industry Volume (K Tons) Forecast, by Application 2019 & 2032
- Table 125: South Africa High-Performance Polyamides Industry Revenue (Million) Forecast, by Application 2019 & 2032
- Table 126: South Africa High-Performance Polyamides Industry Volume (K Tons) Forecast, by Application 2019 & 2032
- Table 127: Rest of Middle East and Africa High-Performance Polyamides Industry Revenue (Million) Forecast, by Application 2019 & 2032
- Table 128: Rest of Middle East and Africa High-Performance Polyamides Industry Volume (K Tons) Forecast, by Application 2019 & 2032
Frequently Asked Questions
1. What is the projected Compound Annual Growth Rate (CAGR) of the High-Performance Polyamides Industry?
The projected CAGR is approximately > 6.00%.
2. Which companies are prominent players in the High-Performance Polyamides Industry?
Key companies in the market include Asahi Kasei, Solvay S A, Mitsui Chemicals, Arkema SA, Evonik Industries AG, Teknor Apex Company, Toray Industries Inc, BASF SE, DuPont, Lanxess.
3. What are the main segments of the High-Performance Polyamides Industry?
The market segments include Type, End-user Industry.
4. Can you provide details about the market size?
The market size is estimated to be USD XX Million as of 2022.
5. What are some drivers contributing to market growth?
; Increasing Applications for High-Performance Polymers; Growing Demand from the Automobile Industry.
6. What are the notable trends driving market growth?
Growing Demand from Automobile Sector.
7. Are there any restraints impacting market growth?
; High cost and Impact of COVID-19; Other Restraints.
8. Can you provide examples of recent developments in the market?
N/A
9. What pricing options are available for accessing the report?
Pricing options include single-user, multi-user, and enterprise licenses priced at USD 4750, USD 5250, and USD 8750 respectively.
10. Is the market size provided in terms of value or volume?
The market size is provided in terms of value, measured in Million and volume, measured in K Tons.
11. Are there any specific market keywords associated with the report?
Yes, the market keyword associated with the report is "High-Performance Polyamides Industry," which aids in identifying and referencing the specific market segment covered.
12. How do I determine which pricing option suits my needs best?
The pricing options vary based on user requirements and access needs. Individual users may opt for single-user licenses, while businesses requiring broader access may choose multi-user or enterprise licenses for cost-effective access to the report.
13. Are there any additional resources or data provided in the High-Performance Polyamides Industry report?
While the report offers comprehensive insights, it's advisable to review the specific contents or supplementary materials provided to ascertain if additional resources or data are available.
14. How can I stay updated on further developments or reports in the High-Performance Polyamides Industry?
To stay informed about further developments, trends, and reports in the High-Performance Polyamides Industry, consider subscribing to industry newsletters, following relevant companies and organizations, or regularly checking reputable industry news sources and publications.
Methodology
Step 1 - Identification of Relevant Samples Size from Population Database


Step 2 - Approaches for Defining Global Market Size (Value, Volume* & Price*)

Note*: In applicable scenarios
Step 3 - Data Sources
Primary Research
- Web Analytics
- Survey Reports
- Research Institute
- Latest Research Reports
- Opinion Leaders
Secondary Research
- Annual Reports
- White Paper
- Latest Press Release
- Industry Association
- Paid Database
- Investor Presentations

Step 4 - Data Triangulation
Involves using different sources of information in order to increase the validity of a study
These sources are likely to be stakeholders in a program - participants, other researchers, program staff, other community members, and so on.
Then we put all data in single framework & apply various statistical tools to find out the dynamic on the market.
During the analysis stage, feedback from the stakeholder groups would be compared to determine areas of agreement as well as areas of divergence
