

Key Insights
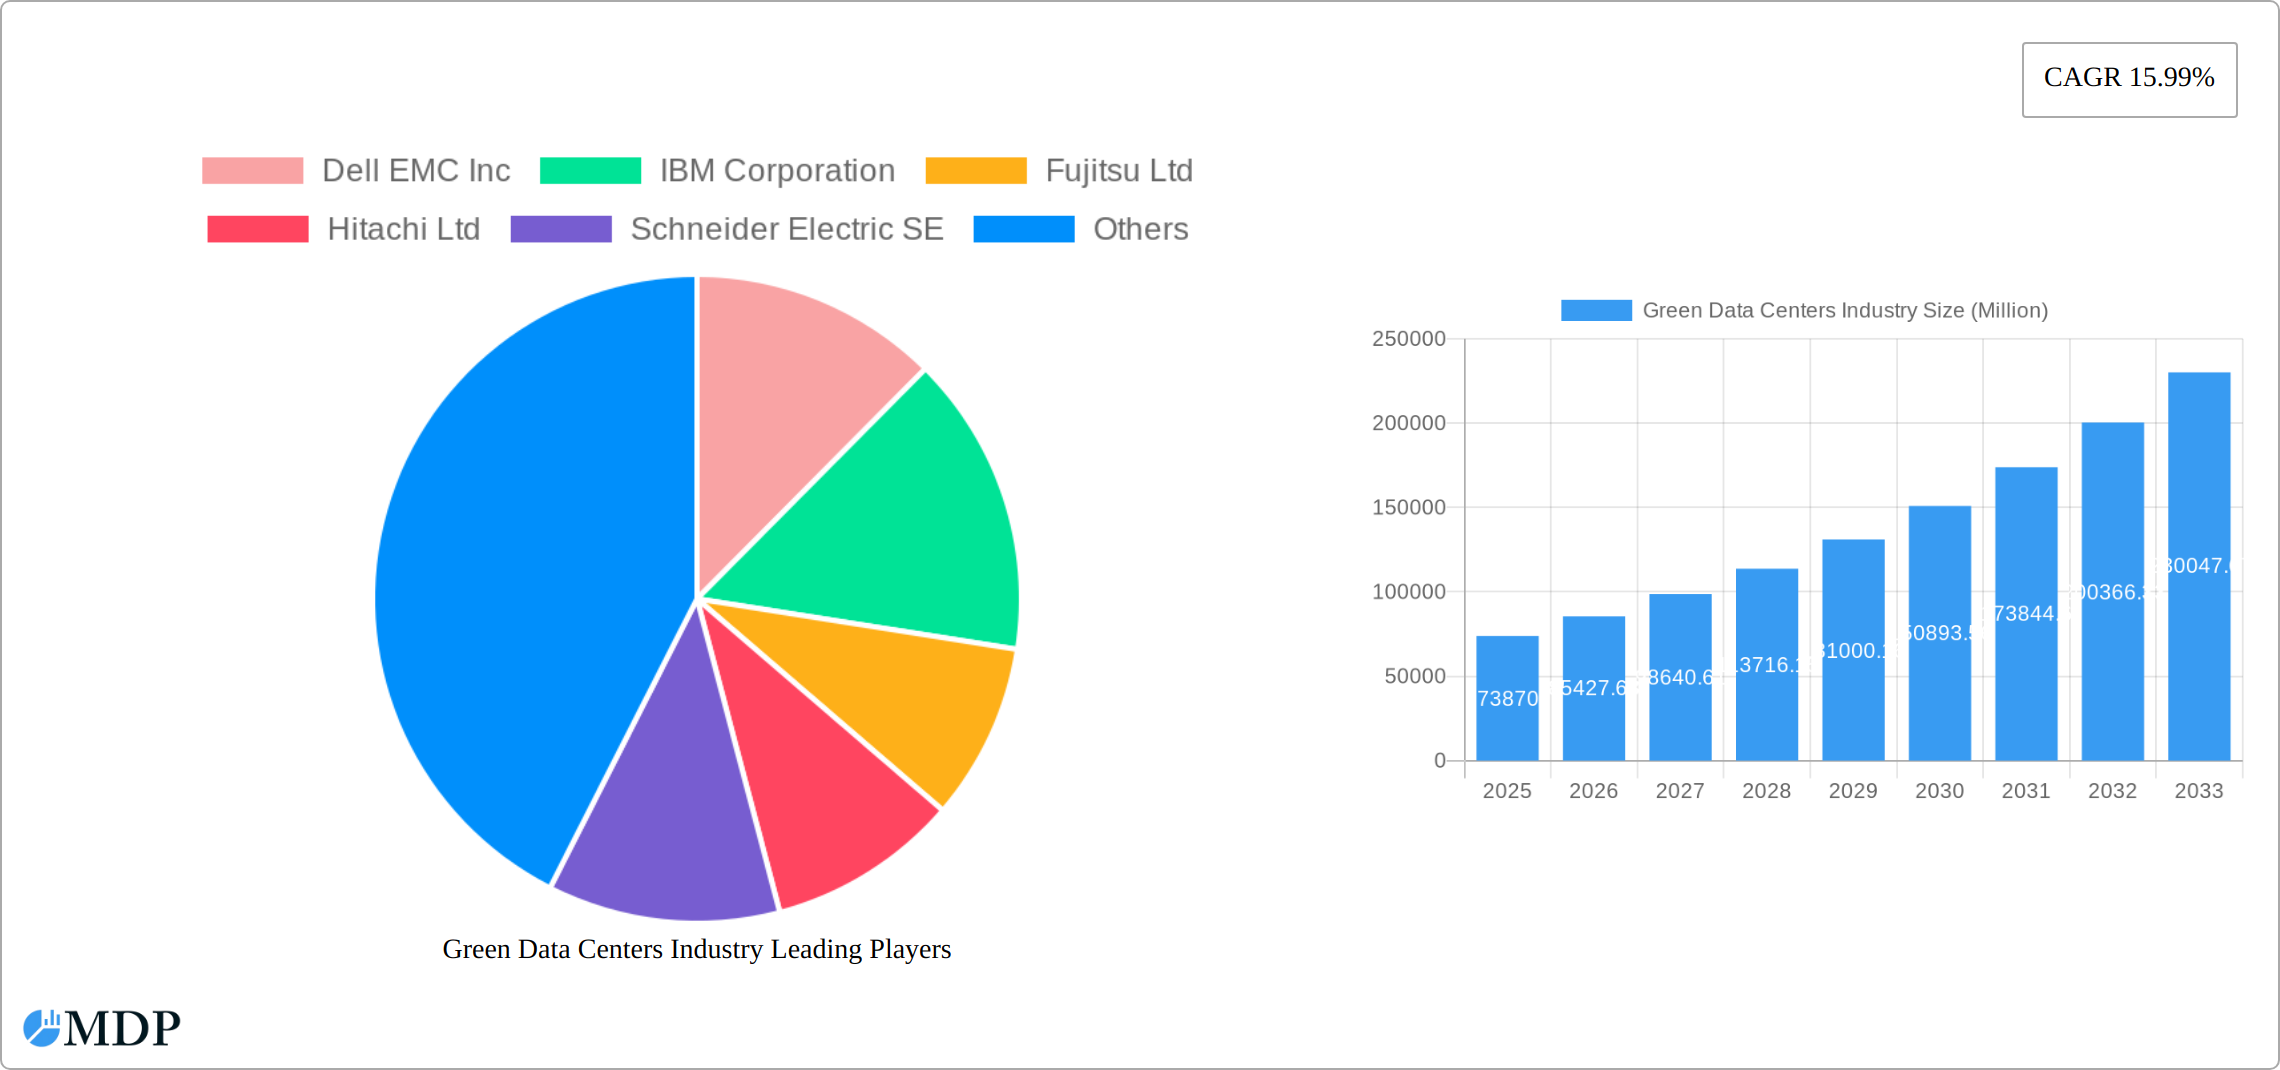
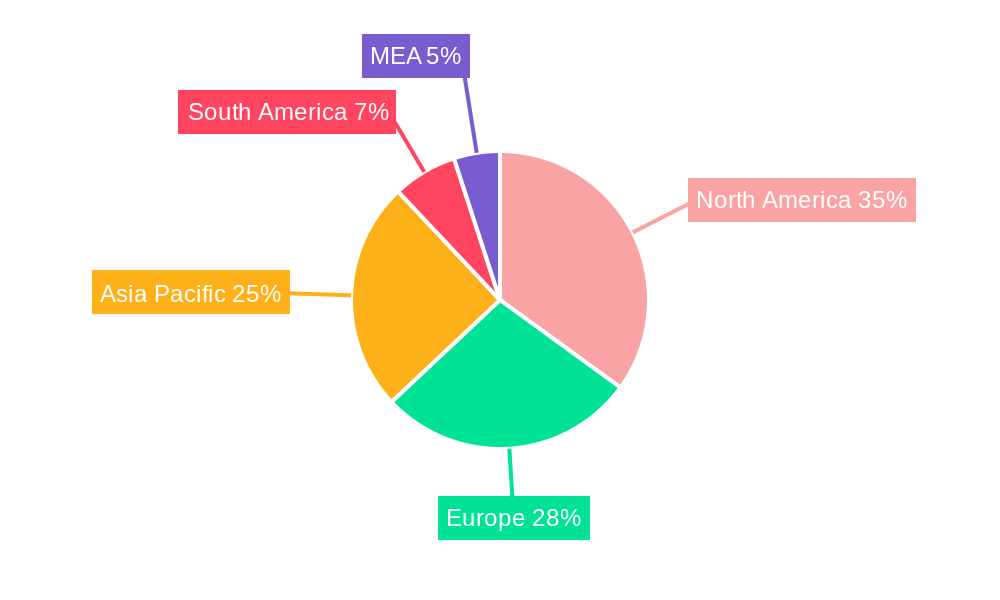
The global Green Data Center market, valued at $73.87 billion in 2025, is projected to experience robust growth, exhibiting a Compound Annual Growth Rate (CAGR) of 15.99% from 2025 to 2033. This expansion is driven by several key factors. Increasing concerns about environmental sustainability are pushing organizations to adopt energy-efficient data center solutions, reducing their carbon footprint and meeting corporate social responsibility goals. The rising adoption of cloud computing and the associated need for scalable, sustainable infrastructure further fuels market growth. Furthermore, stringent government regulations aimed at curbing carbon emissions are incentivizing the transition to green data centers. Technological advancements in areas like renewable energy integration (solar, wind), advanced cooling systems (liquid cooling, free air cooling), and energy-efficient hardware are making green data centers increasingly cost-effective and operationally efficient. The market is segmented by service (system integration, monitoring, professional services), solution (power, servers, software), user (colocation providers, cloud providers, enterprises), and industry vertical (healthcare, finance, government). North America currently holds a significant market share due to early adoption and strong regulatory frameworks, but the Asia-Pacific region is poised for rapid growth driven by increasing digitalization and infrastructure development. Competition in the market is fierce, with major players like Dell EMC, IBM, Fujitsu, and Schneider Electric constantly innovating and expanding their offerings.
The projected market growth will be influenced by several factors. Continued advancements in energy-efficient technologies will lower the barrier to entry for smaller organizations. However, high initial investment costs for implementing green data center solutions could pose a challenge for some businesses. Fluctuations in the prices of renewable energy sources and the availability of skilled professionals could also impact market growth. Despite these challenges, the long-term outlook for the Green Data Center market remains positive, driven by the increasing urgency to address climate change and the inherent economic benefits of improved energy efficiency. The continuous expansion of data centers worldwide, coupled with the rising demand for sustainable practices, ensures a substantial market opportunity in the coming years.
Green Data Centers Industry: A Comprehensive Market Report (2019-2033)
This in-depth report provides a comprehensive analysis of the Green Data Centers industry, offering actionable insights for stakeholders across the value chain. With a study period spanning 2019-2033, a base year of 2025, and a forecast period of 2025-2033, this report leverages historical data (2019-2024) to project future market trends and growth opportunities. The global Green Data Centers market is estimated to be worth xx Million in 2025 and is projected to reach xx Million by 2033, exhibiting a CAGR of xx%. The report covers key segments (By Service, By Solution, By User, By Industry Vertical), leading players including Dell EMC Inc, IBM Corporation, Fujitsu Ltd, Hitachi Ltd, Schneider Electric SE, HP Inc, Cisco Technology Inc, Vertiv Corporation, and Eaton Corporation, and significant industry developments.
Green Data Centers Industry Market Dynamics & Concentration
The Green Data Centers market is characterized by moderate concentration, with several major players holding significant market share. Dell EMC Inc, IBM Corporation, and Schneider Electric SE currently command a combined market share of approximately xx%, driving intense competition and innovation. However, smaller, specialized firms are also emerging, particularly in niche segments like liquid immersion cooling and sustainable power solutions. Innovation is driven by increasing environmental concerns, stringent regulations, and the growing demand for energy-efficient data center solutions. Mergers and acquisitions (M&A) are common, with approximately xx M&A deals recorded in the past five years, largely focused on consolidating market share and expanding technological capabilities. Regulatory frameworks, varying by region, are increasingly focused on carbon reduction targets and energy efficiency standards, influencing both technology adoption and market growth. Product substitutes, such as edge computing solutions and decentralized data storage, are gaining traction but have not yet posed a significant threat to the core Green Data Centers market. End-user trends show a strong preference for sustainable and environmentally responsible data center solutions, pushing the market toward greater adoption of renewable energy sources and energy-efficient technologies.
- Market Share (2024): Dell EMC Inc (xx%), IBM Corporation (xx%), Schneider Electric SE (xx%), Others (xx%)
- M&A Deal Count (2019-2024): xx
- Key Regulatory Drivers: Carbon emission reduction targets, energy efficiency standards.
Green Data Centers Industry Industry Trends & Analysis
The Green Data Centers market is experiencing robust growth, driven by several factors. The increasing adoption of cloud computing and the growth of data-intensive applications fuel demand for energy-efficient and sustainable data center infrastructure. Technological disruptions, such as advancements in liquid cooling, AI-powered energy management systems, and renewable energy integration, are accelerating market expansion. Consumer preferences are shifting toward environmentally conscious solutions, leading to increased demand for green data centers. Competitive dynamics are characterized by intense competition among established players and the emergence of innovative startups. The market penetration of green data center solutions is steadily increasing, with a projected xx% penetration rate by 2033. This growth is further propelled by government initiatives promoting sustainable infrastructure and increasing corporate social responsibility (CSR) commitments.
Leading Markets & Segments in Green Data Centers Industry
North America currently dominates the Green Data Centers market, driven by strong demand from cloud service providers and enterprises, along with robust government support for green initiatives. However, Asia-Pacific is experiencing rapid growth, fueled by increasing digitalization and government investments in renewable energy infrastructure.
Key Drivers by Segment:
- By Service: System Integration (High demand due to complex infrastructure requirements), Monitoring Service (Growing demand for real-time energy monitoring and optimization).
- By Solution: Power (Renewable energy integration is a key driver), Cooling (Advancements in liquid cooling technologies are fueling growth).
- By User: Cloud Service Providers (Largest segment, driven by massive scale and sustainability commitments), Enterprises (Growing adoption of green solutions for cost savings and brand image).
- By Industry Vertical: Financial Services (High demand due to stringent regulatory compliance and data security needs), Telecom and IT (High energy consumption necessitates green solutions).
Dominance Analysis: North America's dominance stems from established technological infrastructure, high adoption rates of cloud technologies, and stringent environmental regulations. Asia-Pacific's rapid growth is fueled by a burgeoning digital economy and government initiatives promoting renewable energy adoption.
Green Data Centers Industry Product Developments
Recent innovations in Green Data Centers include advancements in liquid immersion cooling, AI-powered energy management systems, and the integration of renewable energy sources. These advancements offer significant competitive advantages, including reduced energy consumption, lower operating costs, and enhanced environmental sustainability. The market is witnessing a shift towards modular and prefabricated data centers, which enable faster deployment and scalability, further enhancing market fit.
Key Drivers of Green Data Centers Industry Growth
The Green Data Centers market's growth is fueled by several key factors:
- Technological Advancements: Innovations in cooling technologies (DCLC, LIC), renewable energy integration, and AI-powered energy management.
- Economic Incentives: Government subsidies and tax breaks for green initiatives encourage adoption.
- Regulatory Pressures: Stringent environmental regulations necessitate energy-efficient solutions. Examples include carbon emission reduction targets in various regions.
Challenges in the Green Data Centers Industry Market
Challenges hindering market growth include:
- Regulatory Hurdles: Navigating complex and varying environmental regulations across different regions.
- Supply Chain Issues: Potential disruptions in the supply of critical components for green technologies.
- High Initial Investment Costs: The upfront investment required for green data center infrastructure can be substantial, deterring some organizations. This could potentially impact market growth by xx% in the next 5 years.
Emerging Opportunities in Green Data Centers Industry
Significant growth potential lies in strategic partnerships between data center operators and renewable energy providers, enabling direct sourcing of renewable power. Technological breakthroughs in energy storage and AI-powered energy optimization will further enhance efficiency and reduce operating costs. Market expansion into developing economies with rapidly growing digital infrastructure presents lucrative opportunities.
Leading Players in the Green Data Centers Industry Sector
- Dell EMC Inc
- IBM Corporation
- Fujitsu Ltd
- Hitachi Ltd
- Schneider Electric SE
- HP Inc
- Cisco Technology Inc
- Vertiv Corporation
- Eaton Corporation
Key Milestones in Green Data Centers Industry Industry
- October 2022: Phonepe launched its first Green Data Center in Navi Mumbai, India, utilizing advanced cooling technologies (DCLC and LIC) and showcasing the adoption of green solutions in emerging markets. The 4.8 MW facility highlights the growing scale of green data center projects.
- November 2022: Earth Wind and Power (EWP)'s partnership with Oilserv to deploy mobile modular green data centers in Middle Eastern oilfields demonstrates the potential for utilizing excess energy from gas combustion for off-grid computing, showcasing innovative applications of green technology.
Strategic Outlook for Green Data Centers Industry Market
The Green Data Centers market exhibits strong long-term growth potential, driven by increasing demand for sustainable infrastructure, technological advancements, and supportive government policies. Strategic partnerships, innovative product development, and market expansion into high-growth regions will be key factors for success in this dynamic market. The focus on sustainable and efficient data center solutions will continue to drive growth, shaping a future where technology and environmental responsibility coexist.
Green Data Centers Industry Segmentation
-
1. Service
- 1.1. System Integration
- 1.2. Monitoring Service
- 1.3. Professional Service
- 1.4. Other Services
-
2. Solution
- 2.1. Power
- 2.2. Servers
- 2.3. Management Software
- 2.4. Networking Technologies
- 2.5. Cooling
- 2.6. Other Solutions
-
3. User
- 3.1. Colocation Providers
- 3.2. Cloud Service Providers
- 3.3. Enterprises
-
4. Industry Vertical
- 4.1. Healthcare
- 4.2. Financial Services
- 4.3. Government
- 4.4. Telecom and IT
- 4.5. Other Industry Verticals
Green Data Centers Industry Segmentation By Geography
- 1. North America
- 2. Europe
- 3. Asia Pacific
- 4. Latin America
- 5. Middle East and Africa
Green Data Centers Industry REPORT HIGHLIGHTS
| Aspects | Details |
|---|---|
| Study Period | 2019-2033 |
| Base Year | 2024 |
| Estimated Year | 2025 |
| Forecast Period | 2025-2033 |
| Historical Period | 2019-2024 |
| Growth Rate | CAGR of 15.99% from 2019-2033 |
| Segmentation |
|
Table of Contents
- 1. Introduction
- 1.1. Research Scope
- 1.2. Market Segmentation
- 1.3. Research Methodology
- 1.4. Definitions and Assumptions
- 2. Executive Summary
- 2.1. Introduction
- 3. Market Dynamics
- 3.1. Introduction
- 3.2. Market Drivers
- 3.2.1. Increasing Demand for Data Storage; Power Segment to Hold a Significant Market Share
- 3.3. Market Restrains
- 3.3.1. Higher Initial Investments
- 3.4. Market Trends
- 3.4.1. Power Segment to Hold a Significant Market Share
- 4. Market Factor Analysis
- 4.1. Porters Five Forces
- 4.2. Supply/Value Chain
- 4.3. PESTEL analysis
- 4.4. Market Entropy
- 4.5. Patent/Trademark Analysis
- 5. Global Green Data Centers Industry Analysis, Insights and Forecast, 2019-2031
- 5.1. Market Analysis, Insights and Forecast - by Service
- 5.1.1. System Integration
- 5.1.2. Monitoring Service
- 5.1.3. Professional Service
- 5.1.4. Other Services
- 5.2. Market Analysis, Insights and Forecast - by Solution
- 5.2.1. Power
- 5.2.2. Servers
- 5.2.3. Management Software
- 5.2.4. Networking Technologies
- 5.2.5. Cooling
- 5.2.6. Other Solutions
- 5.3. Market Analysis, Insights and Forecast - by User
- 5.3.1. Colocation Providers
- 5.3.2. Cloud Service Providers
- 5.3.3. Enterprises
- 5.4. Market Analysis, Insights and Forecast - by Industry Vertical
- 5.4.1. Healthcare
- 5.4.2. Financial Services
- 5.4.3. Government
- 5.4.4. Telecom and IT
- 5.4.5. Other Industry Verticals
- 5.5. Market Analysis, Insights and Forecast - by Region
- 5.5.1. North America
- 5.5.2. Europe
- 5.5.3. Asia Pacific
- 5.5.4. Latin America
- 5.5.5. Middle East and Africa
- 5.1. Market Analysis, Insights and Forecast - by Service
- 6. North America Green Data Centers Industry Analysis, Insights and Forecast, 2019-2031
- 6.1. Market Analysis, Insights and Forecast - by Service
- 6.1.1. System Integration
- 6.1.2. Monitoring Service
- 6.1.3. Professional Service
- 6.1.4. Other Services
- 6.2. Market Analysis, Insights and Forecast - by Solution
- 6.2.1. Power
- 6.2.2. Servers
- 6.2.3. Management Software
- 6.2.4. Networking Technologies
- 6.2.5. Cooling
- 6.2.6. Other Solutions
- 6.3. Market Analysis, Insights and Forecast - by User
- 6.3.1. Colocation Providers
- 6.3.2. Cloud Service Providers
- 6.3.3. Enterprises
- 6.4. Market Analysis, Insights and Forecast - by Industry Vertical
- 6.4.1. Healthcare
- 6.4.2. Financial Services
- 6.4.3. Government
- 6.4.4. Telecom and IT
- 6.4.5. Other Industry Verticals
- 6.1. Market Analysis, Insights and Forecast - by Service
- 7. Europe Green Data Centers Industry Analysis, Insights and Forecast, 2019-2031
- 7.1. Market Analysis, Insights and Forecast - by Service
- 7.1.1. System Integration
- 7.1.2. Monitoring Service
- 7.1.3. Professional Service
- 7.1.4. Other Services
- 7.2. Market Analysis, Insights and Forecast - by Solution
- 7.2.1. Power
- 7.2.2. Servers
- 7.2.3. Management Software
- 7.2.4. Networking Technologies
- 7.2.5. Cooling
- 7.2.6. Other Solutions
- 7.3. Market Analysis, Insights and Forecast - by User
- 7.3.1. Colocation Providers
- 7.3.2. Cloud Service Providers
- 7.3.3. Enterprises
- 7.4. Market Analysis, Insights and Forecast - by Industry Vertical
- 7.4.1. Healthcare
- 7.4.2. Financial Services
- 7.4.3. Government
- 7.4.4. Telecom and IT
- 7.4.5. Other Industry Verticals
- 7.1. Market Analysis, Insights and Forecast - by Service
- 8. Asia Pacific Green Data Centers Industry Analysis, Insights and Forecast, 2019-2031
- 8.1. Market Analysis, Insights and Forecast - by Service
- 8.1.1. System Integration
- 8.1.2. Monitoring Service
- 8.1.3. Professional Service
- 8.1.4. Other Services
- 8.2. Market Analysis, Insights and Forecast - by Solution
- 8.2.1. Power
- 8.2.2. Servers
- 8.2.3. Management Software
- 8.2.4. Networking Technologies
- 8.2.5. Cooling
- 8.2.6. Other Solutions
- 8.3. Market Analysis, Insights and Forecast - by User
- 8.3.1. Colocation Providers
- 8.3.2. Cloud Service Providers
- 8.3.3. Enterprises
- 8.4. Market Analysis, Insights and Forecast - by Industry Vertical
- 8.4.1. Healthcare
- 8.4.2. Financial Services
- 8.4.3. Government
- 8.4.4. Telecom and IT
- 8.4.5. Other Industry Verticals
- 8.1. Market Analysis, Insights and Forecast - by Service
- 9. Latin America Green Data Centers Industry Analysis, Insights and Forecast, 2019-2031
- 9.1. Market Analysis, Insights and Forecast - by Service
- 9.1.1. System Integration
- 9.1.2. Monitoring Service
- 9.1.3. Professional Service
- 9.1.4. Other Services
- 9.2. Market Analysis, Insights and Forecast - by Solution
- 9.2.1. Power
- 9.2.2. Servers
- 9.2.3. Management Software
- 9.2.4. Networking Technologies
- 9.2.5. Cooling
- 9.2.6. Other Solutions
- 9.3. Market Analysis, Insights and Forecast - by User
- 9.3.1. Colocation Providers
- 9.3.2. Cloud Service Providers
- 9.3.3. Enterprises
- 9.4. Market Analysis, Insights and Forecast - by Industry Vertical
- 9.4.1. Healthcare
- 9.4.2. Financial Services
- 9.4.3. Government
- 9.4.4. Telecom and IT
- 9.4.5. Other Industry Verticals
- 9.1. Market Analysis, Insights and Forecast - by Service
- 10. Middle East and Africa Green Data Centers Industry Analysis, Insights and Forecast, 2019-2031
- 10.1. Market Analysis, Insights and Forecast - by Service
- 10.1.1. System Integration
- 10.1.2. Monitoring Service
- 10.1.3. Professional Service
- 10.1.4. Other Services
- 10.2. Market Analysis, Insights and Forecast - by Solution
- 10.2.1. Power
- 10.2.2. Servers
- 10.2.3. Management Software
- 10.2.4. Networking Technologies
- 10.2.5. Cooling
- 10.2.6. Other Solutions
- 10.3. Market Analysis, Insights and Forecast - by User
- 10.3.1. Colocation Providers
- 10.3.2. Cloud Service Providers
- 10.3.3. Enterprises
- 10.4. Market Analysis, Insights and Forecast - by Industry Vertical
- 10.4.1. Healthcare
- 10.4.2. Financial Services
- 10.4.3. Government
- 10.4.4. Telecom and IT
- 10.4.5. Other Industry Verticals
- 10.1. Market Analysis, Insights and Forecast - by Service
- 11. North America Green Data Centers Industry Analysis, Insights and Forecast, 2019-2031
- 11.1. Market Analysis, Insights and Forecast - By Country/Sub-region
- 11.1.1 United States
- 11.1.2 Canada
- 11.1.3 Mexico
- 12. Europe Green Data Centers Industry Analysis, Insights and Forecast, 2019-2031
- 12.1. Market Analysis, Insights and Forecast - By Country/Sub-region
- 12.1.1 Germany
- 12.1.2 United Kingdom
- 12.1.3 France
- 12.1.4 Spain
- 12.1.5 Italy
- 12.1.6 Spain
- 12.1.7 Belgium
- 12.1.8 Netherland
- 12.1.9 Nordics
- 12.1.10 Rest of Europe
- 13. Asia Pacific Green Data Centers Industry Analysis, Insights and Forecast, 2019-2031
- 13.1. Market Analysis, Insights and Forecast - By Country/Sub-region
- 13.1.1 China
- 13.1.2 Japan
- 13.1.3 India
- 13.1.4 South Korea
- 13.1.5 Southeast Asia
- 13.1.6 Australia
- 13.1.7 Indonesia
- 13.1.8 Phillipes
- 13.1.9 Singapore
- 13.1.10 Thailandc
- 13.1.11 Rest of Asia Pacific
- 14. South America Green Data Centers Industry Analysis, Insights and Forecast, 2019-2031
- 14.1. Market Analysis, Insights and Forecast - By Country/Sub-region
- 14.1.1 Brazil
- 14.1.2 Argentina
- 14.1.3 Peru
- 14.1.4 Chile
- 14.1.5 Colombia
- 14.1.6 Ecuador
- 14.1.7 Venezuela
- 14.1.8 Rest of South America
- 15. North America Green Data Centers Industry Analysis, Insights and Forecast, 2019-2031
- 15.1. Market Analysis, Insights and Forecast - By Country/Sub-region
- 15.1.1 United States
- 15.1.2 Canada
- 15.1.3 Mexico
- 16. MEA Green Data Centers Industry Analysis, Insights and Forecast, 2019-2031
- 16.1. Market Analysis, Insights and Forecast - By Country/Sub-region
- 16.1.1 United Arab Emirates
- 16.1.2 Saudi Arabia
- 16.1.3 South Africa
- 16.1.4 Rest of Middle East and Africa
- 17. Competitive Analysis
- 17.1. Global Market Share Analysis 2024
- 17.2. Company Profiles
- 17.2.1 Dell EMC Inc
- 17.2.1.1. Overview
- 17.2.1.2. Products
- 17.2.1.3. SWOT Analysis
- 17.2.1.4. Recent Developments
- 17.2.1.5. Financials (Based on Availability)
- 17.2.2 IBM Corporation
- 17.2.2.1. Overview
- 17.2.2.2. Products
- 17.2.2.3. SWOT Analysis
- 17.2.2.4. Recent Developments
- 17.2.2.5. Financials (Based on Availability)
- 17.2.3 Fujitsu Ltd
- 17.2.3.1. Overview
- 17.2.3.2. Products
- 17.2.3.3. SWOT Analysis
- 17.2.3.4. Recent Developments
- 17.2.3.5. Financials (Based on Availability)
- 17.2.4 Hitachi Ltd
- 17.2.4.1. Overview
- 17.2.4.2. Products
- 17.2.4.3. SWOT Analysis
- 17.2.4.4. Recent Developments
- 17.2.4.5. Financials (Based on Availability)
- 17.2.5 Schneider Electric SE
- 17.2.5.1. Overview
- 17.2.5.2. Products
- 17.2.5.3. SWOT Analysis
- 17.2.5.4. Recent Developments
- 17.2.5.5. Financials (Based on Availability)
- 17.2.6 HP Inc
- 17.2.6.1. Overview
- 17.2.6.2. Products
- 17.2.6.3. SWOT Analysis
- 17.2.6.4. Recent Developments
- 17.2.6.5. Financials (Based on Availability)
- 17.2.7 Cisco Technology Inc
- 17.2.7.1. Overview
- 17.2.7.2. Products
- 17.2.7.3. SWOT Analysis
- 17.2.7.4. Recent Developments
- 17.2.7.5. Financials (Based on Availability)
- 17.2.8 Vertiv Corporation
- 17.2.8.1. Overview
- 17.2.8.2. Products
- 17.2.8.3. SWOT Analysis
- 17.2.8.4. Recent Developments
- 17.2.8.5. Financials (Based on Availability)
- 17.2.9 Eaton Corporation
- 17.2.9.1. Overview
- 17.2.9.2. Products
- 17.2.9.3. SWOT Analysis
- 17.2.9.4. Recent Developments
- 17.2.9.5. Financials (Based on Availability)
- 17.2.1 Dell EMC Inc
List of Figures
- Figure 1: Global Green Data Centers Industry Revenue Breakdown (Million, %) by Region 2024 & 2032
- Figure 2: North America Green Data Centers Industry Revenue (Million), by Country 2024 & 2032
- Figure 3: North America Green Data Centers Industry Revenue Share (%), by Country 2024 & 2032
- Figure 4: Europe Green Data Centers Industry Revenue (Million), by Country 2024 & 2032
- Figure 5: Europe Green Data Centers Industry Revenue Share (%), by Country 2024 & 2032
- Figure 6: Asia Pacific Green Data Centers Industry Revenue (Million), by Country 2024 & 2032
- Figure 7: Asia Pacific Green Data Centers Industry Revenue Share (%), by Country 2024 & 2032
- Figure 8: South America Green Data Centers Industry Revenue (Million), by Country 2024 & 2032
- Figure 9: South America Green Data Centers Industry Revenue Share (%), by Country 2024 & 2032
- Figure 10: North America Green Data Centers Industry Revenue (Million), by Country 2024 & 2032
- Figure 11: North America Green Data Centers Industry Revenue Share (%), by Country 2024 & 2032
- Figure 12: MEA Green Data Centers Industry Revenue (Million), by Country 2024 & 2032
- Figure 13: MEA Green Data Centers Industry Revenue Share (%), by Country 2024 & 2032
- Figure 14: North America Green Data Centers Industry Revenue (Million), by Service 2024 & 2032
- Figure 15: North America Green Data Centers Industry Revenue Share (%), by Service 2024 & 2032
- Figure 16: North America Green Data Centers Industry Revenue (Million), by Solution 2024 & 2032
- Figure 17: North America Green Data Centers Industry Revenue Share (%), by Solution 2024 & 2032
- Figure 18: North America Green Data Centers Industry Revenue (Million), by User 2024 & 2032
- Figure 19: North America Green Data Centers Industry Revenue Share (%), by User 2024 & 2032
- Figure 20: North America Green Data Centers Industry Revenue (Million), by Industry Vertical 2024 & 2032
- Figure 21: North America Green Data Centers Industry Revenue Share (%), by Industry Vertical 2024 & 2032
- Figure 22: North America Green Data Centers Industry Revenue (Million), by Country 2024 & 2032
- Figure 23: North America Green Data Centers Industry Revenue Share (%), by Country 2024 & 2032
- Figure 24: Europe Green Data Centers Industry Revenue (Million), by Service 2024 & 2032
- Figure 25: Europe Green Data Centers Industry Revenue Share (%), by Service 2024 & 2032
- Figure 26: Europe Green Data Centers Industry Revenue (Million), by Solution 2024 & 2032
- Figure 27: Europe Green Data Centers Industry Revenue Share (%), by Solution 2024 & 2032
- Figure 28: Europe Green Data Centers Industry Revenue (Million), by User 2024 & 2032
- Figure 29: Europe Green Data Centers Industry Revenue Share (%), by User 2024 & 2032
- Figure 30: Europe Green Data Centers Industry Revenue (Million), by Industry Vertical 2024 & 2032
- Figure 31: Europe Green Data Centers Industry Revenue Share (%), by Industry Vertical 2024 & 2032
- Figure 32: Europe Green Data Centers Industry Revenue (Million), by Country 2024 & 2032
- Figure 33: Europe Green Data Centers Industry Revenue Share (%), by Country 2024 & 2032
- Figure 34: Asia Pacific Green Data Centers Industry Revenue (Million), by Service 2024 & 2032
- Figure 35: Asia Pacific Green Data Centers Industry Revenue Share (%), by Service 2024 & 2032
- Figure 36: Asia Pacific Green Data Centers Industry Revenue (Million), by Solution 2024 & 2032
- Figure 37: Asia Pacific Green Data Centers Industry Revenue Share (%), by Solution 2024 & 2032
- Figure 38: Asia Pacific Green Data Centers Industry Revenue (Million), by User 2024 & 2032
- Figure 39: Asia Pacific Green Data Centers Industry Revenue Share (%), by User 2024 & 2032
- Figure 40: Asia Pacific Green Data Centers Industry Revenue (Million), by Industry Vertical 2024 & 2032
- Figure 41: Asia Pacific Green Data Centers Industry Revenue Share (%), by Industry Vertical 2024 & 2032
- Figure 42: Asia Pacific Green Data Centers Industry Revenue (Million), by Country 2024 & 2032
- Figure 43: Asia Pacific Green Data Centers Industry Revenue Share (%), by Country 2024 & 2032
- Figure 44: Latin America Green Data Centers Industry Revenue (Million), by Service 2024 & 2032
- Figure 45: Latin America Green Data Centers Industry Revenue Share (%), by Service 2024 & 2032
- Figure 46: Latin America Green Data Centers Industry Revenue (Million), by Solution 2024 & 2032
- Figure 47: Latin America Green Data Centers Industry Revenue Share (%), by Solution 2024 & 2032
- Figure 48: Latin America Green Data Centers Industry Revenue (Million), by User 2024 & 2032
- Figure 49: Latin America Green Data Centers Industry Revenue Share (%), by User 2024 & 2032
- Figure 50: Latin America Green Data Centers Industry Revenue (Million), by Industry Vertical 2024 & 2032
- Figure 51: Latin America Green Data Centers Industry Revenue Share (%), by Industry Vertical 2024 & 2032
- Figure 52: Latin America Green Data Centers Industry Revenue (Million), by Country 2024 & 2032
- Figure 53: Latin America Green Data Centers Industry Revenue Share (%), by Country 2024 & 2032
- Figure 54: Middle East and Africa Green Data Centers Industry Revenue (Million), by Service 2024 & 2032
- Figure 55: Middle East and Africa Green Data Centers Industry Revenue Share (%), by Service 2024 & 2032
- Figure 56: Middle East and Africa Green Data Centers Industry Revenue (Million), by Solution 2024 & 2032
- Figure 57: Middle East and Africa Green Data Centers Industry Revenue Share (%), by Solution 2024 & 2032
- Figure 58: Middle East and Africa Green Data Centers Industry Revenue (Million), by User 2024 & 2032
- Figure 59: Middle East and Africa Green Data Centers Industry Revenue Share (%), by User 2024 & 2032
- Figure 60: Middle East and Africa Green Data Centers Industry Revenue (Million), by Industry Vertical 2024 & 2032
- Figure 61: Middle East and Africa Green Data Centers Industry Revenue Share (%), by Industry Vertical 2024 & 2032
- Figure 62: Middle East and Africa Green Data Centers Industry Revenue (Million), by Country 2024 & 2032
- Figure 63: Middle East and Africa Green Data Centers Industry Revenue Share (%), by Country 2024 & 2032
List of Tables
- Table 1: Global Green Data Centers Industry Revenue Million Forecast, by Region 2019 & 2032
- Table 2: Global Green Data Centers Industry Revenue Million Forecast, by Service 2019 & 2032
- Table 3: Global Green Data Centers Industry Revenue Million Forecast, by Solution 2019 & 2032
- Table 4: Global Green Data Centers Industry Revenue Million Forecast, by User 2019 & 2032
- Table 5: Global Green Data Centers Industry Revenue Million Forecast, by Industry Vertical 2019 & 2032
- Table 6: Global Green Data Centers Industry Revenue Million Forecast, by Region 2019 & 2032
- Table 7: Global Green Data Centers Industry Revenue Million Forecast, by Country 2019 & 2032
- Table 8: United States Green Data Centers Industry Revenue (Million) Forecast, by Application 2019 & 2032
- Table 9: Canada Green Data Centers Industry Revenue (Million) Forecast, by Application 2019 & 2032
- Table 10: Mexico Green Data Centers Industry Revenue (Million) Forecast, by Application 2019 & 2032
- Table 11: Global Green Data Centers Industry Revenue Million Forecast, by Country 2019 & 2032
- Table 12: Germany Green Data Centers Industry Revenue (Million) Forecast, by Application 2019 & 2032
- Table 13: United Kingdom Green Data Centers Industry Revenue (Million) Forecast, by Application 2019 & 2032
- Table 14: France Green Data Centers Industry Revenue (Million) Forecast, by Application 2019 & 2032
- Table 15: Spain Green Data Centers Industry Revenue (Million) Forecast, by Application 2019 & 2032
- Table 16: Italy Green Data Centers Industry Revenue (Million) Forecast, by Application 2019 & 2032
- Table 17: Spain Green Data Centers Industry Revenue (Million) Forecast, by Application 2019 & 2032
- Table 18: Belgium Green Data Centers Industry Revenue (Million) Forecast, by Application 2019 & 2032
- Table 19: Netherland Green Data Centers Industry Revenue (Million) Forecast, by Application 2019 & 2032
- Table 20: Nordics Green Data Centers Industry Revenue (Million) Forecast, by Application 2019 & 2032
- Table 21: Rest of Europe Green Data Centers Industry Revenue (Million) Forecast, by Application 2019 & 2032
- Table 22: Global Green Data Centers Industry Revenue Million Forecast, by Country 2019 & 2032
- Table 23: China Green Data Centers Industry Revenue (Million) Forecast, by Application 2019 & 2032
- Table 24: Japan Green Data Centers Industry Revenue (Million) Forecast, by Application 2019 & 2032
- Table 25: India Green Data Centers Industry Revenue (Million) Forecast, by Application 2019 & 2032
- Table 26: South Korea Green Data Centers Industry Revenue (Million) Forecast, by Application 2019 & 2032
- Table 27: Southeast Asia Green Data Centers Industry Revenue (Million) Forecast, by Application 2019 & 2032
- Table 28: Australia Green Data Centers Industry Revenue (Million) Forecast, by Application 2019 & 2032
- Table 29: Indonesia Green Data Centers Industry Revenue (Million) Forecast, by Application 2019 & 2032
- Table 30: Phillipes Green Data Centers Industry Revenue (Million) Forecast, by Application 2019 & 2032
- Table 31: Singapore Green Data Centers Industry Revenue (Million) Forecast, by Application 2019 & 2032
- Table 32: Thailandc Green Data Centers Industry Revenue (Million) Forecast, by Application 2019 & 2032
- Table 33: Rest of Asia Pacific Green Data Centers Industry Revenue (Million) Forecast, by Application 2019 & 2032
- Table 34: Global Green Data Centers Industry Revenue Million Forecast, by Country 2019 & 2032
- Table 35: Brazil Green Data Centers Industry Revenue (Million) Forecast, by Application 2019 & 2032
- Table 36: Argentina Green Data Centers Industry Revenue (Million) Forecast, by Application 2019 & 2032
- Table 37: Peru Green Data Centers Industry Revenue (Million) Forecast, by Application 2019 & 2032
- Table 38: Chile Green Data Centers Industry Revenue (Million) Forecast, by Application 2019 & 2032
- Table 39: Colombia Green Data Centers Industry Revenue (Million) Forecast, by Application 2019 & 2032
- Table 40: Ecuador Green Data Centers Industry Revenue (Million) Forecast, by Application 2019 & 2032
- Table 41: Venezuela Green Data Centers Industry Revenue (Million) Forecast, by Application 2019 & 2032
- Table 42: Rest of South America Green Data Centers Industry Revenue (Million) Forecast, by Application 2019 & 2032
- Table 43: Global Green Data Centers Industry Revenue Million Forecast, by Country 2019 & 2032
- Table 44: United States Green Data Centers Industry Revenue (Million) Forecast, by Application 2019 & 2032
- Table 45: Canada Green Data Centers Industry Revenue (Million) Forecast, by Application 2019 & 2032
- Table 46: Mexico Green Data Centers Industry Revenue (Million) Forecast, by Application 2019 & 2032
- Table 47: Global Green Data Centers Industry Revenue Million Forecast, by Country 2019 & 2032
- Table 48: United Arab Emirates Green Data Centers Industry Revenue (Million) Forecast, by Application 2019 & 2032
- Table 49: Saudi Arabia Green Data Centers Industry Revenue (Million) Forecast, by Application 2019 & 2032
- Table 50: South Africa Green Data Centers Industry Revenue (Million) Forecast, by Application 2019 & 2032
- Table 51: Rest of Middle East and Africa Green Data Centers Industry Revenue (Million) Forecast, by Application 2019 & 2032
- Table 52: Global Green Data Centers Industry Revenue Million Forecast, by Service 2019 & 2032
- Table 53: Global Green Data Centers Industry Revenue Million Forecast, by Solution 2019 & 2032
- Table 54: Global Green Data Centers Industry Revenue Million Forecast, by User 2019 & 2032
- Table 55: Global Green Data Centers Industry Revenue Million Forecast, by Industry Vertical 2019 & 2032
- Table 56: Global Green Data Centers Industry Revenue Million Forecast, by Country 2019 & 2032
- Table 57: Global Green Data Centers Industry Revenue Million Forecast, by Service 2019 & 2032
- Table 58: Global Green Data Centers Industry Revenue Million Forecast, by Solution 2019 & 2032
- Table 59: Global Green Data Centers Industry Revenue Million Forecast, by User 2019 & 2032
- Table 60: Global Green Data Centers Industry Revenue Million Forecast, by Industry Vertical 2019 & 2032
- Table 61: Global Green Data Centers Industry Revenue Million Forecast, by Country 2019 & 2032
- Table 62: Global Green Data Centers Industry Revenue Million Forecast, by Service 2019 & 2032
- Table 63: Global Green Data Centers Industry Revenue Million Forecast, by Solution 2019 & 2032
- Table 64: Global Green Data Centers Industry Revenue Million Forecast, by User 2019 & 2032
- Table 65: Global Green Data Centers Industry Revenue Million Forecast, by Industry Vertical 2019 & 2032
- Table 66: Global Green Data Centers Industry Revenue Million Forecast, by Country 2019 & 2032
- Table 67: Global Green Data Centers Industry Revenue Million Forecast, by Service 2019 & 2032
- Table 68: Global Green Data Centers Industry Revenue Million Forecast, by Solution 2019 & 2032
- Table 69: Global Green Data Centers Industry Revenue Million Forecast, by User 2019 & 2032
- Table 70: Global Green Data Centers Industry Revenue Million Forecast, by Industry Vertical 2019 & 2032
- Table 71: Global Green Data Centers Industry Revenue Million Forecast, by Country 2019 & 2032
- Table 72: Global Green Data Centers Industry Revenue Million Forecast, by Service 2019 & 2032
- Table 73: Global Green Data Centers Industry Revenue Million Forecast, by Solution 2019 & 2032
- Table 74: Global Green Data Centers Industry Revenue Million Forecast, by User 2019 & 2032
- Table 75: Global Green Data Centers Industry Revenue Million Forecast, by Industry Vertical 2019 & 2032
- Table 76: Global Green Data Centers Industry Revenue Million Forecast, by Country 2019 & 2032
Frequently Asked Questions
1. What is the projected Compound Annual Growth Rate (CAGR) of the Green Data Centers Industry?
The projected CAGR is approximately 15.99%.
2. Which companies are prominent players in the Green Data Centers Industry?
Key companies in the market include Dell EMC Inc, IBM Corporation, Fujitsu Ltd, Hitachi Ltd, Schneider Electric SE, HP Inc, Cisco Technology Inc, Vertiv Corporation, Eaton Corporation.
3. What are the main segments of the Green Data Centers Industry?
The market segments include Service, Solution, User, Industry Vertical.
4. Can you provide details about the market size?
The market size is estimated to be USD 73.87 Million as of 2022.
5. What are some drivers contributing to market growth?
Increasing Demand for Data Storage; Power Segment to Hold a Significant Market Share.
6. What are the notable trends driving market growth?
Power Segment to Hold a Significant Market Share.
7. Are there any restraints impacting market growth?
Higher Initial Investments.
8. Can you provide examples of recent developments in the market?
November 2022: Norwegian Firm Earth Wind and Power (EWP) signed a partnership with Oilserv to place its green data centers in Oilfields in the Middle East in Kuwait, Iraq, the Kurdistan Region of Iraq, and the United Arab Emirates. The deal converts excess power from burning gas into off-grid compute power in mobile modular data centers, which perform high-performance computing (HPC), and other data center services. This operation has zero impact on the electric grid.
9. What pricing options are available for accessing the report?
Pricing options include single-user, multi-user, and enterprise licenses priced at USD 4750, USD 5250, and USD 8750 respectively.
10. Is the market size provided in terms of value or volume?
The market size is provided in terms of value, measured in Million.
11. Are there any specific market keywords associated with the report?
Yes, the market keyword associated with the report is "Green Data Centers Industry," which aids in identifying and referencing the specific market segment covered.
12. How do I determine which pricing option suits my needs best?
The pricing options vary based on user requirements and access needs. Individual users may opt for single-user licenses, while businesses requiring broader access may choose multi-user or enterprise licenses for cost-effective access to the report.
13. Are there any additional resources or data provided in the Green Data Centers Industry report?
While the report offers comprehensive insights, it's advisable to review the specific contents or supplementary materials provided to ascertain if additional resources or data are available.
14. How can I stay updated on further developments or reports in the Green Data Centers Industry?
To stay informed about further developments, trends, and reports in the Green Data Centers Industry, consider subscribing to industry newsletters, following relevant companies and organizations, or regularly checking reputable industry news sources and publications.
Methodology
Step 1 - Identification of Relevant Samples Size from Population Database


Step 2 - Approaches for Defining Global Market Size (Value, Volume* & Price*)

Note*: In applicable scenarios
Step 3 - Data Sources
Primary Research
- Web Analytics
- Survey Reports
- Research Institute
- Latest Research Reports
- Opinion Leaders
Secondary Research
- Annual Reports
- White Paper
- Latest Press Release
- Industry Association
- Paid Database
- Investor Presentations

Step 4 - Data Triangulation
Involves using different sources of information in order to increase the validity of a study
These sources are likely to be stakeholders in a program - participants, other researchers, program staff, other community members, and so on.
Then we put all data in single framework & apply various statistical tools to find out the dynamic on the market.
During the analysis stage, feedback from the stakeholder groups would be compared to determine areas of agreement as well as areas of divergence
