

Key Insights
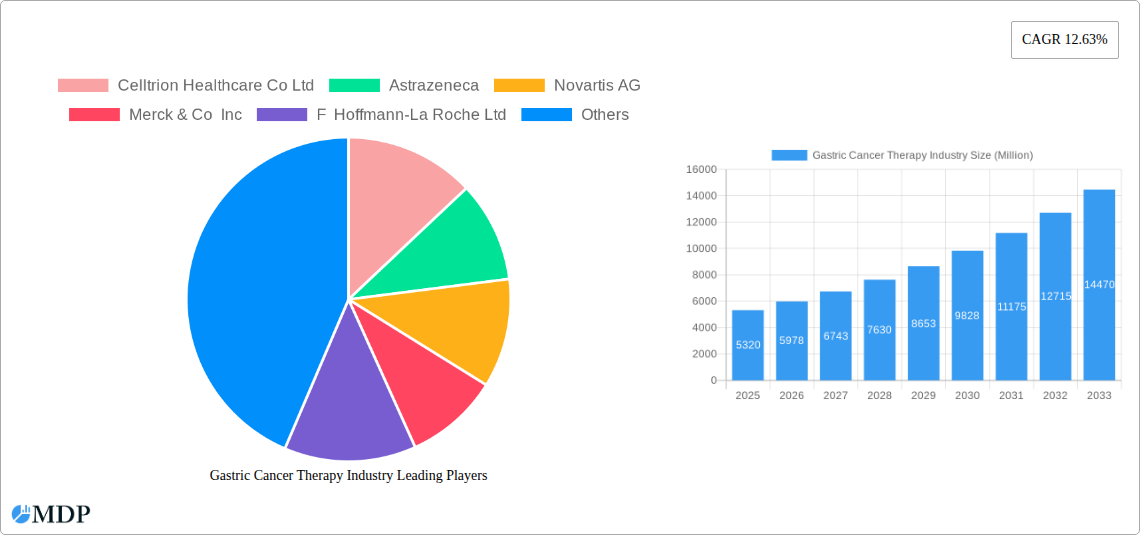
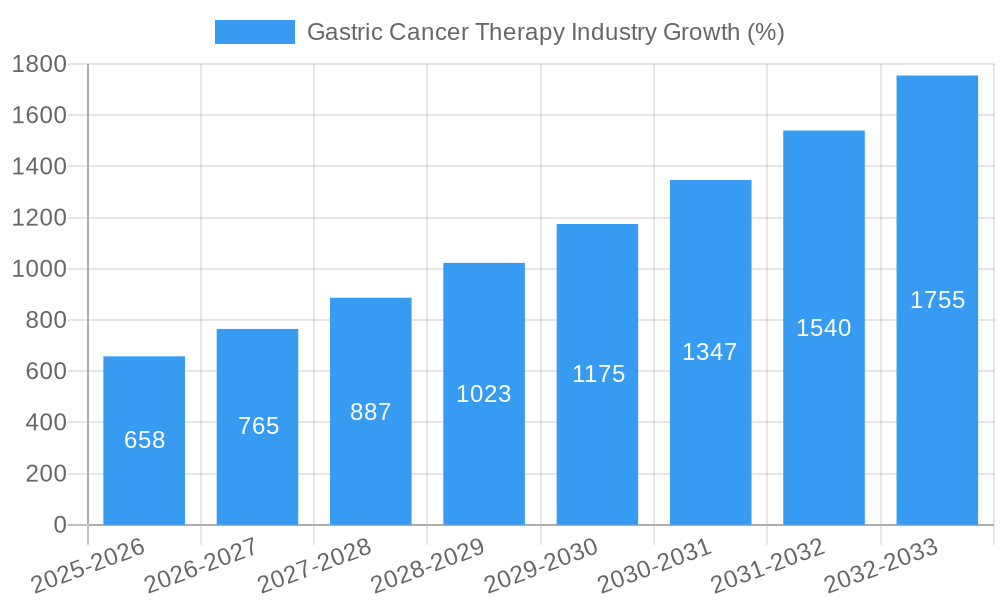
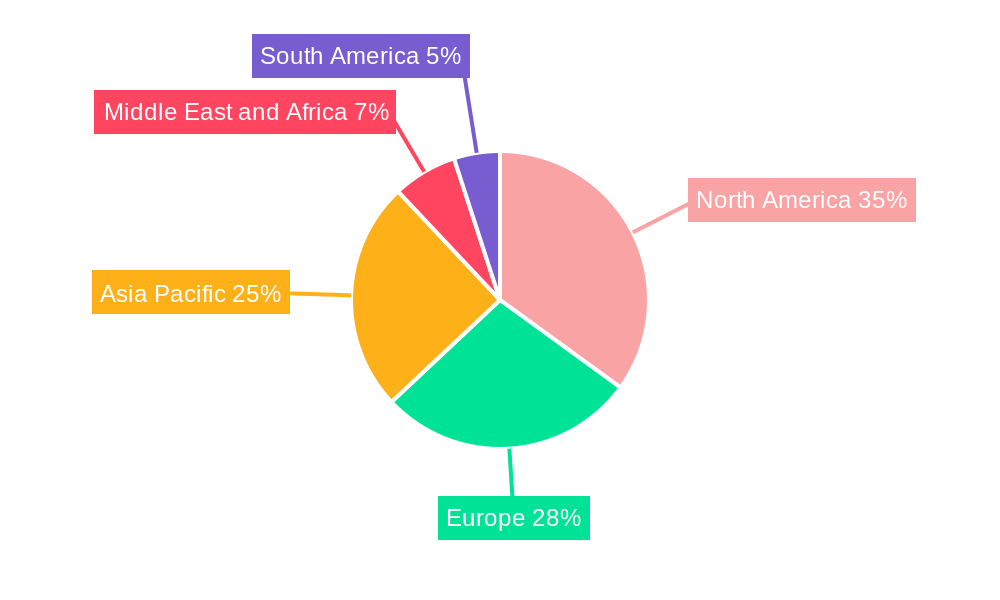
The global gastric cancer therapy market, valued at $5.32 billion in 2025, is projected to experience robust growth, driven by increasing prevalence of gastric cancer, advancements in treatment modalities, and rising healthcare expenditure globally. The market's Compound Annual Growth Rate (CAGR) of 12.63% from 2025 to 2033 indicates significant expansion potential. Key drivers include the rising adoption of targeted therapies and immunotherapies offering improved efficacy and reduced side effects compared to traditional chemotherapy. Furthermore, the increasing geriatric population, a known risk factor for gastric cancer, fuels market growth. The market segmentation reveals a substantial contribution from hospitals and specialty clinics as end-users, reflecting the complexity of gastric cancer treatment requiring specialized medical infrastructure. While advancements in treatment are a significant driver, challenges remain, including the high cost of innovative therapies, access barriers in low- and middle-income countries, and the development of drug resistance. Competition among established pharmaceutical companies like AstraZeneca, Novartis, and Merck, alongside emerging biotech firms, is intense, leading to continuous innovation and a dynamic market landscape. The Asia-Pacific region is expected to be a significant growth area, driven by factors including rising incidence rates and increasing healthcare investment in developing economies within the region.
The market's future growth trajectory will be shaped by several factors. Ongoing research and development efforts focused on personalized medicine and novel therapeutic approaches will play a crucial role. Regulatory approvals for new drugs and therapies will significantly impact market dynamics. Further, government initiatives to improve healthcare infrastructure and access to advanced treatments in developing nations could accelerate market growth. Conversely, potential restraints include the high cost of treatment, which may limit access for patients, and the emergence of drug resistance, necessitating the development of more effective therapeutic strategies. The ongoing focus on improving early detection rates and preventative measures will also influence the long-term market trajectory. Ultimately, the gastric cancer therapy market is poised for substantial growth over the forecast period, presenting lucrative opportunities for both established players and emerging companies in the pharmaceutical and biotechnology sectors.
Gastric Cancer Therapy Market: A Comprehensive Report (2019-2033)
This in-depth report provides a comprehensive analysis of the Gastric Cancer Therapy market, offering invaluable insights for industry stakeholders, investors, and researchers. With a study period spanning 2019-2033, a base year of 2025, and a forecast period of 2025-2033, this report delivers actionable intelligence on market dynamics, key players, and future growth potential. The report incorporates data from the historical period (2019-2024) to provide a robust foundation for future projections. The market is segmented by therapy type (Chemotherapy, Targeted Therapy, Immunotherapy, Radiation Therapy, Surgery) and end-user (Ambulatory Surgery Centers, Hospitals and Specialty Clinics, Other End-users). Key players analyzed include Celltrion Healthcare Co Ltd, AstraZeneca, Novartis AG, Merck & Co Inc, F Hoffmann-La Roche Ltd, Amgen, Eli Lilly and Company, Otsuka Holdings Co Ltd, GSK plc, Imugene Limited, Bristol-Myers Squibb Company, Sanofi S A, and Pfizer Inc. (List not exhaustive). The report projects a market size of xx Million by 2033.
Gastric Cancer Therapy Industry Market Dynamics & Concentration
The global gastric cancer therapy market is characterized by moderate concentration, with a few major players holding significant market share. However, the market exhibits substantial dynamism due to continuous innovation in treatment modalities, evolving regulatory landscapes, and ongoing mergers and acquisitions (M&A) activities. The market share of the top 5 companies in 2024 is estimated at xx%, reflecting a competitive but not overly concentrated landscape. The average deal size for M&A activities in the past five years was approximately xx Million.
- Innovation Drivers: The development of novel targeted therapies, immunotherapies, and combination regimens is driving market growth.
- Regulatory Frameworks: Stringent regulatory approvals influence market entry and product lifecycle management.
- Product Substitutes: The availability of alternative treatment options influences market competition and pricing.
- End-User Trends: The increasing prevalence of gastric cancer and a shift towards minimally invasive procedures are shaping market demand.
- M&A Activities: Strategic partnerships and acquisitions contribute to market consolidation and expansion of product portfolios. The number of M&A deals in the past five years averaged xx per year.
Gastric Cancer Therapy Industry Industry Trends & Analysis
The gastric cancer therapy market is witnessing robust growth, driven by several factors. The rising prevalence of gastric cancer globally is a primary growth driver, fueled by increasing risk factors like Helicobacter pylori infection and unhealthy lifestyles. Technological advancements, such as the development of targeted therapies and immunotherapies, have significantly improved treatment outcomes, leading to increased market penetration. The compound annual growth rate (CAGR) for the forecast period (2025-2033) is projected at xx%. Market penetration of advanced therapies, such as immunotherapy, is expected to increase from xx% in 2024 to xx% by 2033. The market is also experiencing a shift towards personalized medicine, with treatments tailored to individual patient characteristics. Competitive dynamics are intense, with major pharmaceutical companies investing heavily in R&D to develop innovative therapies and expand their market presence. Consumer preferences are increasingly driven by the desire for less invasive treatments with fewer side effects.
Leading Markets & Segments in Gastric Cancer Therapy Industry
The North American market currently holds the largest share of the gastric cancer therapy market, driven by factors such as high healthcare expenditure, advanced healthcare infrastructure, and early adoption of new therapies. Within therapy types, Chemotherapy maintains a substantial share owing to its established efficacy and widespread availability, although Targeted Therapy and Immunotherapy segments are exhibiting higher growth rates.
Key Drivers in North America:
- High healthcare expenditure
- Advanced healthcare infrastructure
- Strong regulatory support for new drug approvals
- High awareness and early adoption of new therapies
Key Drivers in Asia-Pacific:
- Rising prevalence of gastric cancer
- Increasing healthcare spending
- Growing awareness of advanced treatment options
Hospitals and Specialty Clinics constitute the dominant end-user segment, driven by their advanced infrastructure and expertise in oncology treatment. However, the Ambulatory Surgery Centers segment is experiencing significant growth due to the increasing preference for cost-effective and less invasive procedures.
Gastric Cancer Therapy Industry Product Developments
Recent years have witnessed significant advancements in gastric cancer therapy, with a focus on improving treatment efficacy and reducing side effects. The development of novel targeted therapies, immunotherapies, and combination regimens has dramatically altered treatment paradigms. These advancements have led to improved patient outcomes and prolonged survival rates, further driving market growth. The ongoing trend towards personalized medicine is shaping product development, with therapies increasingly tailored to specific genetic and molecular characteristics of the tumor.
Key Drivers of Gastric Cancer Therapy Industry Growth
The gastric cancer therapy market is propelled by several key drivers:
- The rising prevalence of gastric cancer globally.
- Technological advancements leading to improved treatment efficacy and patient outcomes.
- Increasing healthcare expenditure and insurance coverage for cancer treatments.
- Growing awareness among patients and healthcare professionals about advanced treatment options.
- Favorable regulatory environments supporting the development and launch of new therapies.
Challenges in the Gastric Cancer Therapy Industry Market
The Gastric Cancer Therapy market faces several challenges:
- High cost of treatment, limiting accessibility for patients in developing countries.
- Stringent regulatory approvals for new drugs, extending the time to market.
- Complex treatment regimens requiring specialized expertise, posing challenges for healthcare providers.
- Development of drug resistance, necessitating the ongoing search for novel treatment strategies.
- Intense competition among established pharmaceutical companies and emerging biotech firms.
Emerging Opportunities in Gastric Cancer Therapy Industry
Significant opportunities exist within the gastric cancer therapy market, fueled by the ongoing development of innovative therapies and growing demand for effective treatments. Advancements in immunotherapy, targeted therapy, and combination regimens offer promising avenues for improving treatment outcomes and enhancing patient quality of life. Strategic partnerships between pharmaceutical companies and academic research institutions can accelerate the development and commercialization of novel therapies. Expansion into emerging markets with high unmet needs presents substantial growth potential.
Leading Players in the Gastric Cancer Therapy Industry Sector
- Celltrion Healthcare Co Ltd
- AstraZeneca
- Novartis AG
- Merck & Co Inc
- F Hoffmann-La Roche Ltd
- Amgen
- Eli Lilly and Company
- Otsuka Holdings Co Ltd
- GSK plc
- Imugene Limited
- Bristol-Myers Squibb Company
- Sanofi S A
- Pfizer Inc
Key Milestones in Gastric Cancer Therapy Industry Industry
- March 2023: Akeso, Inc. completed patient enrollment for its pivotal Phase III clinical trial of cadonilimab (PD-1/CTLA-4 bi-specific antibody, AK104), a pioneering dual-immune checkpoint bi-specific antibody drug. This significantly advances the potential for a new treatment option.
- January 2023: Eisai Co., Ltd. presented research on various gastrointestinal cancers at the 2023 ASCO GI (#GI23) symposium. This highlights ongoing research and development efforts within the field.
Strategic Outlook for Gastric Cancer Therapy Industry Market
The future of the gastric cancer therapy market is promising, driven by continuous innovation, growing patient populations, and increasing healthcare spending. Strategic partnerships, focused R&D investments, and expansion into underserved markets will be key to achieving long-term success. The market is poised for significant growth, with substantial potential for companies that can effectively navigate the competitive landscape and deliver innovative, cost-effective treatment options.
Gastric Cancer Therapy Industry Segmentation
-
1. Therapy Type
- 1.1. Chemotherapy
- 1.2. Targeted Therapy
- 1.3. Immunotherapy
- 1.4. Radiation Therapy
- 1.5. Surgery
-
2. End-User
- 2.1. Ambulatory Surgery Centers
- 2.2. Hospitals and Specialty Clinics
- 2.3. Other End-users
Gastric Cancer Therapy Industry Segmentation By Geography
-
1. North America
- 1.1. United States
- 1.2. Canada
- 1.3. Mexico
-
2. Europe
- 2.1. Germany
- 2.2. United Kingdom
- 2.3. France
- 2.4. Italy
- 2.5. Spain
- 2.6. Rest of Europe
-
3. Asia Pacific
- 3.1. China
- 3.2. Japan
- 3.3. India
- 3.4. Australia
- 3.5. South Korea
- 3.6. Rest of Asia Pacific
-
4. Middle East and Africa
- 4.1. GCC
- 4.2. South Africa
- 4.3. Rest of Middle East and Africa
-
5. South America
- 5.1. Brazil
- 5.2. Argentina
- 5.3. Rest of South America
Gastric Cancer Therapy Industry REPORT HIGHLIGHTS
| Aspects | Details |
|---|---|
| Study Period | 2019-2033 |
| Base Year | 2024 |
| Estimated Year | 2025 |
| Forecast Period | 2025-2033 |
| Historical Period | 2019-2024 |
| Growth Rate | CAGR of 12.63% from 2019-2033 |
| Segmentation |
|
Table of Contents
- 1. Introduction
- 1.1. Research Scope
- 1.2. Market Segmentation
- 1.3. Research Methodology
- 1.4. Definitions and Assumptions
- 2. Executive Summary
- 2.1. Introduction
- 3. Market Dynamics
- 3.1. Introduction
- 3.2. Market Drivers
- 3.2.1. Growing Burden of Gastric Cancer; Increase in Research and Development for Novel Therapies Coupled with Government Initiatives
- 3.3. Market Restrains
- 3.3.1. High Cost of Cancer Therapy and Side Effects of Cancer Drugs
- 3.4. Market Trends
- 3.4.1. Targeted Segment is Expected to Hold a Significant Share of the Market Over the Forecast Period
- 4. Market Factor Analysis
- 4.1. Porters Five Forces
- 4.2. Supply/Value Chain
- 4.3. PESTEL analysis
- 4.4. Market Entropy
- 4.5. Patent/Trademark Analysis
- 5. Global Gastric Cancer Therapy Industry Analysis, Insights and Forecast, 2019-2031
- 5.1. Market Analysis, Insights and Forecast - by Therapy Type
- 5.1.1. Chemotherapy
- 5.1.2. Targeted Therapy
- 5.1.3. Immunotherapy
- 5.1.4. Radiation Therapy
- 5.1.5. Surgery
- 5.2. Market Analysis, Insights and Forecast - by End-User
- 5.2.1. Ambulatory Surgery Centers
- 5.2.2. Hospitals and Specialty Clinics
- 5.2.3. Other End-users
- 5.3. Market Analysis, Insights and Forecast - by Region
- 5.3.1. North America
- 5.3.2. Europe
- 5.3.3. Asia Pacific
- 5.3.4. Middle East and Africa
- 5.3.5. South America
- 5.1. Market Analysis, Insights and Forecast - by Therapy Type
- 6. North America Gastric Cancer Therapy Industry Analysis, Insights and Forecast, 2019-2031
- 6.1. Market Analysis, Insights and Forecast - by Therapy Type
- 6.1.1. Chemotherapy
- 6.1.2. Targeted Therapy
- 6.1.3. Immunotherapy
- 6.1.4. Radiation Therapy
- 6.1.5. Surgery
- 6.2. Market Analysis, Insights and Forecast - by End-User
- 6.2.1. Ambulatory Surgery Centers
- 6.2.2. Hospitals and Specialty Clinics
- 6.2.3. Other End-users
- 6.1. Market Analysis, Insights and Forecast - by Therapy Type
- 7. Europe Gastric Cancer Therapy Industry Analysis, Insights and Forecast, 2019-2031
- 7.1. Market Analysis, Insights and Forecast - by Therapy Type
- 7.1.1. Chemotherapy
- 7.1.2. Targeted Therapy
- 7.1.3. Immunotherapy
- 7.1.4. Radiation Therapy
- 7.1.5. Surgery
- 7.2. Market Analysis, Insights and Forecast - by End-User
- 7.2.1. Ambulatory Surgery Centers
- 7.2.2. Hospitals and Specialty Clinics
- 7.2.3. Other End-users
- 7.1. Market Analysis, Insights and Forecast - by Therapy Type
- 8. Asia Pacific Gastric Cancer Therapy Industry Analysis, Insights and Forecast, 2019-2031
- 8.1. Market Analysis, Insights and Forecast - by Therapy Type
- 8.1.1. Chemotherapy
- 8.1.2. Targeted Therapy
- 8.1.3. Immunotherapy
- 8.1.4. Radiation Therapy
- 8.1.5. Surgery
- 8.2. Market Analysis, Insights and Forecast - by End-User
- 8.2.1. Ambulatory Surgery Centers
- 8.2.2. Hospitals and Specialty Clinics
- 8.2.3. Other End-users
- 8.1. Market Analysis, Insights and Forecast - by Therapy Type
- 9. Middle East and Africa Gastric Cancer Therapy Industry Analysis, Insights and Forecast, 2019-2031
- 9.1. Market Analysis, Insights and Forecast - by Therapy Type
- 9.1.1. Chemotherapy
- 9.1.2. Targeted Therapy
- 9.1.3. Immunotherapy
- 9.1.4. Radiation Therapy
- 9.1.5. Surgery
- 9.2. Market Analysis, Insights and Forecast - by End-User
- 9.2.1. Ambulatory Surgery Centers
- 9.2.2. Hospitals and Specialty Clinics
- 9.2.3. Other End-users
- 9.1. Market Analysis, Insights and Forecast - by Therapy Type
- 10. South America Gastric Cancer Therapy Industry Analysis, Insights and Forecast, 2019-2031
- 10.1. Market Analysis, Insights and Forecast - by Therapy Type
- 10.1.1. Chemotherapy
- 10.1.2. Targeted Therapy
- 10.1.3. Immunotherapy
- 10.1.4. Radiation Therapy
- 10.1.5. Surgery
- 10.2. Market Analysis, Insights and Forecast - by End-User
- 10.2.1. Ambulatory Surgery Centers
- 10.2.2. Hospitals and Specialty Clinics
- 10.2.3. Other End-users
- 10.1. Market Analysis, Insights and Forecast - by Therapy Type
- 11. North America Gastric Cancer Therapy Industry Analysis, Insights and Forecast, 2019-2031
- 11.1. Market Analysis, Insights and Forecast - By Country/Sub-region
- 11.1.1 United States
- 11.1.2 Canada
- 11.1.3 Mexico
- 12. Europe Gastric Cancer Therapy Industry Analysis, Insights and Forecast, 2019-2031
- 12.1. Market Analysis, Insights and Forecast - By Country/Sub-region
- 12.1.1 Germany
- 12.1.2 United Kingdom
- 12.1.3 France
- 12.1.4 Italy
- 12.1.5 Spain
- 12.1.6 Rest of Europe
- 13. Asia Pacific Gastric Cancer Therapy Industry Analysis, Insights and Forecast, 2019-2031
- 13.1. Market Analysis, Insights and Forecast - By Country/Sub-region
- 13.1.1 China
- 13.1.2 Japan
- 13.1.3 India
- 13.1.4 Australia
- 13.1.5 South Korea
- 13.1.6 Rest of Asia Pacific
- 14. Middle East and Africa Gastric Cancer Therapy Industry Analysis, Insights and Forecast, 2019-2031
- 14.1. Market Analysis, Insights and Forecast - By Country/Sub-region
- 14.1.1 GCC
- 14.1.2 South Africa
- 14.1.3 Rest of Middle East and Africa
- 15. South America Gastric Cancer Therapy Industry Analysis, Insights and Forecast, 2019-2031
- 15.1. Market Analysis, Insights and Forecast - By Country/Sub-region
- 15.1.1 Brazil
- 15.1.2 Argentina
- 15.1.3 Rest of South America
- 16. Competitive Analysis
- 16.1. Global Market Share Analysis 2024
- 16.2. Company Profiles
- 16.2.1 Celltrion Healthcare Co Ltd
- 16.2.1.1. Overview
- 16.2.1.2. Products
- 16.2.1.3. SWOT Analysis
- 16.2.1.4. Recent Developments
- 16.2.1.5. Financials (Based on Availability)
- 16.2.2 Astrazeneca
- 16.2.2.1. Overview
- 16.2.2.2. Products
- 16.2.2.3. SWOT Analysis
- 16.2.2.4. Recent Developments
- 16.2.2.5. Financials (Based on Availability)
- 16.2.3 Novartis AG
- 16.2.3.1. Overview
- 16.2.3.2. Products
- 16.2.3.3. SWOT Analysis
- 16.2.3.4. Recent Developments
- 16.2.3.5. Financials (Based on Availability)
- 16.2.4 Merck & Co Inc
- 16.2.4.1. Overview
- 16.2.4.2. Products
- 16.2.4.3. SWOT Analysis
- 16.2.4.4. Recent Developments
- 16.2.4.5. Financials (Based on Availability)
- 16.2.5 F Hoffmann-La Roche Ltd
- 16.2.5.1. Overview
- 16.2.5.2. Products
- 16.2.5.3. SWOT Analysis
- 16.2.5.4. Recent Developments
- 16.2.5.5. Financials (Based on Availability)
- 16.2.6 Amgen*List Not Exhaustive
- 16.2.6.1. Overview
- 16.2.6.2. Products
- 16.2.6.3. SWOT Analysis
- 16.2.6.4. Recent Developments
- 16.2.6.5. Financials (Based on Availability)
- 16.2.7 Eli Lilly and Company
- 16.2.7.1. Overview
- 16.2.7.2. Products
- 16.2.7.3. SWOT Analysis
- 16.2.7.4. Recent Developments
- 16.2.7.5. Financials (Based on Availability)
- 16.2.8 Otsuka Holdings Co Ltd
- 16.2.8.1. Overview
- 16.2.8.2. Products
- 16.2.8.3. SWOT Analysis
- 16.2.8.4. Recent Developments
- 16.2.8.5. Financials (Based on Availability)
- 16.2.9 GSK plc
- 16.2.9.1. Overview
- 16.2.9.2. Products
- 16.2.9.3. SWOT Analysis
- 16.2.9.4. Recent Developments
- 16.2.9.5. Financials (Based on Availability)
- 16.2.10 Imugene Limited
- 16.2.10.1. Overview
- 16.2.10.2. Products
- 16.2.10.3. SWOT Analysis
- 16.2.10.4. Recent Developments
- 16.2.10.5. Financials (Based on Availability)
- 16.2.11 Bristol-Myers Squibb Company
- 16.2.11.1. Overview
- 16.2.11.2. Products
- 16.2.11.3. SWOT Analysis
- 16.2.11.4. Recent Developments
- 16.2.11.5. Financials (Based on Availability)
- 16.2.12 Sanofi S A
- 16.2.12.1. Overview
- 16.2.12.2. Products
- 16.2.12.3. SWOT Analysis
- 16.2.12.4. Recent Developments
- 16.2.12.5. Financials (Based on Availability)
- 16.2.13 Pfizer Inc
- 16.2.13.1. Overview
- 16.2.13.2. Products
- 16.2.13.3. SWOT Analysis
- 16.2.13.4. Recent Developments
- 16.2.13.5. Financials (Based on Availability)
- 16.2.1 Celltrion Healthcare Co Ltd
List of Figures
- Figure 1: Global Gastric Cancer Therapy Industry Revenue Breakdown (Million, %) by Region 2024 & 2032
- Figure 2: North America Gastric Cancer Therapy Industry Revenue (Million), by Country 2024 & 2032
- Figure 3: North America Gastric Cancer Therapy Industry Revenue Share (%), by Country 2024 & 2032
- Figure 4: Europe Gastric Cancer Therapy Industry Revenue (Million), by Country 2024 & 2032
- Figure 5: Europe Gastric Cancer Therapy Industry Revenue Share (%), by Country 2024 & 2032
- Figure 6: Asia Pacific Gastric Cancer Therapy Industry Revenue (Million), by Country 2024 & 2032
- Figure 7: Asia Pacific Gastric Cancer Therapy Industry Revenue Share (%), by Country 2024 & 2032
- Figure 8: Middle East and Africa Gastric Cancer Therapy Industry Revenue (Million), by Country 2024 & 2032
- Figure 9: Middle East and Africa Gastric Cancer Therapy Industry Revenue Share (%), by Country 2024 & 2032
- Figure 10: South America Gastric Cancer Therapy Industry Revenue (Million), by Country 2024 & 2032
- Figure 11: South America Gastric Cancer Therapy Industry Revenue Share (%), by Country 2024 & 2032
- Figure 12: North America Gastric Cancer Therapy Industry Revenue (Million), by Therapy Type 2024 & 2032
- Figure 13: North America Gastric Cancer Therapy Industry Revenue Share (%), by Therapy Type 2024 & 2032
- Figure 14: North America Gastric Cancer Therapy Industry Revenue (Million), by End-User 2024 & 2032
- Figure 15: North America Gastric Cancer Therapy Industry Revenue Share (%), by End-User 2024 & 2032
- Figure 16: North America Gastric Cancer Therapy Industry Revenue (Million), by Country 2024 & 2032
- Figure 17: North America Gastric Cancer Therapy Industry Revenue Share (%), by Country 2024 & 2032
- Figure 18: Europe Gastric Cancer Therapy Industry Revenue (Million), by Therapy Type 2024 & 2032
- Figure 19: Europe Gastric Cancer Therapy Industry Revenue Share (%), by Therapy Type 2024 & 2032
- Figure 20: Europe Gastric Cancer Therapy Industry Revenue (Million), by End-User 2024 & 2032
- Figure 21: Europe Gastric Cancer Therapy Industry Revenue Share (%), by End-User 2024 & 2032
- Figure 22: Europe Gastric Cancer Therapy Industry Revenue (Million), by Country 2024 & 2032
- Figure 23: Europe Gastric Cancer Therapy Industry Revenue Share (%), by Country 2024 & 2032
- Figure 24: Asia Pacific Gastric Cancer Therapy Industry Revenue (Million), by Therapy Type 2024 & 2032
- Figure 25: Asia Pacific Gastric Cancer Therapy Industry Revenue Share (%), by Therapy Type 2024 & 2032
- Figure 26: Asia Pacific Gastric Cancer Therapy Industry Revenue (Million), by End-User 2024 & 2032
- Figure 27: Asia Pacific Gastric Cancer Therapy Industry Revenue Share (%), by End-User 2024 & 2032
- Figure 28: Asia Pacific Gastric Cancer Therapy Industry Revenue (Million), by Country 2024 & 2032
- Figure 29: Asia Pacific Gastric Cancer Therapy Industry Revenue Share (%), by Country 2024 & 2032
- Figure 30: Middle East and Africa Gastric Cancer Therapy Industry Revenue (Million), by Therapy Type 2024 & 2032
- Figure 31: Middle East and Africa Gastric Cancer Therapy Industry Revenue Share (%), by Therapy Type 2024 & 2032
- Figure 32: Middle East and Africa Gastric Cancer Therapy Industry Revenue (Million), by End-User 2024 & 2032
- Figure 33: Middle East and Africa Gastric Cancer Therapy Industry Revenue Share (%), by End-User 2024 & 2032
- Figure 34: Middle East and Africa Gastric Cancer Therapy Industry Revenue (Million), by Country 2024 & 2032
- Figure 35: Middle East and Africa Gastric Cancer Therapy Industry Revenue Share (%), by Country 2024 & 2032
- Figure 36: South America Gastric Cancer Therapy Industry Revenue (Million), by Therapy Type 2024 & 2032
- Figure 37: South America Gastric Cancer Therapy Industry Revenue Share (%), by Therapy Type 2024 & 2032
- Figure 38: South America Gastric Cancer Therapy Industry Revenue (Million), by End-User 2024 & 2032
- Figure 39: South America Gastric Cancer Therapy Industry Revenue Share (%), by End-User 2024 & 2032
- Figure 40: South America Gastric Cancer Therapy Industry Revenue (Million), by Country 2024 & 2032
- Figure 41: South America Gastric Cancer Therapy Industry Revenue Share (%), by Country 2024 & 2032
List of Tables
- Table 1: Global Gastric Cancer Therapy Industry Revenue Million Forecast, by Region 2019 & 2032
- Table 2: Global Gastric Cancer Therapy Industry Revenue Million Forecast, by Therapy Type 2019 & 2032
- Table 3: Global Gastric Cancer Therapy Industry Revenue Million Forecast, by End-User 2019 & 2032
- Table 4: Global Gastric Cancer Therapy Industry Revenue Million Forecast, by Region 2019 & 2032
- Table 5: Global Gastric Cancer Therapy Industry Revenue Million Forecast, by Country 2019 & 2032
- Table 6: United States Gastric Cancer Therapy Industry Revenue (Million) Forecast, by Application 2019 & 2032
- Table 7: Canada Gastric Cancer Therapy Industry Revenue (Million) Forecast, by Application 2019 & 2032
- Table 8: Mexico Gastric Cancer Therapy Industry Revenue (Million) Forecast, by Application 2019 & 2032
- Table 9: Global Gastric Cancer Therapy Industry Revenue Million Forecast, by Country 2019 & 2032
- Table 10: Germany Gastric Cancer Therapy Industry Revenue (Million) Forecast, by Application 2019 & 2032
- Table 11: United Kingdom Gastric Cancer Therapy Industry Revenue (Million) Forecast, by Application 2019 & 2032
- Table 12: France Gastric Cancer Therapy Industry Revenue (Million) Forecast, by Application 2019 & 2032
- Table 13: Italy Gastric Cancer Therapy Industry Revenue (Million) Forecast, by Application 2019 & 2032
- Table 14: Spain Gastric Cancer Therapy Industry Revenue (Million) Forecast, by Application 2019 & 2032
- Table 15: Rest of Europe Gastric Cancer Therapy Industry Revenue (Million) Forecast, by Application 2019 & 2032
- Table 16: Global Gastric Cancer Therapy Industry Revenue Million Forecast, by Country 2019 & 2032
- Table 17: China Gastric Cancer Therapy Industry Revenue (Million) Forecast, by Application 2019 & 2032
- Table 18: Japan Gastric Cancer Therapy Industry Revenue (Million) Forecast, by Application 2019 & 2032
- Table 19: India Gastric Cancer Therapy Industry Revenue (Million) Forecast, by Application 2019 & 2032
- Table 20: Australia Gastric Cancer Therapy Industry Revenue (Million) Forecast, by Application 2019 & 2032
- Table 21: South Korea Gastric Cancer Therapy Industry Revenue (Million) Forecast, by Application 2019 & 2032
- Table 22: Rest of Asia Pacific Gastric Cancer Therapy Industry Revenue (Million) Forecast, by Application 2019 & 2032
- Table 23: Global Gastric Cancer Therapy Industry Revenue Million Forecast, by Country 2019 & 2032
- Table 24: GCC Gastric Cancer Therapy Industry Revenue (Million) Forecast, by Application 2019 & 2032
- Table 25: South Africa Gastric Cancer Therapy Industry Revenue (Million) Forecast, by Application 2019 & 2032
- Table 26: Rest of Middle East and Africa Gastric Cancer Therapy Industry Revenue (Million) Forecast, by Application 2019 & 2032
- Table 27: Global Gastric Cancer Therapy Industry Revenue Million Forecast, by Country 2019 & 2032
- Table 28: Brazil Gastric Cancer Therapy Industry Revenue (Million) Forecast, by Application 2019 & 2032
- Table 29: Argentina Gastric Cancer Therapy Industry Revenue (Million) Forecast, by Application 2019 & 2032
- Table 30: Rest of South America Gastric Cancer Therapy Industry Revenue (Million) Forecast, by Application 2019 & 2032
- Table 31: Global Gastric Cancer Therapy Industry Revenue Million Forecast, by Therapy Type 2019 & 2032
- Table 32: Global Gastric Cancer Therapy Industry Revenue Million Forecast, by End-User 2019 & 2032
- Table 33: Global Gastric Cancer Therapy Industry Revenue Million Forecast, by Country 2019 & 2032
- Table 34: United States Gastric Cancer Therapy Industry Revenue (Million) Forecast, by Application 2019 & 2032
- Table 35: Canada Gastric Cancer Therapy Industry Revenue (Million) Forecast, by Application 2019 & 2032
- Table 36: Mexico Gastric Cancer Therapy Industry Revenue (Million) Forecast, by Application 2019 & 2032
- Table 37: Global Gastric Cancer Therapy Industry Revenue Million Forecast, by Therapy Type 2019 & 2032
- Table 38: Global Gastric Cancer Therapy Industry Revenue Million Forecast, by End-User 2019 & 2032
- Table 39: Global Gastric Cancer Therapy Industry Revenue Million Forecast, by Country 2019 & 2032
- Table 40: Germany Gastric Cancer Therapy Industry Revenue (Million) Forecast, by Application 2019 & 2032
- Table 41: United Kingdom Gastric Cancer Therapy Industry Revenue (Million) Forecast, by Application 2019 & 2032
- Table 42: France Gastric Cancer Therapy Industry Revenue (Million) Forecast, by Application 2019 & 2032
- Table 43: Italy Gastric Cancer Therapy Industry Revenue (Million) Forecast, by Application 2019 & 2032
- Table 44: Spain Gastric Cancer Therapy Industry Revenue (Million) Forecast, by Application 2019 & 2032
- Table 45: Rest of Europe Gastric Cancer Therapy Industry Revenue (Million) Forecast, by Application 2019 & 2032
- Table 46: Global Gastric Cancer Therapy Industry Revenue Million Forecast, by Therapy Type 2019 & 2032
- Table 47: Global Gastric Cancer Therapy Industry Revenue Million Forecast, by End-User 2019 & 2032
- Table 48: Global Gastric Cancer Therapy Industry Revenue Million Forecast, by Country 2019 & 2032
- Table 49: China Gastric Cancer Therapy Industry Revenue (Million) Forecast, by Application 2019 & 2032
- Table 50: Japan Gastric Cancer Therapy Industry Revenue (Million) Forecast, by Application 2019 & 2032
- Table 51: India Gastric Cancer Therapy Industry Revenue (Million) Forecast, by Application 2019 & 2032
- Table 52: Australia Gastric Cancer Therapy Industry Revenue (Million) Forecast, by Application 2019 & 2032
- Table 53: South Korea Gastric Cancer Therapy Industry Revenue (Million) Forecast, by Application 2019 & 2032
- Table 54: Rest of Asia Pacific Gastric Cancer Therapy Industry Revenue (Million) Forecast, by Application 2019 & 2032
- Table 55: Global Gastric Cancer Therapy Industry Revenue Million Forecast, by Therapy Type 2019 & 2032
- Table 56: Global Gastric Cancer Therapy Industry Revenue Million Forecast, by End-User 2019 & 2032
- Table 57: Global Gastric Cancer Therapy Industry Revenue Million Forecast, by Country 2019 & 2032
- Table 58: GCC Gastric Cancer Therapy Industry Revenue (Million) Forecast, by Application 2019 & 2032
- Table 59: South Africa Gastric Cancer Therapy Industry Revenue (Million) Forecast, by Application 2019 & 2032
- Table 60: Rest of Middle East and Africa Gastric Cancer Therapy Industry Revenue (Million) Forecast, by Application 2019 & 2032
- Table 61: Global Gastric Cancer Therapy Industry Revenue Million Forecast, by Therapy Type 2019 & 2032
- Table 62: Global Gastric Cancer Therapy Industry Revenue Million Forecast, by End-User 2019 & 2032
- Table 63: Global Gastric Cancer Therapy Industry Revenue Million Forecast, by Country 2019 & 2032
- Table 64: Brazil Gastric Cancer Therapy Industry Revenue (Million) Forecast, by Application 2019 & 2032
- Table 65: Argentina Gastric Cancer Therapy Industry Revenue (Million) Forecast, by Application 2019 & 2032
- Table 66: Rest of South America Gastric Cancer Therapy Industry Revenue (Million) Forecast, by Application 2019 & 2032
Frequently Asked Questions
1. What is the projected Compound Annual Growth Rate (CAGR) of the Gastric Cancer Therapy Industry?
The projected CAGR is approximately 12.63%.
2. Which companies are prominent players in the Gastric Cancer Therapy Industry?
Key companies in the market include Celltrion Healthcare Co Ltd, Astrazeneca, Novartis AG, Merck & Co Inc, F Hoffmann-La Roche Ltd, Amgen*List Not Exhaustive, Eli Lilly and Company, Otsuka Holdings Co Ltd, GSK plc, Imugene Limited, Bristol-Myers Squibb Company, Sanofi S A, Pfizer Inc.
3. What are the main segments of the Gastric Cancer Therapy Industry?
The market segments include Therapy Type, End-User.
4. Can you provide details about the market size?
The market size is estimated to be USD 5.32 Million as of 2022.
5. What are some drivers contributing to market growth?
Growing Burden of Gastric Cancer; Increase in Research and Development for Novel Therapies Coupled with Government Initiatives.
6. What are the notable trends driving market growth?
Targeted Segment is Expected to Hold a Significant Share of the Market Over the Forecast Period.
7. Are there any restraints impacting market growth?
High Cost of Cancer Therapy and Side Effects of Cancer Drugs.
8. Can you provide examples of recent developments in the market?
March 2023: Akeso, Inc., completed the patient enrollment for its pivotal Phase III clinical trial involving cadonilimab (PD-1/CTLA-4 bi-specific antibody, AK104), which stands as the world's pioneering dual-immune checkpoint bi-specific antibody drug to be approved and brought to market. This marks a step closer to the launch of cadonilimab for a major indication after the indication for treatment of cervical cancer has been approved.
9. What pricing options are available for accessing the report?
Pricing options include single-user, multi-user, and enterprise licenses priced at USD 4750, USD 5250, and USD 8750 respectively.
10. Is the market size provided in terms of value or volume?
The market size is provided in terms of value, measured in Million.
11. Are there any specific market keywords associated with the report?
Yes, the market keyword associated with the report is "Gastric Cancer Therapy Industry," which aids in identifying and referencing the specific market segment covered.
12. How do I determine which pricing option suits my needs best?
The pricing options vary based on user requirements and access needs. Individual users may opt for single-user licenses, while businesses requiring broader access may choose multi-user or enterprise licenses for cost-effective access to the report.
13. Are there any additional resources or data provided in the Gastric Cancer Therapy Industry report?
While the report offers comprehensive insights, it's advisable to review the specific contents or supplementary materials provided to ascertain if additional resources or data are available.
14. How can I stay updated on further developments or reports in the Gastric Cancer Therapy Industry?
To stay informed about further developments, trends, and reports in the Gastric Cancer Therapy Industry, consider subscribing to industry newsletters, following relevant companies and organizations, or regularly checking reputable industry news sources and publications.
Methodology
Step 1 - Identification of Relevant Samples Size from Population Database


Step 2 - Approaches for Defining Global Market Size (Value, Volume* & Price*)

Note*: In applicable scenarios
Step 3 - Data Sources
Primary Research
- Web Analytics
- Survey Reports
- Research Institute
- Latest Research Reports
- Opinion Leaders
Secondary Research
- Annual Reports
- White Paper
- Latest Press Release
- Industry Association
- Paid Database
- Investor Presentations

Step 4 - Data Triangulation
Involves using different sources of information in order to increase the validity of a study
These sources are likely to be stakeholders in a program - participants, other researchers, program staff, other community members, and so on.
Then we put all data in single framework & apply various statistical tools to find out the dynamic on the market.
During the analysis stage, feedback from the stakeholder groups would be compared to determine areas of agreement as well as areas of divergence
