

Key Insights
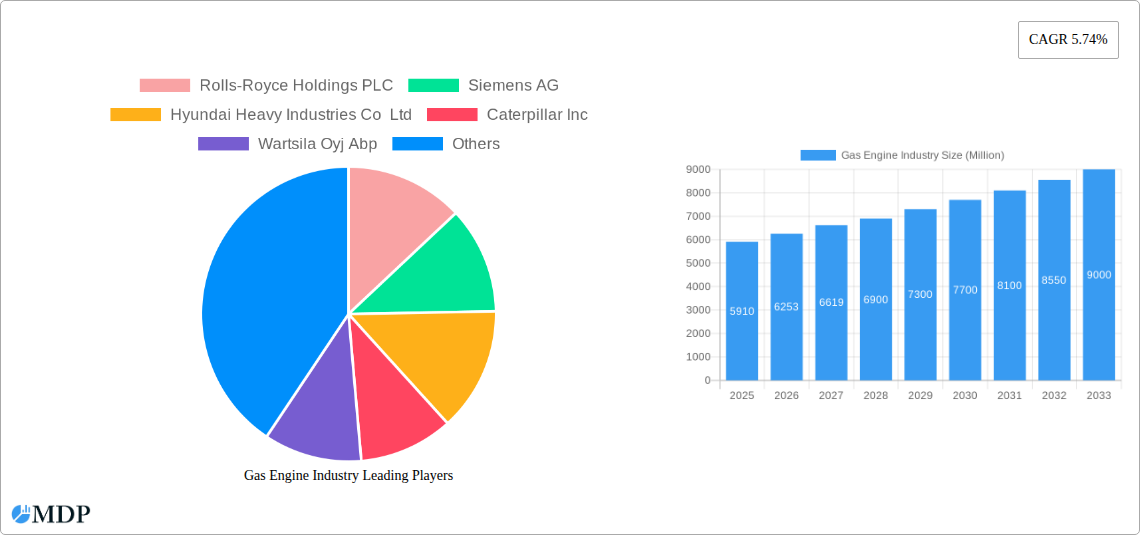
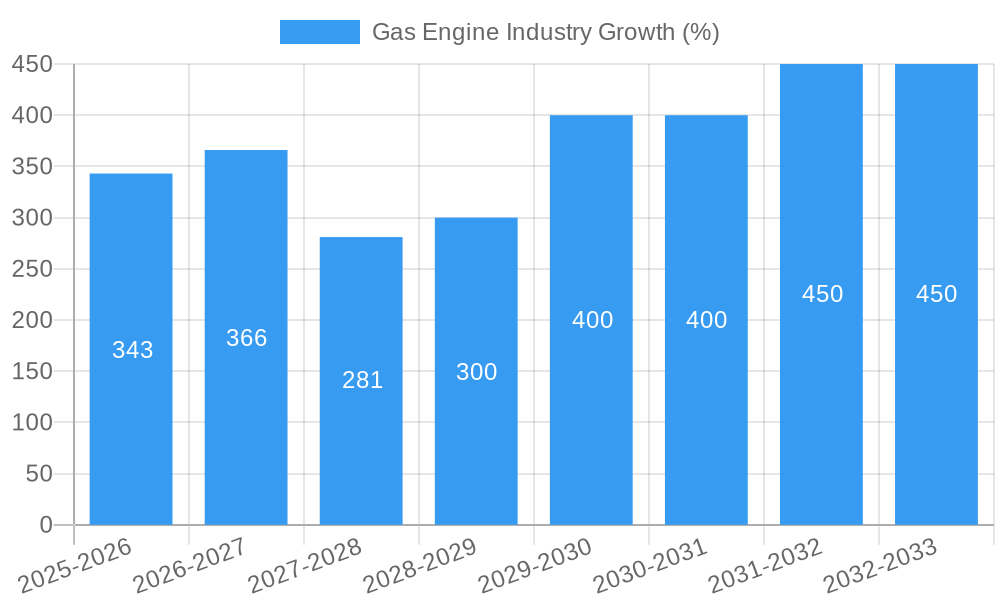
The global gas engine market, valued at $5.91 billion in 2025, is projected to experience robust growth, driven by increasing demand for reliable and efficient power generation solutions across various sectors. A Compound Annual Growth Rate (CAGR) of 5.74% from 2025 to 2033 indicates a significant expansion, fueled primarily by the power utilities sector's need for flexible and cost-effective power generation to meet fluctuating energy demands. The growing adoption of natural gas as a cleaner alternative to traditional fuels further boosts market growth. Industrial applications, encompassing manufacturing, oil & gas, and water treatment, contribute significantly, demanding robust and durable gas engines for continuous operation. The automotive sector, particularly in heavy-duty vehicles and marine applications, is witnessing a rise in gas engine adoption due to stringent emission regulations and the pursuit of fuel efficiency. Technological advancements focusing on higher efficiency, reduced emissions, and improved durability are key market drivers. While initial investment costs may act as a restraint, the long-term operational and environmental benefits are likely to outweigh this factor, contributing to continued market expansion.
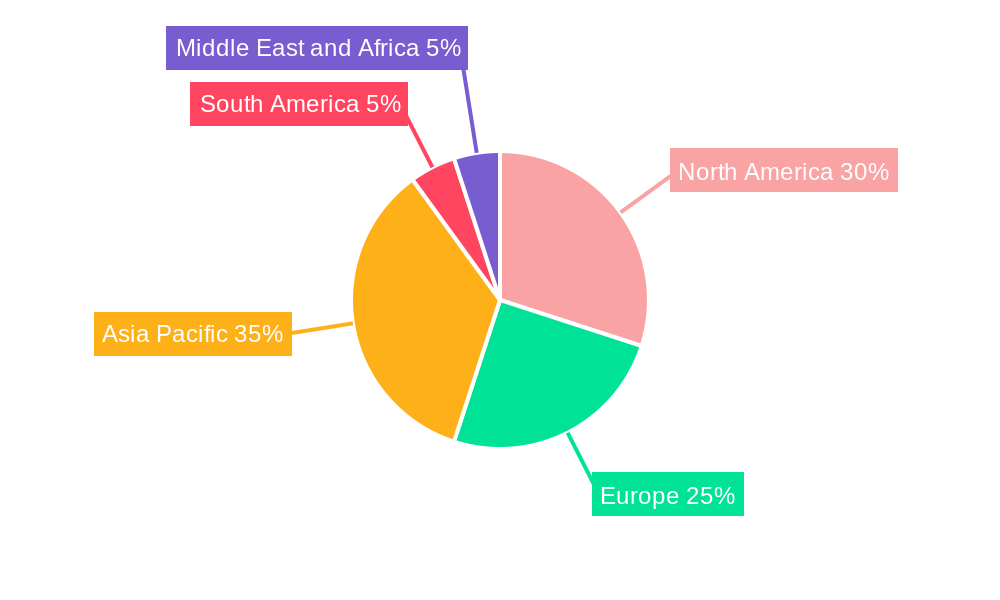
Regional variations in market growth are expected, with North America and Europe holding significant market shares due to established infrastructure and technological advancements. However, the Asia-Pacific region is anticipated to witness the most rapid growth, driven by increasing industrialization and urbanization, leading to a substantial demand for power generation and transportation solutions. Competitive dynamics are shaping the market, with major players like Rolls-Royce, Siemens, and Caterpillar investing in research and development to enhance their product offerings and expand their market presence. The emergence of innovative fuel types, such as hydrogen, is anticipated to further diversify the market and drive future growth. This continued expansion is strongly influenced by government policies promoting cleaner energy sources and sustainable practices, alongside rising awareness of environmental concerns, creating a favorable environment for the gas engine market's sustained growth.
Gas Engine Industry Market Report: 2019-2033 Forecast
Dive deep into the dynamic Gas Engine Industry with this comprehensive market report, projecting a robust future fueled by innovation and strategic growth. This in-depth analysis covers the period from 2019 to 2033, providing a detailed understanding of market dynamics, leading players, technological advancements, and emerging opportunities within the Gas Engine sector. The report forecasts a market valued at $XX Million by 2033, with a Compound Annual Growth Rate (CAGR) of XX% during the forecast period (2025-2033). This report is essential reading for industry stakeholders, investors, and anyone seeking actionable insights into this rapidly evolving market.
Gas Engine Industry Market Dynamics & Concentration
This section analyzes the competitive landscape, innovation drivers, regulatory changes, and market trends within the gas engine industry. The market is characterized by a moderately concentrated structure, with key players such as Rolls-Royce Holdings PLC, Siemens AG, Hyundai Heavy Industries Co Ltd, Caterpillar Inc, Wärtsilä Oyj Abp, and Cummins Inc. holding significant market share. However, the presence of several other significant players, including Liebherr Group, General Electric Company, Kawasaki Heavy Industries Ltd, JFE Engineering Corporation, MAN SE, and Mitsubishi Heavy Industries Ltd, indicates a competitive environment.
- Market Concentration: The Herfindahl-Hirschman Index (HHI) for the global gas engine market is estimated to be around xx, suggesting a moderately concentrated market.
- Innovation Drivers: Focus on higher efficiency, lower emissions (meeting stringent environmental regulations), and the development of engines compatible with alternative fuels such as hydrogen are key drivers.
- Regulatory Frameworks: Stringent emission standards globally are significantly impacting the gas engine market, pushing manufacturers towards cleaner and more efficient technologies.
- Product Substitutes: The primary substitutes for gas engines are electric motors and fuel cells, particularly in certain applications. The competitiveness of these alternatives varies across market segments.
- End-User Trends: Growth in the power generation sector (driven by rising electricity demand) and the marine industry (demand for efficient propulsion systems) are crucial to the overall market growth.
- M&A Activities: The number of M&A deals in the gas engine industry has averaged xx per year over the past five years, indicating ongoing consolidation within the sector.
Gas Engine Industry Industry Trends & Analysis
The global gas engine market is witnessing substantial growth, driven by increasing energy demands, industrialization, and the need for efficient and reliable power generation solutions. The market's growth is being propelled by several key factors, including:
- Technological Advancements: Continuous improvement in engine efficiency, emission control technologies, and the development of engines capable of utilizing alternative fuels like hydrogen are driving market expansion.
- Government Regulations: Stringent emission standards in many regions are pushing manufacturers towards cleaner engine technologies, stimulating innovation and growth in this sector.
- Rising Energy Demand: Global growth in electricity demand, especially in developing economies, is a key factor in the increasing adoption of gas engines for power generation.
- Consumer Preferences: A growing focus on environmental sustainability is shaping consumer preference toward cleaner and more efficient power generation systems, benefiting gas engine technology advancements.
- Competitive Dynamics: Intense competition among major players fuels innovation and drives down costs, benefiting consumers. This competitive landscape is also leading to strategic partnerships and collaborations to leverage technological advancements and expand market reach. The market is expected to exhibit a CAGR of xx% between 2025 and 2033. The market penetration of gas engines in the power generation sector is estimated to be around xx% in 2025 and is projected to reach xx% by 2033.
Leading Markets & Segments in Gas Engine Industry
The power utilities segment represents the largest share of the gas engine market, driven by increased electricity demand and the need for reliable power generation. Geographically, Asia-Pacific is expected to dominate the market due to rapid economic growth and industrialization in countries like China and India.
Key Drivers by Segment:
- Power Utilities: Growing electricity demand, investments in power infrastructure, and government policies supporting gas-based power generation.
- Automotive: Increasing adoption of natural gas vehicles and the development of high-efficiency gas engines for automobiles.
- Marine: Demand for cleaner and more efficient propulsion systems for ships and other marine vessels.
- Industrial: Use of gas engines in various industrial applications for power generation and other processes.
- Others: Applications in agriculture, construction, and other niche markets.
Fuel Type Dominance:
- Natural Gas: Currently dominates due to its widespread availability and relatively low cost.
- Hydrogen: Emergence as a promising alternative fuel, driven by environmental concerns and technological advancements.
- Other Fuel Types: Biogas and other renewable gas sources are gaining traction.
Regional Dominance: Asia Pacific holds a leading position due to rapid economic growth, industrialization, and rising energy demand.
Gas Engine Industry Product Developments
Recent years have witnessed significant advancements in gas engine technology, including improvements in thermal efficiency, emission reduction, and the development of engines compatible with alternative fuels like hydrogen. The incorporation of advanced control systems, improved combustion strategies, and the use of innovative materials are leading to more reliable, efficient, and environmentally friendly gas engines. These advancements are driving market penetration and expanding the range of applications for gas engine technology.
Key Drivers of Gas Engine Industry Growth
Several key factors contribute to the growth of the gas engine industry. These include:
- Technological advancements: Improvements in efficiency, emissions reduction, and alternative fuel compatibility.
- Economic growth: Rising global energy demand, especially in developing economies.
- Government policies: Regulations promoting cleaner energy sources and incentives for gas engine adoption. Examples include tax credits and subsidies for renewable natural gas applications.
Challenges in the Gas Engine Industry Market
The gas engine industry faces several challenges, including:
- Environmental regulations: Stringent emission standards create pressure on manufacturers to develop cleaner technologies. The cost of compliance represents a significant challenge.
- Supply chain disruptions: Fluctuations in raw material prices and supply chain bottlenecks can impact production costs and profitability.
- Competition from alternative technologies: The emergence of electric motors and fuel cells poses a competitive threat, particularly in specific applications. This competition is expected to intensify in the coming years. XX% market share could be lost by 2033 due to the competition with these technologies.
Emerging Opportunities in Gas Engine Industry
The gas engine industry presents several attractive opportunities:
- Hydrogen fuel technology: The development and deployment of hydrogen-fueled gas engines offer substantial growth potential.
- Strategic partnerships: Collaboration among manufacturers, technology providers, and end-users can unlock new opportunities and accelerate market expansion.
- Market expansion: Growth in developing economies and new application areas for gas engines offer significant market expansion opportunities.
Leading Players in the Gas Engine Industry Sector
- Rolls-Royce Holdings PLC
- Siemens AG
- Hyundai Heavy Industries Co Ltd
- Caterpillar Inc
- Wartsila Oyj Abp
- Liebherr Group
- Cummins Inc
- General Electric Company
- Kawasaki Heavy Industries Ltd
- JFE Engineering Corporation
- MAN SE
- Mitsubishi Heavy Industries Ltd
Key Milestones in Gas Engine Industry Industry
- November 2022: Weichai Group launched a commercial natural gas engine with 54.16% base engine thermal efficiency, utilizing high-pressure direct injection (HPDI) technology.
- March 2023: ITP Aero led a consortium to develop a hydrogen-fueled commercial aircraft engine, a USD 13 million project co-funded by the European Union.
Strategic Outlook for Gas Engine Industry Market
The gas engine industry is poised for continued growth, driven by technological innovation, rising energy demand, and supportive government policies. Strategic partnerships and investments in research and development will be crucial for companies to maintain a competitive edge and capitalize on emerging opportunities in alternative fuel technologies and expanding market segments. The focus on sustainable and efficient solutions will shape the future of the gas engine market, offering significant long-term growth potential.
Gas Engine Industry Segmentation
-
1. End-User
- 1.1. Power Utilities
- 1.2. Automotive
- 1.3. Marine
- 1.4. Industrial
- 1.5. Others
-
2. Fuel Type
- 2.1. Natural Gas
- 2.2. Hydrogen
- 2.3. Other Fuel Types
Gas Engine Industry Segmentation By Geography
-
1. North America
- 1.1. United States
- 1.2. Canada
- 1.3. Rest of North America
-
2. Europe
- 2.1. Germany
- 2.2. France
- 2.3. United Kingdom
- 2.4. Rest of Europe
-
3. Asia Pacific
- 3.1. China
- 3.2. India
- 3.3. Japan
- 3.4. South Korea
- 3.5. Rest of Asia Pacific
-
4. South America
- 4.1. Brazil
- 4.2. Argentina
- 4.3. Rest of South America
-
5. Middle East and Africa
- 5.1. Saudi Arabia
- 5.2. United Arab Emirates
- 5.3. South Africa
- 5.4. Rest of Middle East and Africa
Gas Engine Industry REPORT HIGHLIGHTS
| Aspects | Details |
|---|---|
| Study Period | 2019-2033 |
| Base Year | 2024 |
| Estimated Year | 2025 |
| Forecast Period | 2025-2033 |
| Historical Period | 2019-2024 |
| Growth Rate | CAGR of 5.74% from 2019-2033 |
| Segmentation |
|
Table of Contents
- 1. Introduction
- 1.1. Research Scope
- 1.2. Market Segmentation
- 1.3. Research Methodology
- 1.4. Definitions and Assumptions
- 2. Executive Summary
- 2.1. Introduction
- 3. Market Dynamics
- 3.1. Introduction
- 3.2. Market Drivers
- 3.2.1. 4.; Increasing Supply and Consumption of Gas-based Systems in Various End-user Industry4.; Implementation of stricter emission regulations worldwide
- 3.3. Market Restrains
- 3.3.1. 4.; Growing Inclination towards Renewable Sources
- 3.4. Market Trends
- 3.4.1. Power Utilities Expected to Witness Significant Growth
- 4. Market Factor Analysis
- 4.1. Porters Five Forces
- 4.2. Supply/Value Chain
- 4.3. PESTEL analysis
- 4.4. Market Entropy
- 4.5. Patent/Trademark Analysis
- 5. Global Gas Engine Industry Analysis, Insights and Forecast, 2019-2031
- 5.1. Market Analysis, Insights and Forecast - by End-User
- 5.1.1. Power Utilities
- 5.1.2. Automotive
- 5.1.3. Marine
- 5.1.4. Industrial
- 5.1.5. Others
- 5.2. Market Analysis, Insights and Forecast - by Fuel Type
- 5.2.1. Natural Gas
- 5.2.2. Hydrogen
- 5.2.3. Other Fuel Types
- 5.3. Market Analysis, Insights and Forecast - by Region
- 5.3.1. North America
- 5.3.2. Europe
- 5.3.3. Asia Pacific
- 5.3.4. South America
- 5.3.5. Middle East and Africa
- 5.1. Market Analysis, Insights and Forecast - by End-User
- 6. North America Gas Engine Industry Analysis, Insights and Forecast, 2019-2031
- 6.1. Market Analysis, Insights and Forecast - by End-User
- 6.1.1. Power Utilities
- 6.1.2. Automotive
- 6.1.3. Marine
- 6.1.4. Industrial
- 6.1.5. Others
- 6.2. Market Analysis, Insights and Forecast - by Fuel Type
- 6.2.1. Natural Gas
- 6.2.2. Hydrogen
- 6.2.3. Other Fuel Types
- 6.1. Market Analysis, Insights and Forecast - by End-User
- 7. Europe Gas Engine Industry Analysis, Insights and Forecast, 2019-2031
- 7.1. Market Analysis, Insights and Forecast - by End-User
- 7.1.1. Power Utilities
- 7.1.2. Automotive
- 7.1.3. Marine
- 7.1.4. Industrial
- 7.1.5. Others
- 7.2. Market Analysis, Insights and Forecast - by Fuel Type
- 7.2.1. Natural Gas
- 7.2.2. Hydrogen
- 7.2.3. Other Fuel Types
- 7.1. Market Analysis, Insights and Forecast - by End-User
- 8. Asia Pacific Gas Engine Industry Analysis, Insights and Forecast, 2019-2031
- 8.1. Market Analysis, Insights and Forecast - by End-User
- 8.1.1. Power Utilities
- 8.1.2. Automotive
- 8.1.3. Marine
- 8.1.4. Industrial
- 8.1.5. Others
- 8.2. Market Analysis, Insights and Forecast - by Fuel Type
- 8.2.1. Natural Gas
- 8.2.2. Hydrogen
- 8.2.3. Other Fuel Types
- 8.1. Market Analysis, Insights and Forecast - by End-User
- 9. South America Gas Engine Industry Analysis, Insights and Forecast, 2019-2031
- 9.1. Market Analysis, Insights and Forecast - by End-User
- 9.1.1. Power Utilities
- 9.1.2. Automotive
- 9.1.3. Marine
- 9.1.4. Industrial
- 9.1.5. Others
- 9.2. Market Analysis, Insights and Forecast - by Fuel Type
- 9.2.1. Natural Gas
- 9.2.2. Hydrogen
- 9.2.3. Other Fuel Types
- 9.1. Market Analysis, Insights and Forecast - by End-User
- 10. Middle East and Africa Gas Engine Industry Analysis, Insights and Forecast, 2019-2031
- 10.1. Market Analysis, Insights and Forecast - by End-User
- 10.1.1. Power Utilities
- 10.1.2. Automotive
- 10.1.3. Marine
- 10.1.4. Industrial
- 10.1.5. Others
- 10.2. Market Analysis, Insights and Forecast - by Fuel Type
- 10.2.1. Natural Gas
- 10.2.2. Hydrogen
- 10.2.3. Other Fuel Types
- 10.1. Market Analysis, Insights and Forecast - by End-User
- 11. North America Gas Engine Industry Analysis, Insights and Forecast, 2019-2031
- 11.1. Market Analysis, Insights and Forecast - By Country/Sub-region
- 11.1.1 United States
- 11.1.2 Canada
- 11.1.3 Rest of North America
- 12. Europe Gas Engine Industry Analysis, Insights and Forecast, 2019-2031
- 12.1. Market Analysis, Insights and Forecast - By Country/Sub-region
- 12.1.1 Germany
- 12.1.2 France
- 12.1.3 United Kingdom
- 12.1.4 Rest of Europe
- 13. Asia Pacific Gas Engine Industry Analysis, Insights and Forecast, 2019-2031
- 13.1. Market Analysis, Insights and Forecast - By Country/Sub-region
- 13.1.1 China
- 13.1.2 India
- 13.1.3 Japan
- 13.1.4 South Korea
- 13.1.5 Rest of Asia Pacific
- 14. South America Gas Engine Industry Analysis, Insights and Forecast, 2019-2031
- 14.1. Market Analysis, Insights and Forecast - By Country/Sub-region
- 14.1.1 Brazil
- 14.1.2 Argentina
- 14.1.3 Rest of South America
- 15. Middle East and Africa Gas Engine Industry Analysis, Insights and Forecast, 2019-2031
- 15.1. Market Analysis, Insights and Forecast - By Country/Sub-region
- 15.1.1 Saudi Arabia
- 15.1.2 United Arab Emirates
- 15.1.3 South Africa
- 15.1.4 Rest of Middle East and Africa
- 16. Competitive Analysis
- 16.1. Global Market Share Analysis 2024
- 16.2. Company Profiles
- 16.2.1 Rolls-Royce Holdings PLC
- 16.2.1.1. Overview
- 16.2.1.2. Products
- 16.2.1.3. SWOT Analysis
- 16.2.1.4. Recent Developments
- 16.2.1.5. Financials (Based on Availability)
- 16.2.2 Siemens AG
- 16.2.2.1. Overview
- 16.2.2.2. Products
- 16.2.2.3. SWOT Analysis
- 16.2.2.4. Recent Developments
- 16.2.2.5. Financials (Based on Availability)
- 16.2.3 Hyundai Heavy Industries Co Ltd
- 16.2.3.1. Overview
- 16.2.3.2. Products
- 16.2.3.3. SWOT Analysis
- 16.2.3.4. Recent Developments
- 16.2.3.5. Financials (Based on Availability)
- 16.2.4 Caterpillar Inc
- 16.2.4.1. Overview
- 16.2.4.2. Products
- 16.2.4.3. SWOT Analysis
- 16.2.4.4. Recent Developments
- 16.2.4.5. Financials (Based on Availability)
- 16.2.5 Wartsila Oyj Abp
- 16.2.5.1. Overview
- 16.2.5.2. Products
- 16.2.5.3. SWOT Analysis
- 16.2.5.4. Recent Developments
- 16.2.5.5. Financials (Based on Availability)
- 16.2.6 Liebherr Group*List Not Exhaustive
- 16.2.6.1. Overview
- 16.2.6.2. Products
- 16.2.6.3. SWOT Analysis
- 16.2.6.4. Recent Developments
- 16.2.6.5. Financials (Based on Availability)
- 16.2.7 Cummins Inc
- 16.2.7.1. Overview
- 16.2.7.2. Products
- 16.2.7.3. SWOT Analysis
- 16.2.7.4. Recent Developments
- 16.2.7.5. Financials (Based on Availability)
- 16.2.8 General Electric Company
- 16.2.8.1. Overview
- 16.2.8.2. Products
- 16.2.8.3. SWOT Analysis
- 16.2.8.4. Recent Developments
- 16.2.8.5. Financials (Based on Availability)
- 16.2.9 Kawasaki Heavy Industries Ltd
- 16.2.9.1. Overview
- 16.2.9.2. Products
- 16.2.9.3. SWOT Analysis
- 16.2.9.4. Recent Developments
- 16.2.9.5. Financials (Based on Availability)
- 16.2.10 JFE Engineering Corporation
- 16.2.10.1. Overview
- 16.2.10.2. Products
- 16.2.10.3. SWOT Analysis
- 16.2.10.4. Recent Developments
- 16.2.10.5. Financials (Based on Availability)
- 16.2.11 Man SE
- 16.2.11.1. Overview
- 16.2.11.2. Products
- 16.2.11.3. SWOT Analysis
- 16.2.11.4. Recent Developments
- 16.2.11.5. Financials (Based on Availability)
- 16.2.12 Mitsubishi Heavy Industries Ltd
- 16.2.12.1. Overview
- 16.2.12.2. Products
- 16.2.12.3. SWOT Analysis
- 16.2.12.4. Recent Developments
- 16.2.12.5. Financials (Based on Availability)
- 16.2.1 Rolls-Royce Holdings PLC
List of Figures
- Figure 1: Global Gas Engine Industry Revenue Breakdown (Million, %) by Region 2024 & 2032
- Figure 2: Global Gas Engine Industry Volume Breakdown (K Unit, %) by Region 2024 & 2032
- Figure 3: North America Gas Engine Industry Revenue (Million), by Country 2024 & 2032
- Figure 4: North America Gas Engine Industry Volume (K Unit), by Country 2024 & 2032
- Figure 5: North America Gas Engine Industry Revenue Share (%), by Country 2024 & 2032
- Figure 6: North America Gas Engine Industry Volume Share (%), by Country 2024 & 2032
- Figure 7: Europe Gas Engine Industry Revenue (Million), by Country 2024 & 2032
- Figure 8: Europe Gas Engine Industry Volume (K Unit), by Country 2024 & 2032
- Figure 9: Europe Gas Engine Industry Revenue Share (%), by Country 2024 & 2032
- Figure 10: Europe Gas Engine Industry Volume Share (%), by Country 2024 & 2032
- Figure 11: Asia Pacific Gas Engine Industry Revenue (Million), by Country 2024 & 2032
- Figure 12: Asia Pacific Gas Engine Industry Volume (K Unit), by Country 2024 & 2032
- Figure 13: Asia Pacific Gas Engine Industry Revenue Share (%), by Country 2024 & 2032
- Figure 14: Asia Pacific Gas Engine Industry Volume Share (%), by Country 2024 & 2032
- Figure 15: South America Gas Engine Industry Revenue (Million), by Country 2024 & 2032
- Figure 16: South America Gas Engine Industry Volume (K Unit), by Country 2024 & 2032
- Figure 17: South America Gas Engine Industry Revenue Share (%), by Country 2024 & 2032
- Figure 18: South America Gas Engine Industry Volume Share (%), by Country 2024 & 2032
- Figure 19: Middle East and Africa Gas Engine Industry Revenue (Million), by Country 2024 & 2032
- Figure 20: Middle East and Africa Gas Engine Industry Volume (K Unit), by Country 2024 & 2032
- Figure 21: Middle East and Africa Gas Engine Industry Revenue Share (%), by Country 2024 & 2032
- Figure 22: Middle East and Africa Gas Engine Industry Volume Share (%), by Country 2024 & 2032
- Figure 23: North America Gas Engine Industry Revenue (Million), by End-User 2024 & 2032
- Figure 24: North America Gas Engine Industry Volume (K Unit), by End-User 2024 & 2032
- Figure 25: North America Gas Engine Industry Revenue Share (%), by End-User 2024 & 2032
- Figure 26: North America Gas Engine Industry Volume Share (%), by End-User 2024 & 2032
- Figure 27: North America Gas Engine Industry Revenue (Million), by Fuel Type 2024 & 2032
- Figure 28: North America Gas Engine Industry Volume (K Unit), by Fuel Type 2024 & 2032
- Figure 29: North America Gas Engine Industry Revenue Share (%), by Fuel Type 2024 & 2032
- Figure 30: North America Gas Engine Industry Volume Share (%), by Fuel Type 2024 & 2032
- Figure 31: North America Gas Engine Industry Revenue (Million), by Country 2024 & 2032
- Figure 32: North America Gas Engine Industry Volume (K Unit), by Country 2024 & 2032
- Figure 33: North America Gas Engine Industry Revenue Share (%), by Country 2024 & 2032
- Figure 34: North America Gas Engine Industry Volume Share (%), by Country 2024 & 2032
- Figure 35: Europe Gas Engine Industry Revenue (Million), by End-User 2024 & 2032
- Figure 36: Europe Gas Engine Industry Volume (K Unit), by End-User 2024 & 2032
- Figure 37: Europe Gas Engine Industry Revenue Share (%), by End-User 2024 & 2032
- Figure 38: Europe Gas Engine Industry Volume Share (%), by End-User 2024 & 2032
- Figure 39: Europe Gas Engine Industry Revenue (Million), by Fuel Type 2024 & 2032
- Figure 40: Europe Gas Engine Industry Volume (K Unit), by Fuel Type 2024 & 2032
- Figure 41: Europe Gas Engine Industry Revenue Share (%), by Fuel Type 2024 & 2032
- Figure 42: Europe Gas Engine Industry Volume Share (%), by Fuel Type 2024 & 2032
- Figure 43: Europe Gas Engine Industry Revenue (Million), by Country 2024 & 2032
- Figure 44: Europe Gas Engine Industry Volume (K Unit), by Country 2024 & 2032
- Figure 45: Europe Gas Engine Industry Revenue Share (%), by Country 2024 & 2032
- Figure 46: Europe Gas Engine Industry Volume Share (%), by Country 2024 & 2032
- Figure 47: Asia Pacific Gas Engine Industry Revenue (Million), by End-User 2024 & 2032
- Figure 48: Asia Pacific Gas Engine Industry Volume (K Unit), by End-User 2024 & 2032
- Figure 49: Asia Pacific Gas Engine Industry Revenue Share (%), by End-User 2024 & 2032
- Figure 50: Asia Pacific Gas Engine Industry Volume Share (%), by End-User 2024 & 2032
- Figure 51: Asia Pacific Gas Engine Industry Revenue (Million), by Fuel Type 2024 & 2032
- Figure 52: Asia Pacific Gas Engine Industry Volume (K Unit), by Fuel Type 2024 & 2032
- Figure 53: Asia Pacific Gas Engine Industry Revenue Share (%), by Fuel Type 2024 & 2032
- Figure 54: Asia Pacific Gas Engine Industry Volume Share (%), by Fuel Type 2024 & 2032
- Figure 55: Asia Pacific Gas Engine Industry Revenue (Million), by Country 2024 & 2032
- Figure 56: Asia Pacific Gas Engine Industry Volume (K Unit), by Country 2024 & 2032
- Figure 57: Asia Pacific Gas Engine Industry Revenue Share (%), by Country 2024 & 2032
- Figure 58: Asia Pacific Gas Engine Industry Volume Share (%), by Country 2024 & 2032
- Figure 59: South America Gas Engine Industry Revenue (Million), by End-User 2024 & 2032
- Figure 60: South America Gas Engine Industry Volume (K Unit), by End-User 2024 & 2032
- Figure 61: South America Gas Engine Industry Revenue Share (%), by End-User 2024 & 2032
- Figure 62: South America Gas Engine Industry Volume Share (%), by End-User 2024 & 2032
- Figure 63: South America Gas Engine Industry Revenue (Million), by Fuel Type 2024 & 2032
- Figure 64: South America Gas Engine Industry Volume (K Unit), by Fuel Type 2024 & 2032
- Figure 65: South America Gas Engine Industry Revenue Share (%), by Fuel Type 2024 & 2032
- Figure 66: South America Gas Engine Industry Volume Share (%), by Fuel Type 2024 & 2032
- Figure 67: South America Gas Engine Industry Revenue (Million), by Country 2024 & 2032
- Figure 68: South America Gas Engine Industry Volume (K Unit), by Country 2024 & 2032
- Figure 69: South America Gas Engine Industry Revenue Share (%), by Country 2024 & 2032
- Figure 70: South America Gas Engine Industry Volume Share (%), by Country 2024 & 2032
- Figure 71: Middle East and Africa Gas Engine Industry Revenue (Million), by End-User 2024 & 2032
- Figure 72: Middle East and Africa Gas Engine Industry Volume (K Unit), by End-User 2024 & 2032
- Figure 73: Middle East and Africa Gas Engine Industry Revenue Share (%), by End-User 2024 & 2032
- Figure 74: Middle East and Africa Gas Engine Industry Volume Share (%), by End-User 2024 & 2032
- Figure 75: Middle East and Africa Gas Engine Industry Revenue (Million), by Fuel Type 2024 & 2032
- Figure 76: Middle East and Africa Gas Engine Industry Volume (K Unit), by Fuel Type 2024 & 2032
- Figure 77: Middle East and Africa Gas Engine Industry Revenue Share (%), by Fuel Type 2024 & 2032
- Figure 78: Middle East and Africa Gas Engine Industry Volume Share (%), by Fuel Type 2024 & 2032
- Figure 79: Middle East and Africa Gas Engine Industry Revenue (Million), by Country 2024 & 2032
- Figure 80: Middle East and Africa Gas Engine Industry Volume (K Unit), by Country 2024 & 2032
- Figure 81: Middle East and Africa Gas Engine Industry Revenue Share (%), by Country 2024 & 2032
- Figure 82: Middle East and Africa Gas Engine Industry Volume Share (%), by Country 2024 & 2032
List of Tables
- Table 1: Global Gas Engine Industry Revenue Million Forecast, by Region 2019 & 2032
- Table 2: Global Gas Engine Industry Volume K Unit Forecast, by Region 2019 & 2032
- Table 3: Global Gas Engine Industry Revenue Million Forecast, by End-User 2019 & 2032
- Table 4: Global Gas Engine Industry Volume K Unit Forecast, by End-User 2019 & 2032
- Table 5: Global Gas Engine Industry Revenue Million Forecast, by Fuel Type 2019 & 2032
- Table 6: Global Gas Engine Industry Volume K Unit Forecast, by Fuel Type 2019 & 2032
- Table 7: Global Gas Engine Industry Revenue Million Forecast, by Region 2019 & 2032
- Table 8: Global Gas Engine Industry Volume K Unit Forecast, by Region 2019 & 2032
- Table 9: Global Gas Engine Industry Revenue Million Forecast, by Country 2019 & 2032
- Table 10: Global Gas Engine Industry Volume K Unit Forecast, by Country 2019 & 2032
- Table 11: United States Gas Engine Industry Revenue (Million) Forecast, by Application 2019 & 2032
- Table 12: United States Gas Engine Industry Volume (K Unit) Forecast, by Application 2019 & 2032
- Table 13: Canada Gas Engine Industry Revenue (Million) Forecast, by Application 2019 & 2032
- Table 14: Canada Gas Engine Industry Volume (K Unit) Forecast, by Application 2019 & 2032
- Table 15: Rest of North America Gas Engine Industry Revenue (Million) Forecast, by Application 2019 & 2032
- Table 16: Rest of North America Gas Engine Industry Volume (K Unit) Forecast, by Application 2019 & 2032
- Table 17: Global Gas Engine Industry Revenue Million Forecast, by Country 2019 & 2032
- Table 18: Global Gas Engine Industry Volume K Unit Forecast, by Country 2019 & 2032
- Table 19: Germany Gas Engine Industry Revenue (Million) Forecast, by Application 2019 & 2032
- Table 20: Germany Gas Engine Industry Volume (K Unit) Forecast, by Application 2019 & 2032
- Table 21: France Gas Engine Industry Revenue (Million) Forecast, by Application 2019 & 2032
- Table 22: France Gas Engine Industry Volume (K Unit) Forecast, by Application 2019 & 2032
- Table 23: United Kingdom Gas Engine Industry Revenue (Million) Forecast, by Application 2019 & 2032
- Table 24: United Kingdom Gas Engine Industry Volume (K Unit) Forecast, by Application 2019 & 2032
- Table 25: Rest of Europe Gas Engine Industry Revenue (Million) Forecast, by Application 2019 & 2032
- Table 26: Rest of Europe Gas Engine Industry Volume (K Unit) Forecast, by Application 2019 & 2032
- Table 27: Global Gas Engine Industry Revenue Million Forecast, by Country 2019 & 2032
- Table 28: Global Gas Engine Industry Volume K Unit Forecast, by Country 2019 & 2032
- Table 29: China Gas Engine Industry Revenue (Million) Forecast, by Application 2019 & 2032
- Table 30: China Gas Engine Industry Volume (K Unit) Forecast, by Application 2019 & 2032
- Table 31: India Gas Engine Industry Revenue (Million) Forecast, by Application 2019 & 2032
- Table 32: India Gas Engine Industry Volume (K Unit) Forecast, by Application 2019 & 2032
- Table 33: Japan Gas Engine Industry Revenue (Million) Forecast, by Application 2019 & 2032
- Table 34: Japan Gas Engine Industry Volume (K Unit) Forecast, by Application 2019 & 2032
- Table 35: South Korea Gas Engine Industry Revenue (Million) Forecast, by Application 2019 & 2032
- Table 36: South Korea Gas Engine Industry Volume (K Unit) Forecast, by Application 2019 & 2032
- Table 37: Rest of Asia Pacific Gas Engine Industry Revenue (Million) Forecast, by Application 2019 & 2032
- Table 38: Rest of Asia Pacific Gas Engine Industry Volume (K Unit) Forecast, by Application 2019 & 2032
- Table 39: Global Gas Engine Industry Revenue Million Forecast, by Country 2019 & 2032
- Table 40: Global Gas Engine Industry Volume K Unit Forecast, by Country 2019 & 2032
- Table 41: Brazil Gas Engine Industry Revenue (Million) Forecast, by Application 2019 & 2032
- Table 42: Brazil Gas Engine Industry Volume (K Unit) Forecast, by Application 2019 & 2032
- Table 43: Argentina Gas Engine Industry Revenue (Million) Forecast, by Application 2019 & 2032
- Table 44: Argentina Gas Engine Industry Volume (K Unit) Forecast, by Application 2019 & 2032
- Table 45: Rest of South America Gas Engine Industry Revenue (Million) Forecast, by Application 2019 & 2032
- Table 46: Rest of South America Gas Engine Industry Volume (K Unit) Forecast, by Application 2019 & 2032
- Table 47: Global Gas Engine Industry Revenue Million Forecast, by Country 2019 & 2032
- Table 48: Global Gas Engine Industry Volume K Unit Forecast, by Country 2019 & 2032
- Table 49: Saudi Arabia Gas Engine Industry Revenue (Million) Forecast, by Application 2019 & 2032
- Table 50: Saudi Arabia Gas Engine Industry Volume (K Unit) Forecast, by Application 2019 & 2032
- Table 51: United Arab Emirates Gas Engine Industry Revenue (Million) Forecast, by Application 2019 & 2032
- Table 52: United Arab Emirates Gas Engine Industry Volume (K Unit) Forecast, by Application 2019 & 2032
- Table 53: South Africa Gas Engine Industry Revenue (Million) Forecast, by Application 2019 & 2032
- Table 54: South Africa Gas Engine Industry Volume (K Unit) Forecast, by Application 2019 & 2032
- Table 55: Rest of Middle East and Africa Gas Engine Industry Revenue (Million) Forecast, by Application 2019 & 2032
- Table 56: Rest of Middle East and Africa Gas Engine Industry Volume (K Unit) Forecast, by Application 2019 & 2032
- Table 57: Global Gas Engine Industry Revenue Million Forecast, by End-User 2019 & 2032
- Table 58: Global Gas Engine Industry Volume K Unit Forecast, by End-User 2019 & 2032
- Table 59: Global Gas Engine Industry Revenue Million Forecast, by Fuel Type 2019 & 2032
- Table 60: Global Gas Engine Industry Volume K Unit Forecast, by Fuel Type 2019 & 2032
- Table 61: Global Gas Engine Industry Revenue Million Forecast, by Country 2019 & 2032
- Table 62: Global Gas Engine Industry Volume K Unit Forecast, by Country 2019 & 2032
- Table 63: United States Gas Engine Industry Revenue (Million) Forecast, by Application 2019 & 2032
- Table 64: United States Gas Engine Industry Volume (K Unit) Forecast, by Application 2019 & 2032
- Table 65: Canada Gas Engine Industry Revenue (Million) Forecast, by Application 2019 & 2032
- Table 66: Canada Gas Engine Industry Volume (K Unit) Forecast, by Application 2019 & 2032
- Table 67: Rest of North America Gas Engine Industry Revenue (Million) Forecast, by Application 2019 & 2032
- Table 68: Rest of North America Gas Engine Industry Volume (K Unit) Forecast, by Application 2019 & 2032
- Table 69: Global Gas Engine Industry Revenue Million Forecast, by End-User 2019 & 2032
- Table 70: Global Gas Engine Industry Volume K Unit Forecast, by End-User 2019 & 2032
- Table 71: Global Gas Engine Industry Revenue Million Forecast, by Fuel Type 2019 & 2032
- Table 72: Global Gas Engine Industry Volume K Unit Forecast, by Fuel Type 2019 & 2032
- Table 73: Global Gas Engine Industry Revenue Million Forecast, by Country 2019 & 2032
- Table 74: Global Gas Engine Industry Volume K Unit Forecast, by Country 2019 & 2032
- Table 75: Germany Gas Engine Industry Revenue (Million) Forecast, by Application 2019 & 2032
- Table 76: Germany Gas Engine Industry Volume (K Unit) Forecast, by Application 2019 & 2032
- Table 77: France Gas Engine Industry Revenue (Million) Forecast, by Application 2019 & 2032
- Table 78: France Gas Engine Industry Volume (K Unit) Forecast, by Application 2019 & 2032
- Table 79: United Kingdom Gas Engine Industry Revenue (Million) Forecast, by Application 2019 & 2032
- Table 80: United Kingdom Gas Engine Industry Volume (K Unit) Forecast, by Application 2019 & 2032
- Table 81: Rest of Europe Gas Engine Industry Revenue (Million) Forecast, by Application 2019 & 2032
- Table 82: Rest of Europe Gas Engine Industry Volume (K Unit) Forecast, by Application 2019 & 2032
- Table 83: Global Gas Engine Industry Revenue Million Forecast, by End-User 2019 & 2032
- Table 84: Global Gas Engine Industry Volume K Unit Forecast, by End-User 2019 & 2032
- Table 85: Global Gas Engine Industry Revenue Million Forecast, by Fuel Type 2019 & 2032
- Table 86: Global Gas Engine Industry Volume K Unit Forecast, by Fuel Type 2019 & 2032
- Table 87: Global Gas Engine Industry Revenue Million Forecast, by Country 2019 & 2032
- Table 88: Global Gas Engine Industry Volume K Unit Forecast, by Country 2019 & 2032
- Table 89: China Gas Engine Industry Revenue (Million) Forecast, by Application 2019 & 2032
- Table 90: China Gas Engine Industry Volume (K Unit) Forecast, by Application 2019 & 2032
- Table 91: India Gas Engine Industry Revenue (Million) Forecast, by Application 2019 & 2032
- Table 92: India Gas Engine Industry Volume (K Unit) Forecast, by Application 2019 & 2032
- Table 93: Japan Gas Engine Industry Revenue (Million) Forecast, by Application 2019 & 2032
- Table 94: Japan Gas Engine Industry Volume (K Unit) Forecast, by Application 2019 & 2032
- Table 95: South Korea Gas Engine Industry Revenue (Million) Forecast, by Application 2019 & 2032
- Table 96: South Korea Gas Engine Industry Volume (K Unit) Forecast, by Application 2019 & 2032
- Table 97: Rest of Asia Pacific Gas Engine Industry Revenue (Million) Forecast, by Application 2019 & 2032
- Table 98: Rest of Asia Pacific Gas Engine Industry Volume (K Unit) Forecast, by Application 2019 & 2032
- Table 99: Global Gas Engine Industry Revenue Million Forecast, by End-User 2019 & 2032
- Table 100: Global Gas Engine Industry Volume K Unit Forecast, by End-User 2019 & 2032
- Table 101: Global Gas Engine Industry Revenue Million Forecast, by Fuel Type 2019 & 2032
- Table 102: Global Gas Engine Industry Volume K Unit Forecast, by Fuel Type 2019 & 2032
- Table 103: Global Gas Engine Industry Revenue Million Forecast, by Country 2019 & 2032
- Table 104: Global Gas Engine Industry Volume K Unit Forecast, by Country 2019 & 2032
- Table 105: Brazil Gas Engine Industry Revenue (Million) Forecast, by Application 2019 & 2032
- Table 106: Brazil Gas Engine Industry Volume (K Unit) Forecast, by Application 2019 & 2032
- Table 107: Argentina Gas Engine Industry Revenue (Million) Forecast, by Application 2019 & 2032
- Table 108: Argentina Gas Engine Industry Volume (K Unit) Forecast, by Application 2019 & 2032
- Table 109: Rest of South America Gas Engine Industry Revenue (Million) Forecast, by Application 2019 & 2032
- Table 110: Rest of South America Gas Engine Industry Volume (K Unit) Forecast, by Application 2019 & 2032
- Table 111: Global Gas Engine Industry Revenue Million Forecast, by End-User 2019 & 2032
- Table 112: Global Gas Engine Industry Volume K Unit Forecast, by End-User 2019 & 2032
- Table 113: Global Gas Engine Industry Revenue Million Forecast, by Fuel Type 2019 & 2032
- Table 114: Global Gas Engine Industry Volume K Unit Forecast, by Fuel Type 2019 & 2032
- Table 115: Global Gas Engine Industry Revenue Million Forecast, by Country 2019 & 2032
- Table 116: Global Gas Engine Industry Volume K Unit Forecast, by Country 2019 & 2032
- Table 117: Saudi Arabia Gas Engine Industry Revenue (Million) Forecast, by Application 2019 & 2032
- Table 118: Saudi Arabia Gas Engine Industry Volume (K Unit) Forecast, by Application 2019 & 2032
- Table 119: United Arab Emirates Gas Engine Industry Revenue (Million) Forecast, by Application 2019 & 2032
- Table 120: United Arab Emirates Gas Engine Industry Volume (K Unit) Forecast, by Application 2019 & 2032
- Table 121: South Africa Gas Engine Industry Revenue (Million) Forecast, by Application 2019 & 2032
- Table 122: South Africa Gas Engine Industry Volume (K Unit) Forecast, by Application 2019 & 2032
- Table 123: Rest of Middle East and Africa Gas Engine Industry Revenue (Million) Forecast, by Application 2019 & 2032
- Table 124: Rest of Middle East and Africa Gas Engine Industry Volume (K Unit) Forecast, by Application 2019 & 2032
Frequently Asked Questions
1. What is the projected Compound Annual Growth Rate (CAGR) of the Gas Engine Industry?
The projected CAGR is approximately 5.74%.
2. Which companies are prominent players in the Gas Engine Industry?
Key companies in the market include Rolls-Royce Holdings PLC, Siemens AG, Hyundai Heavy Industries Co Ltd, Caterpillar Inc, Wartsila Oyj Abp, Liebherr Group*List Not Exhaustive, Cummins Inc, General Electric Company, Kawasaki Heavy Industries Ltd, JFE Engineering Corporation, Man SE, Mitsubishi Heavy Industries Ltd.
3. What are the main segments of the Gas Engine Industry?
The market segments include End-User, Fuel Type.
4. Can you provide details about the market size?
The market size is estimated to be USD 5.91 Million as of 2022.
5. What are some drivers contributing to market growth?
4.; Increasing Supply and Consumption of Gas-based Systems in Various End-user Industry4.; Implementation of stricter emission regulations worldwide.
6. What are the notable trends driving market growth?
Power Utilities Expected to Witness Significant Growth.
7. Are there any restraints impacting market growth?
4.; Growing Inclination towards Renewable Sources.
8. Can you provide examples of recent developments in the market?
In March 2023, ITP Aero, a Spanish aircraft engine company, has announced that it is leading a national consortium to test and develop the first hydrogen-fueled commercial aircraft engine developed locally. As part of the Spanish Ministry of Science agency's Aeronautical Technology Plan, managed by CDTI, the Spanish Center for Technological Development and Innovation, the USD 13 million Cryogenics, Fuel Cells and Hydrogen Combustion in Air Transport project is co-funded by European Union Next Gen strategic investment funding.
9. What pricing options are available for accessing the report?
Pricing options include single-user, multi-user, and enterprise licenses priced at USD 4750, USD 5250, and USD 8750 respectively.
10. Is the market size provided in terms of value or volume?
The market size is provided in terms of value, measured in Million and volume, measured in K Unit.
11. Are there any specific market keywords associated with the report?
Yes, the market keyword associated with the report is "Gas Engine Industry," which aids in identifying and referencing the specific market segment covered.
12. How do I determine which pricing option suits my needs best?
The pricing options vary based on user requirements and access needs. Individual users may opt for single-user licenses, while businesses requiring broader access may choose multi-user or enterprise licenses for cost-effective access to the report.
13. Are there any additional resources or data provided in the Gas Engine Industry report?
While the report offers comprehensive insights, it's advisable to review the specific contents or supplementary materials provided to ascertain if additional resources or data are available.
14. How can I stay updated on further developments or reports in the Gas Engine Industry?
To stay informed about further developments, trends, and reports in the Gas Engine Industry, consider subscribing to industry newsletters, following relevant companies and organizations, or regularly checking reputable industry news sources and publications.
Methodology
Step 1 - Identification of Relevant Samples Size from Population Database


Step 2 - Approaches for Defining Global Market Size (Value, Volume* & Price*)

Note*: In applicable scenarios
Step 3 - Data Sources
Primary Research
- Web Analytics
- Survey Reports
- Research Institute
- Latest Research Reports
- Opinion Leaders
Secondary Research
- Annual Reports
- White Paper
- Latest Press Release
- Industry Association
- Paid Database
- Investor Presentations

Step 4 - Data Triangulation
Involves using different sources of information in order to increase the validity of a study
These sources are likely to be stakeholders in a program - participants, other researchers, program staff, other community members, and so on.
Then we put all data in single framework & apply various statistical tools to find out the dynamic on the market.
During the analysis stage, feedback from the stakeholder groups would be compared to determine areas of agreement as well as areas of divergence
