

Key Insights
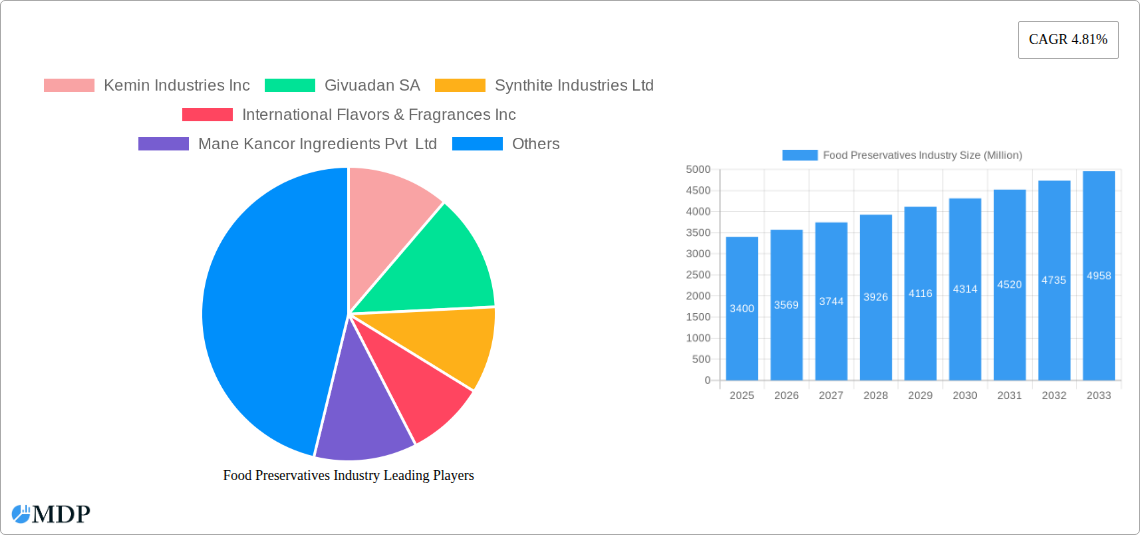
The global food preservatives market, valued at $3.40 billion in 2025, is projected to experience robust growth, driven by several key factors. The increasing demand for processed and convenience foods, coupled with a growing awareness of food safety and extended shelf life, fuels market expansion. Consumers are increasingly seeking longer-lasting products, leading to higher adoption of preservatives across various food categories, including baked goods, dairy products, and meat. Technological advancements in preservative formulation, including the development of natural and clean-label alternatives, are also significant drivers. This trend responds to consumer preferences for healthier and more naturally-preserved food options, which is impacting the market share of traditional chemical preservatives. However, stringent regulatory frameworks and evolving consumer perceptions regarding the health impacts of certain preservatives pose challenges to market growth. This necessitates manufacturers to innovate and adapt to shifting consumer demand, leading to a dynamic market landscape characterized by ongoing innovation in both chemical and natural preservation methods. The competitive landscape is shaped by both established multinational players like Kemin Industries Inc., Givaudan SA, and International Flavors & Fragrances Inc., as well as regional players catering to localized preferences. The market is segmented by type (natural and synthetic), application (bakery, meat, dairy, beverages), and region, with regional variations driven by factors such as food consumption patterns, regulatory frameworks, and economic growth.
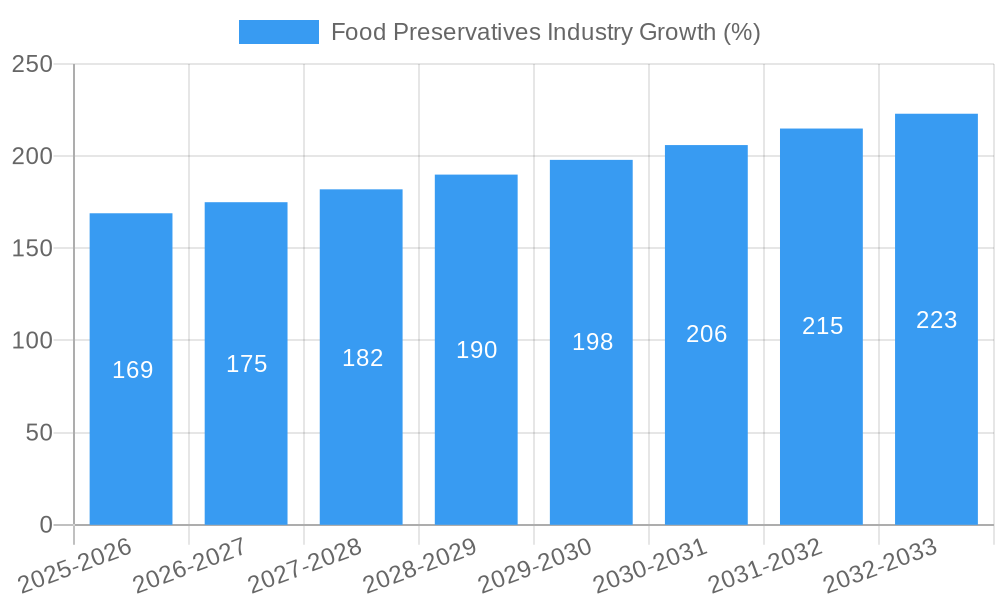
The forecast period (2025-2033) anticipates continued expansion, with a compound annual growth rate (CAGR) of 4.81%. This growth will be fueled by further innovation in preservation technologies and the continued rise of the global food processing industry. The market's trajectory will be influenced by factors such as fluctuating raw material prices, evolving consumer preferences for clean-label products, and stringent food safety regulations. The emergence of novel preservatives, such as bacteriocin-producing cultures and other bio-based alternatives, will also shape the market landscape, providing increased opportunities for market participants. Strategic partnerships and mergers & acquisitions will likely contribute to the consolidation of the market.
Food Preservatives Industry Market Report: 2019-2033
This comprehensive report provides an in-depth analysis of the global food preservatives market, projecting robust growth from 2019 to 2033. We delve into market dynamics, key players, emerging trends, and future opportunities within this vital sector. Discover actionable insights to navigate the evolving landscape of food preservation and capitalize on promising avenues for growth. The report covers a market valued at billions, with a detailed breakdown of segments and leading companies including Kemin Industries Inc, Givaudan SA, Synthite Industries Ltd, International Flavors & Fragrances Inc, Mane Kancor Ingredients Pvt Ltd, BASF SE, Tate & Lyle PLC, Corbion NV, Hawkins Watt Limited, and Eastman Chemical Company. This is not an exhaustive list.
Food Preservatives Industry Market Dynamics & Concentration
The global food preservatives market is characterized by moderate concentration, with a few major players commanding significant market share. The market is driven by increasing demand for processed foods, stringent food safety regulations, and the growing consumer preference for extended shelf life products. Innovation plays a crucial role, with companies constantly developing new preservatives with improved efficacy and cleaner labels. Mergers and acquisitions (M&A) activity further shapes the market landscape, with larger companies acquiring smaller players to expand their product portfolios and geographic reach. Regulatory frameworks vary across regions, impacting product approvals and market access. The availability of substitutes, like natural preservatives, presents both opportunities and challenges. End-user trends, such as the increasing demand for convenient and ready-to-eat foods, fuel market growth.
- Market Share: The top 5 players hold approximately XX% of the global market share in 2024.
- M&A Activity: An estimated XX M&A deals were recorded in the food preservatives industry between 2019 and 2024.
- Innovation Drivers: Clean label trends, consumer demand for natural preservatives, and advancements in preservation technologies.
- Regulatory Frameworks: Varying regulations across regions influence product development and market entry.
Food Preservatives Industry Industry Trends & Analysis
The food preservatives market is experiencing significant growth, driven by several key factors. The increasing demand for processed and convenient foods is a major catalyst, as preservatives are essential for extending the shelf life of these products. Technological advancements, such as the development of novel preservation techniques and natural preservatives, are reshaping the industry. Consumer preferences are shifting towards clean-label products, leading to increased demand for natural and less processed preservatives. The competitive landscape is dynamic, with companies engaging in intense innovation and strategic partnerships to maintain a competitive edge. The market is projected to exhibit a CAGR of XX% during the forecast period (2025-2033), with market penetration expected to reach XX% by 2033.
Leading Markets & Segments in Food Preservatives Industry
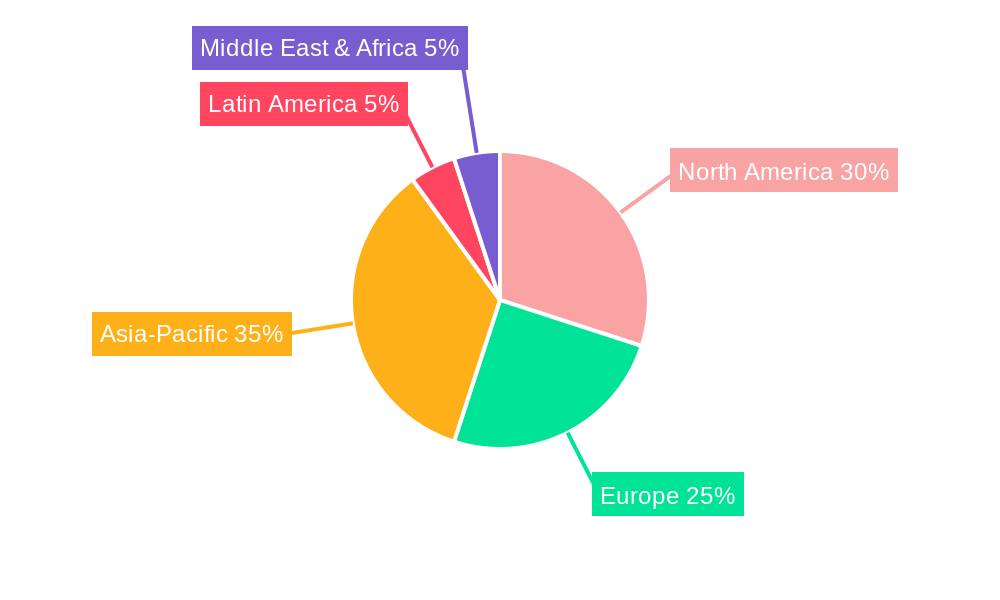
The Asia-Pacific region is projected to dominate the food preservatives market, driven by several factors:
- Rapid Economic Growth: Rising disposable incomes and urbanization are fueling demand for processed foods.
- Expanding Food Processing Industry: Growth in the food processing sector necessitates increased usage of preservatives.
- Favorable Government Policies: Supportive government initiatives aimed at boosting food production and processing.
Other regions, such as North America and Europe, also contribute significantly to market growth, though at a slightly slower pace compared to the Asia-Pacific region. Within the market, meat and poultry preservation remain a dominant segment, driven by the substantial size of the global meat industry. Dairy products and bakery items represent other sizable segments.
Food Preservatives Industry Product Developments
Recent innovations include the introduction of natural and clean-label preservatives, addressing growing consumer demand for healthier and more sustainable food options. Technological advancements focus on enhancing the efficacy of preservatives while maintaining product quality and sensory attributes. These new offerings aim to secure a competitive edge by catering to specific consumer needs and market segments. Furthermore, advanced preservation technologies, such as high-pressure processing (HPP) and pulsed electric field (PEF) treatments, are gaining traction, offering alternatives to traditional chemical preservatives.
Key Drivers of Food Preservatives Industry Growth
Several factors are driving growth in the food preservatives market. The rising global population and increased demand for convenient, ready-to-eat food products necessitate the use of preservatives to maintain food quality and safety. Advancements in preservation technologies contribute to longer shelf lives and reduced food waste. Stringent food safety regulations worldwide mandate the use of effective and safe preservatives in food products. Economic growth, especially in developing countries, has led to higher purchasing power and a change in dietary patterns, further increasing demand for processed foods and subsequently for food preservatives.
Challenges in the Food Preservatives Industry Market
The food preservatives industry faces several challenges. Stringent regulatory frameworks for approval of new preservatives can increase development costs and timelines. Fluctuations in raw material prices can impact profitability. Growing consumer preference for natural preservatives can limit the market for traditional chemical preservatives. Intense competition among established players and the emergence of new entrants pose a significant challenge. These factors can negatively impact the industry's growth trajectory, resulting in a potential slowdown of the overall market expansion. For instance, XX% of manufacturers reported experiencing supply chain disruptions in 2024.
Emerging Opportunities in Food Preservatives Industry
The food preservatives market presents significant growth opportunities. The development of innovative, natural preservatives caters to growing consumer demand for clean-label products. Strategic partnerships between preservative manufacturers and food producers create synergies and expand market reach. Expansion into developing markets presents considerable growth potential. Technological advancements, like the use of nanotechnology in food preservation, provide opportunities for increased efficiency and improved shelf life.
Leading Players in the Food Preservatives Industry Sector
- Kemin Industries Inc
- Givaudan SA
- Synthite Industries Ltd
- International Flavors & Fragrances Inc
- Mane Kancor Ingredients Pvt Ltd
- BASF SE
- Tate & Lyle PLC
- Corbion NV
- Hawkins Watt Limited
- Eastman Chemical Company
Key Milestones in Food Preservatives Industry Industry
- July 2022: Kemin Industries Inc. launched RUBINITE GC Dry, a natural alternative to sodium nitrite as a curing agent.
- March 2022: DSM launched DelvoGuard cultures, extending the shelf life of dairy products.
- November 2021: Tate & Lyle PLC announced the construction of a new biomass boiler at its Brazilian plant.
- April 2021: Kemin Industries Inc. expanded its distribution agreement with DKSH in the Philippines and Indonesia.
Strategic Outlook for Food Preservatives Industry Market
The food preservatives market is poised for continued growth, driven by factors such as increasing demand for processed foods, technological advancements, and changing consumer preferences. Strategic partnerships, expansion into new markets, and the development of innovative, sustainable products will play a crucial role in shaping the future of the industry. Companies focusing on clean-label solutions and sustainable practices are expected to gain a competitive advantage. The market shows substantial potential for further growth in the coming years.
Food Preservatives Industry Segmentation
-
1. Type
-
1.1. Antioxidants
- 1.1.1. Natural Antioxidants
- 1.1.2. Synthetic Antioxidants
-
1.2. Antimicrobials
- 1.2.1. Natural Antimicrobial
- 1.2.2. Synthetic Antimicrobial
- 1.3. Acidulant
- 1.4. Other Types
-
1.1. Antioxidants
-
2. Application
- 2.1. Bakery and Confectionery
- 2.2. Meat and Poultry
- 2.3. Ready Meals
- 2.4. Sweet and Savory Snacks
- 2.5. Sauces and Dressings
- 2.6. Edible Oils
- 2.7. Other Applications
Food Preservatives Industry Segmentation By Geography
-
1. North America
- 1.1. United States
- 1.2. Canada
- 1.3. Mexico
- 1.4. Rest of North America
-
2. Europe
- 2.1. Spain
- 2.2. United Kingdom
- 2.3. Germany
- 2.4. France
- 2.5. Italy
- 2.6. Russia
- 2.7. Rest of Europe
-
3. Asia Pacific
- 3.1. China
- 3.2. Japan
- 3.3. India
- 3.4. Australia
- 3.5. Rest of Asia Pacific
-
4. South America
- 4.1. Brazil
- 4.2. Argentina
- 4.3. Rest of South America
-
5. Middle East and Africa
- 5.1. South Africa
- 5.2. United Arab Emirates
- 5.3. Rest of Middle East and Africa
Food Preservatives Industry REPORT HIGHLIGHTS
| Aspects | Details |
|---|---|
| Study Period | 2019-2033 |
| Base Year | 2024 |
| Estimated Year | 2025 |
| Forecast Period | 2025-2033 |
| Historical Period | 2019-2024 |
| Growth Rate | CAGR of 4.81% from 2019-2033 |
| Segmentation |
|
Table of Contents
- 1. Introduction
- 1.1. Research Scope
- 1.2. Market Segmentation
- 1.3. Research Methodology
- 1.4. Definitions and Assumptions
- 2. Executive Summary
- 2.1. Introduction
- 3. Market Dynamics
- 3.1. Introduction
- 3.2. Market Drivers
- 3.3. Market Restrains
- 3.4. Market Trends
- 3.4.1. Surge in Demand for Clean Label Food Products
- 4. Market Factor Analysis
- 4.1. Porters Five Forces
- 4.2. Supply/Value Chain
- 4.3. PESTEL analysis
- 4.4. Market Entropy
- 4.5. Patent/Trademark Analysis
- 5. Global Food Preservatives Industry Analysis, Insights and Forecast, 2019-2031
- 5.1. Market Analysis, Insights and Forecast - by Type
- 5.1.1. Antioxidants
- 5.1.1.1. Natural Antioxidants
- 5.1.1.2. Synthetic Antioxidants
- 5.1.2. Antimicrobials
- 5.1.2.1. Natural Antimicrobial
- 5.1.2.2. Synthetic Antimicrobial
- 5.1.3. Acidulant
- 5.1.4. Other Types
- 5.1.1. Antioxidants
- 5.2. Market Analysis, Insights and Forecast - by Application
- 5.2.1. Bakery and Confectionery
- 5.2.2. Meat and Poultry
- 5.2.3. Ready Meals
- 5.2.4. Sweet and Savory Snacks
- 5.2.5. Sauces and Dressings
- 5.2.6. Edible Oils
- 5.2.7. Other Applications
- 5.3. Market Analysis, Insights and Forecast - by Region
- 5.3.1. North America
- 5.3.2. Europe
- 5.3.3. Asia Pacific
- 5.3.4. South America
- 5.3.5. Middle East and Africa
- 5.1. Market Analysis, Insights and Forecast - by Type
- 6. North America Food Preservatives Industry Analysis, Insights and Forecast, 2019-2031
- 6.1. Market Analysis, Insights and Forecast - by Type
- 6.1.1. Antioxidants
- 6.1.1.1. Natural Antioxidants
- 6.1.1.2. Synthetic Antioxidants
- 6.1.2. Antimicrobials
- 6.1.2.1. Natural Antimicrobial
- 6.1.2.2. Synthetic Antimicrobial
- 6.1.3. Acidulant
- 6.1.4. Other Types
- 6.1.1. Antioxidants
- 6.2. Market Analysis, Insights and Forecast - by Application
- 6.2.1. Bakery and Confectionery
- 6.2.2. Meat and Poultry
- 6.2.3. Ready Meals
- 6.2.4. Sweet and Savory Snacks
- 6.2.5. Sauces and Dressings
- 6.2.6. Edible Oils
- 6.2.7. Other Applications
- 6.1. Market Analysis, Insights and Forecast - by Type
- 7. Europe Food Preservatives Industry Analysis, Insights and Forecast, 2019-2031
- 7.1. Market Analysis, Insights and Forecast - by Type
- 7.1.1. Antioxidants
- 7.1.1.1. Natural Antioxidants
- 7.1.1.2. Synthetic Antioxidants
- 7.1.2. Antimicrobials
- 7.1.2.1. Natural Antimicrobial
- 7.1.2.2. Synthetic Antimicrobial
- 7.1.3. Acidulant
- 7.1.4. Other Types
- 7.1.1. Antioxidants
- 7.2. Market Analysis, Insights and Forecast - by Application
- 7.2.1. Bakery and Confectionery
- 7.2.2. Meat and Poultry
- 7.2.3. Ready Meals
- 7.2.4. Sweet and Savory Snacks
- 7.2.5. Sauces and Dressings
- 7.2.6. Edible Oils
- 7.2.7. Other Applications
- 7.1. Market Analysis, Insights and Forecast - by Type
- 8. Asia Pacific Food Preservatives Industry Analysis, Insights and Forecast, 2019-2031
- 8.1. Market Analysis, Insights and Forecast - by Type
- 8.1.1. Antioxidants
- 8.1.1.1. Natural Antioxidants
- 8.1.1.2. Synthetic Antioxidants
- 8.1.2. Antimicrobials
- 8.1.2.1. Natural Antimicrobial
- 8.1.2.2. Synthetic Antimicrobial
- 8.1.3. Acidulant
- 8.1.4. Other Types
- 8.1.1. Antioxidants
- 8.2. Market Analysis, Insights and Forecast - by Application
- 8.2.1. Bakery and Confectionery
- 8.2.2. Meat and Poultry
- 8.2.3. Ready Meals
- 8.2.4. Sweet and Savory Snacks
- 8.2.5. Sauces and Dressings
- 8.2.6. Edible Oils
- 8.2.7. Other Applications
- 8.1. Market Analysis, Insights and Forecast - by Type
- 9. South America Food Preservatives Industry Analysis, Insights and Forecast, 2019-2031
- 9.1. Market Analysis, Insights and Forecast - by Type
- 9.1.1. Antioxidants
- 9.1.1.1. Natural Antioxidants
- 9.1.1.2. Synthetic Antioxidants
- 9.1.2. Antimicrobials
- 9.1.2.1. Natural Antimicrobial
- 9.1.2.2. Synthetic Antimicrobial
- 9.1.3. Acidulant
- 9.1.4. Other Types
- 9.1.1. Antioxidants
- 9.2. Market Analysis, Insights and Forecast - by Application
- 9.2.1. Bakery and Confectionery
- 9.2.2. Meat and Poultry
- 9.2.3. Ready Meals
- 9.2.4. Sweet and Savory Snacks
- 9.2.5. Sauces and Dressings
- 9.2.6. Edible Oils
- 9.2.7. Other Applications
- 9.1. Market Analysis, Insights and Forecast - by Type
- 10. Middle East and Africa Food Preservatives Industry Analysis, Insights and Forecast, 2019-2031
- 10.1. Market Analysis, Insights and Forecast - by Type
- 10.1.1. Antioxidants
- 10.1.1.1. Natural Antioxidants
- 10.1.1.2. Synthetic Antioxidants
- 10.1.2. Antimicrobials
- 10.1.2.1. Natural Antimicrobial
- 10.1.2.2. Synthetic Antimicrobial
- 10.1.3. Acidulant
- 10.1.4. Other Types
- 10.1.1. Antioxidants
- 10.2. Market Analysis, Insights and Forecast - by Application
- 10.2.1. Bakery and Confectionery
- 10.2.2. Meat and Poultry
- 10.2.3. Ready Meals
- 10.2.4. Sweet and Savory Snacks
- 10.2.5. Sauces and Dressings
- 10.2.6. Edible Oils
- 10.2.7. Other Applications
- 10.1. Market Analysis, Insights and Forecast - by Type
- 11. Competitive Analysis
- 11.1. Global Market Share Analysis 2024
- 11.2. Company Profiles
- 11.2.1 Kemin Industries Inc
- 11.2.1.1. Overview
- 11.2.1.2. Products
- 11.2.1.3. SWOT Analysis
- 11.2.1.4. Recent Developments
- 11.2.1.5. Financials (Based on Availability)
- 11.2.2 Givuadan SA
- 11.2.2.1. Overview
- 11.2.2.2. Products
- 11.2.2.3. SWOT Analysis
- 11.2.2.4. Recent Developments
- 11.2.2.5. Financials (Based on Availability)
- 11.2.3 Synthite Industries Ltd
- 11.2.3.1. Overview
- 11.2.3.2. Products
- 11.2.3.3. SWOT Analysis
- 11.2.3.4. Recent Developments
- 11.2.3.5. Financials (Based on Availability)
- 11.2.4 International Flavors & Fragrances Inc
- 11.2.4.1. Overview
- 11.2.4.2. Products
- 11.2.4.3. SWOT Analysis
- 11.2.4.4. Recent Developments
- 11.2.4.5. Financials (Based on Availability)
- 11.2.5 Mane Kancor Ingredients Pvt Ltd
- 11.2.5.1. Overview
- 11.2.5.2. Products
- 11.2.5.3. SWOT Analysis
- 11.2.5.4. Recent Developments
- 11.2.5.5. Financials (Based on Availability)
- 11.2.6 BASF SE
- 11.2.6.1. Overview
- 11.2.6.2. Products
- 11.2.6.3. SWOT Analysis
- 11.2.6.4. Recent Developments
- 11.2.6.5. Financials (Based on Availability)
- 11.2.7 Tate & Lyle PLC
- 11.2.7.1. Overview
- 11.2.7.2. Products
- 11.2.7.3. SWOT Analysis
- 11.2.7.4. Recent Developments
- 11.2.7.5. Financials (Based on Availability)
- 11.2.8 Corbion NV
- 11.2.8.1. Overview
- 11.2.8.2. Products
- 11.2.8.3. SWOT Analysis
- 11.2.8.4. Recent Developments
- 11.2.8.5. Financials (Based on Availability)
- 11.2.9 Hawkins Watt Limited
- 11.2.9.1. Overview
- 11.2.9.2. Products
- 11.2.9.3. SWOT Analysis
- 11.2.9.4. Recent Developments
- 11.2.9.5. Financials (Based on Availability)
- 11.2.10 Eastman Chemical Company*List Not Exhaustive
- 11.2.10.1. Overview
- 11.2.10.2. Products
- 11.2.10.3. SWOT Analysis
- 11.2.10.4. Recent Developments
- 11.2.10.5. Financials (Based on Availability)
- 11.2.1 Kemin Industries Inc
List of Figures
- Figure 1: Global Food Preservatives Industry Revenue Breakdown (Million, %) by Region 2024 & 2032
- Figure 2: Global Food Preservatives Industry Volume Breakdown (Billion, %) by Region 2024 & 2032
- Figure 3: North America Food Preservatives Industry Revenue (Million), by Type 2024 & 2032
- Figure 4: North America Food Preservatives Industry Volume (Billion), by Type 2024 & 2032
- Figure 5: North America Food Preservatives Industry Revenue Share (%), by Type 2024 & 2032
- Figure 6: North America Food Preservatives Industry Volume Share (%), by Type 2024 & 2032
- Figure 7: North America Food Preservatives Industry Revenue (Million), by Application 2024 & 2032
- Figure 8: North America Food Preservatives Industry Volume (Billion), by Application 2024 & 2032
- Figure 9: North America Food Preservatives Industry Revenue Share (%), by Application 2024 & 2032
- Figure 10: North America Food Preservatives Industry Volume Share (%), by Application 2024 & 2032
- Figure 11: North America Food Preservatives Industry Revenue (Million), by Country 2024 & 2032
- Figure 12: North America Food Preservatives Industry Volume (Billion), by Country 2024 & 2032
- Figure 13: North America Food Preservatives Industry Revenue Share (%), by Country 2024 & 2032
- Figure 14: North America Food Preservatives Industry Volume Share (%), by Country 2024 & 2032
- Figure 15: Europe Food Preservatives Industry Revenue (Million), by Type 2024 & 2032
- Figure 16: Europe Food Preservatives Industry Volume (Billion), by Type 2024 & 2032
- Figure 17: Europe Food Preservatives Industry Revenue Share (%), by Type 2024 & 2032
- Figure 18: Europe Food Preservatives Industry Volume Share (%), by Type 2024 & 2032
- Figure 19: Europe Food Preservatives Industry Revenue (Million), by Application 2024 & 2032
- Figure 20: Europe Food Preservatives Industry Volume (Billion), by Application 2024 & 2032
- Figure 21: Europe Food Preservatives Industry Revenue Share (%), by Application 2024 & 2032
- Figure 22: Europe Food Preservatives Industry Volume Share (%), by Application 2024 & 2032
- Figure 23: Europe Food Preservatives Industry Revenue (Million), by Country 2024 & 2032
- Figure 24: Europe Food Preservatives Industry Volume (Billion), by Country 2024 & 2032
- Figure 25: Europe Food Preservatives Industry Revenue Share (%), by Country 2024 & 2032
- Figure 26: Europe Food Preservatives Industry Volume Share (%), by Country 2024 & 2032
- Figure 27: Asia Pacific Food Preservatives Industry Revenue (Million), by Type 2024 & 2032
- Figure 28: Asia Pacific Food Preservatives Industry Volume (Billion), by Type 2024 & 2032
- Figure 29: Asia Pacific Food Preservatives Industry Revenue Share (%), by Type 2024 & 2032
- Figure 30: Asia Pacific Food Preservatives Industry Volume Share (%), by Type 2024 & 2032
- Figure 31: Asia Pacific Food Preservatives Industry Revenue (Million), by Application 2024 & 2032
- Figure 32: Asia Pacific Food Preservatives Industry Volume (Billion), by Application 2024 & 2032
- Figure 33: Asia Pacific Food Preservatives Industry Revenue Share (%), by Application 2024 & 2032
- Figure 34: Asia Pacific Food Preservatives Industry Volume Share (%), by Application 2024 & 2032
- Figure 35: Asia Pacific Food Preservatives Industry Revenue (Million), by Country 2024 & 2032
- Figure 36: Asia Pacific Food Preservatives Industry Volume (Billion), by Country 2024 & 2032
- Figure 37: Asia Pacific Food Preservatives Industry Revenue Share (%), by Country 2024 & 2032
- Figure 38: Asia Pacific Food Preservatives Industry Volume Share (%), by Country 2024 & 2032
- Figure 39: South America Food Preservatives Industry Revenue (Million), by Type 2024 & 2032
- Figure 40: South America Food Preservatives Industry Volume (Billion), by Type 2024 & 2032
- Figure 41: South America Food Preservatives Industry Revenue Share (%), by Type 2024 & 2032
- Figure 42: South America Food Preservatives Industry Volume Share (%), by Type 2024 & 2032
- Figure 43: South America Food Preservatives Industry Revenue (Million), by Application 2024 & 2032
- Figure 44: South America Food Preservatives Industry Volume (Billion), by Application 2024 & 2032
- Figure 45: South America Food Preservatives Industry Revenue Share (%), by Application 2024 & 2032
- Figure 46: South America Food Preservatives Industry Volume Share (%), by Application 2024 & 2032
- Figure 47: South America Food Preservatives Industry Revenue (Million), by Country 2024 & 2032
- Figure 48: South America Food Preservatives Industry Volume (Billion), by Country 2024 & 2032
- Figure 49: South America Food Preservatives Industry Revenue Share (%), by Country 2024 & 2032
- Figure 50: South America Food Preservatives Industry Volume Share (%), by Country 2024 & 2032
- Figure 51: Middle East and Africa Food Preservatives Industry Revenue (Million), by Type 2024 & 2032
- Figure 52: Middle East and Africa Food Preservatives Industry Volume (Billion), by Type 2024 & 2032
- Figure 53: Middle East and Africa Food Preservatives Industry Revenue Share (%), by Type 2024 & 2032
- Figure 54: Middle East and Africa Food Preservatives Industry Volume Share (%), by Type 2024 & 2032
- Figure 55: Middle East and Africa Food Preservatives Industry Revenue (Million), by Application 2024 & 2032
- Figure 56: Middle East and Africa Food Preservatives Industry Volume (Billion), by Application 2024 & 2032
- Figure 57: Middle East and Africa Food Preservatives Industry Revenue Share (%), by Application 2024 & 2032
- Figure 58: Middle East and Africa Food Preservatives Industry Volume Share (%), by Application 2024 & 2032
- Figure 59: Middle East and Africa Food Preservatives Industry Revenue (Million), by Country 2024 & 2032
- Figure 60: Middle East and Africa Food Preservatives Industry Volume (Billion), by Country 2024 & 2032
- Figure 61: Middle East and Africa Food Preservatives Industry Revenue Share (%), by Country 2024 & 2032
- Figure 62: Middle East and Africa Food Preservatives Industry Volume Share (%), by Country 2024 & 2032
List of Tables
- Table 1: Global Food Preservatives Industry Revenue Million Forecast, by Region 2019 & 2032
- Table 2: Global Food Preservatives Industry Volume Billion Forecast, by Region 2019 & 2032
- Table 3: Global Food Preservatives Industry Revenue Million Forecast, by Type 2019 & 2032
- Table 4: Global Food Preservatives Industry Volume Billion Forecast, by Type 2019 & 2032
- Table 5: Global Food Preservatives Industry Revenue Million Forecast, by Application 2019 & 2032
- Table 6: Global Food Preservatives Industry Volume Billion Forecast, by Application 2019 & 2032
- Table 7: Global Food Preservatives Industry Revenue Million Forecast, by Region 2019 & 2032
- Table 8: Global Food Preservatives Industry Volume Billion Forecast, by Region 2019 & 2032
- Table 9: Global Food Preservatives Industry Revenue Million Forecast, by Type 2019 & 2032
- Table 10: Global Food Preservatives Industry Volume Billion Forecast, by Type 2019 & 2032
- Table 11: Global Food Preservatives Industry Revenue Million Forecast, by Application 2019 & 2032
- Table 12: Global Food Preservatives Industry Volume Billion Forecast, by Application 2019 & 2032
- Table 13: Global Food Preservatives Industry Revenue Million Forecast, by Country 2019 & 2032
- Table 14: Global Food Preservatives Industry Volume Billion Forecast, by Country 2019 & 2032
- Table 15: United States Food Preservatives Industry Revenue (Million) Forecast, by Application 2019 & 2032
- Table 16: United States Food Preservatives Industry Volume (Billion) Forecast, by Application 2019 & 2032
- Table 17: Canada Food Preservatives Industry Revenue (Million) Forecast, by Application 2019 & 2032
- Table 18: Canada Food Preservatives Industry Volume (Billion) Forecast, by Application 2019 & 2032
- Table 19: Mexico Food Preservatives Industry Revenue (Million) Forecast, by Application 2019 & 2032
- Table 20: Mexico Food Preservatives Industry Volume (Billion) Forecast, by Application 2019 & 2032
- Table 21: Rest of North America Food Preservatives Industry Revenue (Million) Forecast, by Application 2019 & 2032
- Table 22: Rest of North America Food Preservatives Industry Volume (Billion) Forecast, by Application 2019 & 2032
- Table 23: Global Food Preservatives Industry Revenue Million Forecast, by Type 2019 & 2032
- Table 24: Global Food Preservatives Industry Volume Billion Forecast, by Type 2019 & 2032
- Table 25: Global Food Preservatives Industry Revenue Million Forecast, by Application 2019 & 2032
- Table 26: Global Food Preservatives Industry Volume Billion Forecast, by Application 2019 & 2032
- Table 27: Global Food Preservatives Industry Revenue Million Forecast, by Country 2019 & 2032
- Table 28: Global Food Preservatives Industry Volume Billion Forecast, by Country 2019 & 2032
- Table 29: Spain Food Preservatives Industry Revenue (Million) Forecast, by Application 2019 & 2032
- Table 30: Spain Food Preservatives Industry Volume (Billion) Forecast, by Application 2019 & 2032
- Table 31: United Kingdom Food Preservatives Industry Revenue (Million) Forecast, by Application 2019 & 2032
- Table 32: United Kingdom Food Preservatives Industry Volume (Billion) Forecast, by Application 2019 & 2032
- Table 33: Germany Food Preservatives Industry Revenue (Million) Forecast, by Application 2019 & 2032
- Table 34: Germany Food Preservatives Industry Volume (Billion) Forecast, by Application 2019 & 2032
- Table 35: France Food Preservatives Industry Revenue (Million) Forecast, by Application 2019 & 2032
- Table 36: France Food Preservatives Industry Volume (Billion) Forecast, by Application 2019 & 2032
- Table 37: Italy Food Preservatives Industry Revenue (Million) Forecast, by Application 2019 & 2032
- Table 38: Italy Food Preservatives Industry Volume (Billion) Forecast, by Application 2019 & 2032
- Table 39: Russia Food Preservatives Industry Revenue (Million) Forecast, by Application 2019 & 2032
- Table 40: Russia Food Preservatives Industry Volume (Billion) Forecast, by Application 2019 & 2032
- Table 41: Rest of Europe Food Preservatives Industry Revenue (Million) Forecast, by Application 2019 & 2032
- Table 42: Rest of Europe Food Preservatives Industry Volume (Billion) Forecast, by Application 2019 & 2032
- Table 43: Global Food Preservatives Industry Revenue Million Forecast, by Type 2019 & 2032
- Table 44: Global Food Preservatives Industry Volume Billion Forecast, by Type 2019 & 2032
- Table 45: Global Food Preservatives Industry Revenue Million Forecast, by Application 2019 & 2032
- Table 46: Global Food Preservatives Industry Volume Billion Forecast, by Application 2019 & 2032
- Table 47: Global Food Preservatives Industry Revenue Million Forecast, by Country 2019 & 2032
- Table 48: Global Food Preservatives Industry Volume Billion Forecast, by Country 2019 & 2032
- Table 49: China Food Preservatives Industry Revenue (Million) Forecast, by Application 2019 & 2032
- Table 50: China Food Preservatives Industry Volume (Billion) Forecast, by Application 2019 & 2032
- Table 51: Japan Food Preservatives Industry Revenue (Million) Forecast, by Application 2019 & 2032
- Table 52: Japan Food Preservatives Industry Volume (Billion) Forecast, by Application 2019 & 2032
- Table 53: India Food Preservatives Industry Revenue (Million) Forecast, by Application 2019 & 2032
- Table 54: India Food Preservatives Industry Volume (Billion) Forecast, by Application 2019 & 2032
- Table 55: Australia Food Preservatives Industry Revenue (Million) Forecast, by Application 2019 & 2032
- Table 56: Australia Food Preservatives Industry Volume (Billion) Forecast, by Application 2019 & 2032
- Table 57: Rest of Asia Pacific Food Preservatives Industry Revenue (Million) Forecast, by Application 2019 & 2032
- Table 58: Rest of Asia Pacific Food Preservatives Industry Volume (Billion) Forecast, by Application 2019 & 2032
- Table 59: Global Food Preservatives Industry Revenue Million Forecast, by Type 2019 & 2032
- Table 60: Global Food Preservatives Industry Volume Billion Forecast, by Type 2019 & 2032
- Table 61: Global Food Preservatives Industry Revenue Million Forecast, by Application 2019 & 2032
- Table 62: Global Food Preservatives Industry Volume Billion Forecast, by Application 2019 & 2032
- Table 63: Global Food Preservatives Industry Revenue Million Forecast, by Country 2019 & 2032
- Table 64: Global Food Preservatives Industry Volume Billion Forecast, by Country 2019 & 2032
- Table 65: Brazil Food Preservatives Industry Revenue (Million) Forecast, by Application 2019 & 2032
- Table 66: Brazil Food Preservatives Industry Volume (Billion) Forecast, by Application 2019 & 2032
- Table 67: Argentina Food Preservatives Industry Revenue (Million) Forecast, by Application 2019 & 2032
- Table 68: Argentina Food Preservatives Industry Volume (Billion) Forecast, by Application 2019 & 2032
- Table 69: Rest of South America Food Preservatives Industry Revenue (Million) Forecast, by Application 2019 & 2032
- Table 70: Rest of South America Food Preservatives Industry Volume (Billion) Forecast, by Application 2019 & 2032
- Table 71: Global Food Preservatives Industry Revenue Million Forecast, by Type 2019 & 2032
- Table 72: Global Food Preservatives Industry Volume Billion Forecast, by Type 2019 & 2032
- Table 73: Global Food Preservatives Industry Revenue Million Forecast, by Application 2019 & 2032
- Table 74: Global Food Preservatives Industry Volume Billion Forecast, by Application 2019 & 2032
- Table 75: Global Food Preservatives Industry Revenue Million Forecast, by Country 2019 & 2032
- Table 76: Global Food Preservatives Industry Volume Billion Forecast, by Country 2019 & 2032
- Table 77: South Africa Food Preservatives Industry Revenue (Million) Forecast, by Application 2019 & 2032
- Table 78: South Africa Food Preservatives Industry Volume (Billion) Forecast, by Application 2019 & 2032
- Table 79: United Arab Emirates Food Preservatives Industry Revenue (Million) Forecast, by Application 2019 & 2032
- Table 80: United Arab Emirates Food Preservatives Industry Volume (Billion) Forecast, by Application 2019 & 2032
- Table 81: Rest of Middle East and Africa Food Preservatives Industry Revenue (Million) Forecast, by Application 2019 & 2032
- Table 82: Rest of Middle East and Africa Food Preservatives Industry Volume (Billion) Forecast, by Application 2019 & 2032
Frequently Asked Questions
1. What is the projected Compound Annual Growth Rate (CAGR) of the Food Preservatives Industry?
The projected CAGR is approximately 4.81%.
2. Which companies are prominent players in the Food Preservatives Industry?
Key companies in the market include Kemin Industries Inc, Givuadan SA, Synthite Industries Ltd, International Flavors & Fragrances Inc, Mane Kancor Ingredients Pvt Ltd, BASF SE, Tate & Lyle PLC, Corbion NV, Hawkins Watt Limited, Eastman Chemical Company*List Not Exhaustive.
3. What are the main segments of the Food Preservatives Industry?
The market segments include Type, Application.
4. Can you provide details about the market size?
The market size is estimated to be USD 3.40 Million as of 2022.
5. What are some drivers contributing to market growth?
N/A
6. What are the notable trends driving market growth?
Surge in Demand for Clean Label Food Products.
7. Are there any restraints impacting market growth?
N/A
8. Can you provide examples of recent developments in the market?
July 2022: Kemin Industries Inc. launched a new food preservative, RUBINITE GC Dry, as a substitute for sodium nitrite. As per the company, RUBINITE is a natural alternative that can be used as a curing agent in foods, offering the best microbiological protection and maintaining product stability. Furthermore, Kemin Industries intends to employ it in processed meat products like sausages and hot dogs.
9. What pricing options are available for accessing the report?
Pricing options include single-user, multi-user, and enterprise licenses priced at USD 4750, USD 5250, and USD 8750 respectively.
10. Is the market size provided in terms of value or volume?
The market size is provided in terms of value, measured in Million and volume, measured in Billion.
11. Are there any specific market keywords associated with the report?
Yes, the market keyword associated with the report is "Food Preservatives Industry," which aids in identifying and referencing the specific market segment covered.
12. How do I determine which pricing option suits my needs best?
The pricing options vary based on user requirements and access needs. Individual users may opt for single-user licenses, while businesses requiring broader access may choose multi-user or enterprise licenses for cost-effective access to the report.
13. Are there any additional resources or data provided in the Food Preservatives Industry report?
While the report offers comprehensive insights, it's advisable to review the specific contents or supplementary materials provided to ascertain if additional resources or data are available.
14. How can I stay updated on further developments or reports in the Food Preservatives Industry?
To stay informed about further developments, trends, and reports in the Food Preservatives Industry, consider subscribing to industry newsletters, following relevant companies and organizations, or regularly checking reputable industry news sources and publications.
Methodology
Step 1 - Identification of Relevant Samples Size from Population Database


Step 2 - Approaches for Defining Global Market Size (Value, Volume* & Price*)

Note*: In applicable scenarios
Step 3 - Data Sources
Primary Research
- Web Analytics
- Survey Reports
- Research Institute
- Latest Research Reports
- Opinion Leaders
Secondary Research
- Annual Reports
- White Paper
- Latest Press Release
- Industry Association
- Paid Database
- Investor Presentations

Step 4 - Data Triangulation
Involves using different sources of information in order to increase the validity of a study
These sources are likely to be stakeholders in a program - participants, other researchers, program staff, other community members, and so on.
Then we put all data in single framework & apply various statistical tools to find out the dynamic on the market.
During the analysis stage, feedback from the stakeholder groups would be compared to determine areas of agreement as well as areas of divergence
