

Key Insights
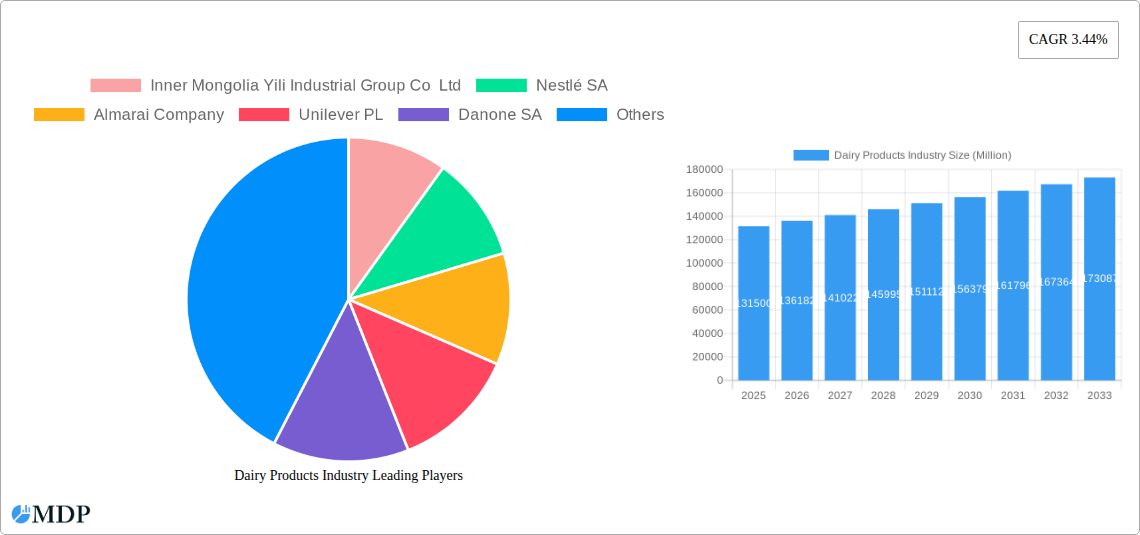
The global dairy products market, valued at $131.5 billion in 2025, is projected to experience steady growth, driven by rising global populations, increasing disposable incomes in developing economies, and a growing preference for convenient and nutritious dairy-based foods. Key growth drivers include the increasing demand for value-added dairy products like yogurt and cheese, fueled by health and wellness trends. The market is segmented by distribution channel (off-trade encompassing supermarkets and convenience stores, and on-trade including restaurants, cafes, and hotels), product category (milk, butter, yogurt, cheese, and others such as those sold in warehouse clubs and gas stations), and geography. Competition is fierce, with major players like Nestle, Danone, and Yili vying for market share through innovation, brand building, and strategic acquisitions. While fluctuating raw material prices and concerns regarding saturated fat content pose challenges, the market's overall outlook remains positive, bolstered by ongoing product diversification and the exploration of alternative dairy sources, including plant-based options. The increasing adoption of sustainable and ethical sourcing practices also plays a role, impacting consumer choices and influencing the strategies of leading dairy producers.
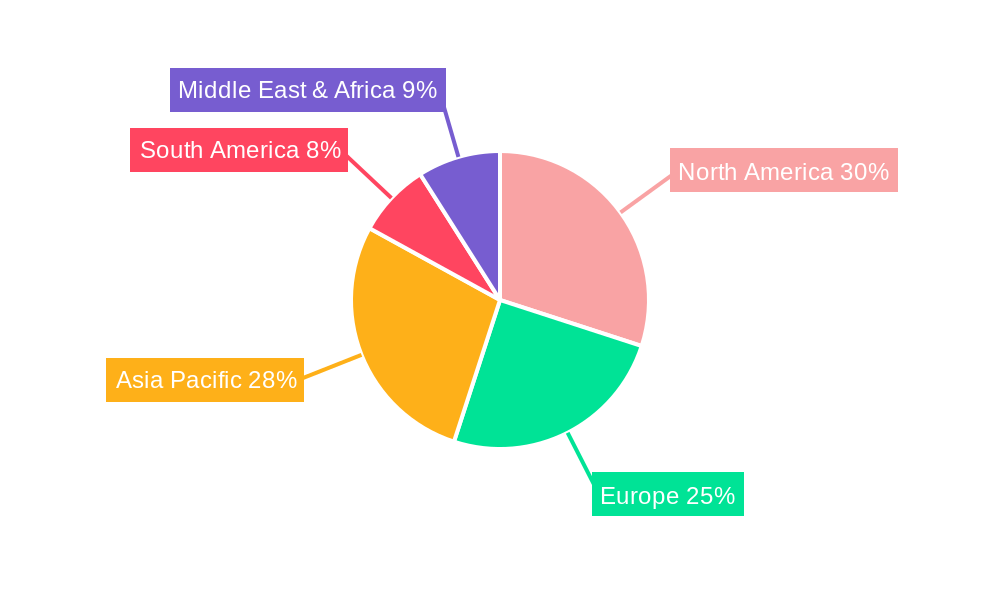
The market's geographic distribution shows significant variations, with North America and Europe maintaining substantial market shares due to high per capita consumption and established dairy industries. However, Asia Pacific is poised for significant growth, driven by rapidly expanding middle classes and rising dairy consumption in countries like China and India. The market’s continued expansion will hinge on addressing consumer preferences towards healthier options, the effective management of supply chain challenges, and adapting to evolving regulatory landscapes. Furthermore, technological advancements in dairy processing and packaging are expected to contribute to enhanced product quality, shelf life, and consumer appeal, further stimulating market expansion. The forecast period of 2025-2033 anticipates sustained, albeit moderate, growth rates reflective of the market's mature yet dynamic nature.
Dairy Products Industry Market Report: 2019-2033
This comprehensive report provides an in-depth analysis of the global dairy products industry, covering market dynamics, leading players, key trends, and future growth prospects. The study period spans from 2019 to 2033, with 2025 serving as the base and estimated year. This report is essential for industry stakeholders, investors, and businesses seeking to understand and capitalize on opportunities within this dynamic market. With a focus on key players like Inner Mongolia Yili Industrial Group Co Ltd, Nestlé SA, and Unilever PL, the report delivers actionable insights to navigate the competitive landscape. The report projects a market value of xx Million by 2033.
Dairy Products Industry Market Dynamics & Concentration
The global dairy products market, valued at xx Million in 2025, exhibits moderate concentration, with a few major players holding significant market share. The industry is characterized by continuous innovation, driven by consumer demand for healthier, more convenient, and sustainable products. Stringent regulatory frameworks concerning food safety and labeling significantly influence market dynamics. Product substitutes, such as plant-based alternatives, pose a growing challenge, impacting market share of traditional dairy products. End-user trends toward healthier lifestyles and increased consumption of dairy products in developing economies are key growth drivers. The market witnesses consistent M&A activity, with a recorded xx number of deals in the past five years. For example, the acquisition of Bellamy's Australia by China Mengniu Dairy Company Ltd demonstrates the ongoing consolidation within the sector.
- Market Concentration: Moderate, with top 10 players holding approximately xx% of the market share in 2025.
- Innovation Drivers: Consumer demand for functional dairy, organic products, and convenient formats.
- Regulatory Landscape: Stringent food safety regulations and labeling requirements across various geographies.
- Product Substitutes: Growing popularity of plant-based alternatives (e.g., almond milk, soy yogurt).
- M&A Activity: Significant M&A activity, indicating industry consolidation and expansion strategies (xx deals in the last 5 years).
Dairy Products Industry Industry Trends & Analysis
The dairy products industry is experiencing robust growth, driven by several key factors. The global market is projected to witness a CAGR of xx% during the forecast period (2025-2033). This growth is fueled by increasing disposable incomes in developing economies, rising demand for convenient and ready-to-eat dairy products, and the growing health consciousness among consumers. Technological advancements in processing and packaging are enhancing product shelf life and reducing waste. Changing consumer preferences, including increased demand for organic and specialty dairy products (e.g., Greek yogurt, artisanal cheeses), are reshaping the market landscape. Intense competition among established players and the emergence of new entrants contribute to market dynamism. Market penetration of premium dairy products continues to grow, while competition from plant-based alternatives is a significant dynamic shaping product innovation.
Leading Markets & Segments in Dairy Products Industry
The North American and European markets remain dominant in the global dairy products industry, though Asia Pacific demonstrates significant growth potential. Within distribution channels, the off-trade segment (supermarkets and convenience stores) holds the largest market share. Cow's milk accounts for the largest share within the milk category, while cheddar and mozzarella cheeses lead the cheese segment. Key drivers vary across regions:
- North America: Strong consumer demand for organic and specialty dairy products, robust retail infrastructure.
- Europe: Established dairy industry, stringent regulations, high per capita consumption.
- Asia Pacific: Rapid economic growth, increasing disposable incomes, rising demand for dairy products.
- Off-Trade: High market penetration due to widespread availability and convenient purchasing options.
- Cow's Milk: High consumer preference and established market presence.
- Cheddar & Mozzarella Cheese: High demand in various culinary applications and widespread availability.
Dairy Products Industry Product Developments
Recent product innovations focus on enhanced nutrition, convenience, and sustainability. This includes the development of fortified dairy products, lactose-free options, and products with extended shelf life. Companies are leveraging technological advancements in processing and packaging to improve product quality and reduce environmental impact. These developments aim to cater to evolving consumer preferences and enhance competitiveness in a rapidly changing market.
Key Drivers of Dairy Products Industry Growth
Several factors fuel the growth of the dairy products industry. Technological advancements in processing, packaging, and distribution enhance efficiency and product quality. Growing disposable incomes and increasing urbanization in developing countries expand the consumer base. Favorable government policies and regulations promote the growth and stability of the industry. Examples include subsidies for dairy farmers and regulations to ensure product safety and quality.
Challenges in the Dairy Products Industry Market
The dairy industry faces challenges such as fluctuating milk prices, impacting profitability. Supply chain disruptions, particularly related to transportation and logistics, create uncertainties. Intense competition from both established players and emerging brands pressures margins. Stringent environmental regulations increase operational costs for companies. The impact of these factors on profitability is currently at xx Million annually, which is estimated to increase to xx Million by 2033.
Emerging Opportunities in Dairy Products Industry
The dairy industry presents significant growth opportunities. Technological advancements in personalized nutrition and functional foods offer avenues for innovation. Strategic partnerships between dairy producers and food technology companies can unlock new product categories. Expansion into emerging markets with growing demand for dairy products represents a significant opportunity for growth.
Leading Players in the Dairy Products Industry Sector
- Inner Mongolia Yili Industrial Group Co Ltd
- Nestlé SA
- Almarai Company
- Unilever PL
- Danone SA
- Arla Foods Amba
- Dairy Farmers of America Inc
- Fonterra Co-operative Group Limited
- Gujarat Co-operative Milk Marketing Federation Ltd
- Saputo Inc
- Groupe Lactalis
- China Mengniu Dairy Company Ltd
Key Milestones in Dairy Products Industry Industry
- September 2023: China Mengniu acquired Bellamy's Australia for USD 1 billion, expanding its presence in the infant formula market.
- October 2022: Unilever partnered with ASAP for ice cream distribution, enhancing its e-commerce reach.
- August 2022: Dairy Farmers of America acquired SmithFoods' shelf-extended facilities, aiming to capitalize on the growing demand for longer-lasting products.
Strategic Outlook for Dairy Products Industry Market
The dairy products industry is poised for continued growth, driven by innovation, evolving consumer preferences, and expansion into new markets. Strategic partnerships, investments in technology, and a focus on sustainability will be crucial for success. Companies that successfully adapt to changing consumer demands and leverage technological advancements will be well-positioned to capture significant market share in the years to come.
Dairy Products Industry Segmentation
-
1. Category
-
1.1. Butter
-
1.1.1. By Product Type
- 1.1.1.1. Cultured Butter
- 1.1.1.2. Uncultured Butter
-
1.1.1. By Product Type
-
1.2. Cheese
- 1.2.1. Natural Cheese
- 1.2.2. Processed Cheese
-
1.3. Cream
- 1.3.1. Double Cream
- 1.3.2. Single Cream
- 1.3.3. Whipping Cream
- 1.3.4. Others
-
1.4. Dairy Desserts
- 1.4.1. Cheesecakes
- 1.4.2. Frozen Desserts
- 1.4.3. Ice Cream
- 1.4.4. Mousses
-
1.5. Milk
- 1.5.1. Condensed milk
- 1.5.2. Flavored Milk
- 1.5.3. Fresh Milk
- 1.5.4. Powdered Milk
- 1.5.5. UHT Milk
- 1.6. Sour Milk Drinks
-
1.7. Yogurt
- 1.7.1. Flavored Yogurt
- 1.7.2. Unflavored Yogurt
-
1.1. Butter
-
2. Distribution Channel
-
2.1. Off-Trade
- 2.1.1. Convenience Stores
- 2.1.2. Online Retail
- 2.1.3. Specialist Retailers
- 2.1.4. Supermarkets and Hypermarkets
- 2.1.5. Others (Warehouse clubs, gas stations, etc.)
- 2.2. On-Trade
-
2.1. Off-Trade
Dairy Products Industry Segmentation By Geography
-
1. North America
- 1.1. United States
- 1.2. Canada
- 1.3. Mexico
-
2. South America
- 2.1. Brazil
- 2.2. Argentina
- 2.3. Rest of South America
-
3. Europe
- 3.1. United Kingdom
- 3.2. Germany
- 3.3. France
- 3.4. Italy
- 3.5. Spain
- 3.6. Russia
- 3.7. Benelux
- 3.8. Nordics
- 3.9. Rest of Europe
-
4. Middle East & Africa
- 4.1. Turkey
- 4.2. Israel
- 4.3. GCC
- 4.4. North Africa
- 4.5. South Africa
- 4.6. Rest of Middle East & Africa
-
5. Asia Pacific
- 5.1. China
- 5.2. India
- 5.3. Japan
- 5.4. South Korea
- 5.5. ASEAN
- 5.6. Oceania
- 5.7. Rest of Asia Pacific
Dairy Products Industry REPORT HIGHLIGHTS
| Aspects | Details |
|---|---|
| Study Period | 2019-2033 |
| Base Year | 2024 |
| Estimated Year | 2025 |
| Forecast Period | 2025-2033 |
| Historical Period | 2019-2024 |
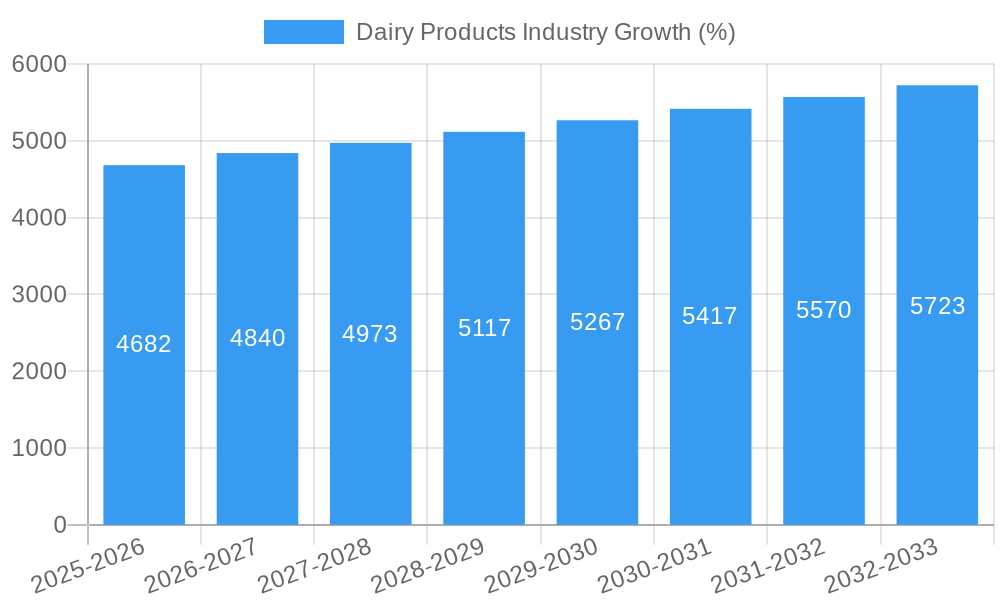
| Growth Rate | CAGR of 3.44% from 2019-2033 |
| Segmentation |
|
Table of Contents
- 1. Introduction
- 1.1. Research Scope
- 1.2. Market Segmentation
- 1.3. Research Methodology
- 1.4. Definitions and Assumptions
- 2. Executive Summary
- 2.1. Introduction
- 3. Market Dynamics
- 3.1. Introduction
- 3.2. Market Drivers
- 3.2.1. Rising Demand for Clean Label Food & Beverage Products; Rising Demand for Dairy Products
- 3.3. Market Restrains
- 3.3.1. Presence of Preservatives in Ready Meals may Hamper the Market Growth
- 3.4. Market Trends
- 3.4.1. OTHER KEY INDUSTRY TRENDS COVERED IN THE REPORT
- 4. Market Factor Analysis
- 4.1. Porters Five Forces
- 4.2. Supply/Value Chain
- 4.3. PESTEL analysis
- 4.4. Market Entropy
- 4.5. Patent/Trademark Analysis
- 5. Global Dairy Products Industry Analysis, Insights and Forecast, 2019-2031
- 5.1. Market Analysis, Insights and Forecast - by Category
- 5.1.1. Butter
- 5.1.1.1. By Product Type
- 5.1.1.1.1. Cultured Butter
- 5.1.1.1.2. Uncultured Butter
- 5.1.1.1. By Product Type
- 5.1.2. Cheese
- 5.1.2.1. Natural Cheese
- 5.1.2.2. Processed Cheese
- 5.1.3. Cream
- 5.1.3.1. Double Cream
- 5.1.3.2. Single Cream
- 5.1.3.3. Whipping Cream
- 5.1.3.4. Others
- 5.1.4. Dairy Desserts
- 5.1.4.1. Cheesecakes
- 5.1.4.2. Frozen Desserts
- 5.1.4.3. Ice Cream
- 5.1.4.4. Mousses
- 5.1.5. Milk
- 5.1.5.1. Condensed milk
- 5.1.5.2. Flavored Milk
- 5.1.5.3. Fresh Milk
- 5.1.5.4. Powdered Milk
- 5.1.5.5. UHT Milk
- 5.1.6. Sour Milk Drinks
- 5.1.7. Yogurt
- 5.1.7.1. Flavored Yogurt
- 5.1.7.2. Unflavored Yogurt
- 5.1.1. Butter
- 5.2. Market Analysis, Insights and Forecast - by Distribution Channel
- 5.2.1. Off-Trade
- 5.2.1.1. Convenience Stores
- 5.2.1.2. Online Retail
- 5.2.1.3. Specialist Retailers
- 5.2.1.4. Supermarkets and Hypermarkets
- 5.2.1.5. Others (Warehouse clubs, gas stations, etc.)
- 5.2.2. On-Trade
- 5.2.1. Off-Trade
- 5.3. Market Analysis, Insights and Forecast - by Region
- 5.3.1. North America
- 5.3.2. South America
- 5.3.3. Europe
- 5.3.4. Middle East & Africa
- 5.3.5. Asia Pacific
- 5.1. Market Analysis, Insights and Forecast - by Category
- 6. North America Dairy Products Industry Analysis, Insights and Forecast, 2019-2031
- 6.1. Market Analysis, Insights and Forecast - by Category
- 6.1.1. Butter
- 6.1.1.1. By Product Type
- 6.1.1.1.1. Cultured Butter
- 6.1.1.1.2. Uncultured Butter
- 6.1.1.1. By Product Type
- 6.1.2. Cheese
- 6.1.2.1. Natural Cheese
- 6.1.2.2. Processed Cheese
- 6.1.3. Cream
- 6.1.3.1. Double Cream
- 6.1.3.2. Single Cream
- 6.1.3.3. Whipping Cream
- 6.1.3.4. Others
- 6.1.4. Dairy Desserts
- 6.1.4.1. Cheesecakes
- 6.1.4.2. Frozen Desserts
- 6.1.4.3. Ice Cream
- 6.1.4.4. Mousses
- 6.1.5. Milk
- 6.1.5.1. Condensed milk
- 6.1.5.2. Flavored Milk
- 6.1.5.3. Fresh Milk
- 6.1.5.4. Powdered Milk
- 6.1.5.5. UHT Milk
- 6.1.6. Sour Milk Drinks
- 6.1.7. Yogurt
- 6.1.7.1. Flavored Yogurt
- 6.1.7.2. Unflavored Yogurt
- 6.1.1. Butter
- 6.2. Market Analysis, Insights and Forecast - by Distribution Channel
- 6.2.1. Off-Trade
- 6.2.1.1. Convenience Stores
- 6.2.1.2. Online Retail
- 6.2.1.3. Specialist Retailers
- 6.2.1.4. Supermarkets and Hypermarkets
- 6.2.1.5. Others (Warehouse clubs, gas stations, etc.)
- 6.2.2. On-Trade
- 6.2.1. Off-Trade
- 6.1. Market Analysis, Insights and Forecast - by Category
- 7. South America Dairy Products Industry Analysis, Insights and Forecast, 2019-2031
- 7.1. Market Analysis, Insights and Forecast - by Category
- 7.1.1. Butter
- 7.1.1.1. By Product Type
- 7.1.1.1.1. Cultured Butter
- 7.1.1.1.2. Uncultured Butter
- 7.1.1.1. By Product Type
- 7.1.2. Cheese
- 7.1.2.1. Natural Cheese
- 7.1.2.2. Processed Cheese
- 7.1.3. Cream
- 7.1.3.1. Double Cream
- 7.1.3.2. Single Cream
- 7.1.3.3. Whipping Cream
- 7.1.3.4. Others
- 7.1.4. Dairy Desserts
- 7.1.4.1. Cheesecakes
- 7.1.4.2. Frozen Desserts
- 7.1.4.3. Ice Cream
- 7.1.4.4. Mousses
- 7.1.5. Milk
- 7.1.5.1. Condensed milk
- 7.1.5.2. Flavored Milk
- 7.1.5.3. Fresh Milk
- 7.1.5.4. Powdered Milk
- 7.1.5.5. UHT Milk
- 7.1.6. Sour Milk Drinks
- 7.1.7. Yogurt
- 7.1.7.1. Flavored Yogurt
- 7.1.7.2. Unflavored Yogurt
- 7.1.1. Butter
- 7.2. Market Analysis, Insights and Forecast - by Distribution Channel
- 7.2.1. Off-Trade
- 7.2.1.1. Convenience Stores
- 7.2.1.2. Online Retail
- 7.2.1.3. Specialist Retailers
- 7.2.1.4. Supermarkets and Hypermarkets
- 7.2.1.5. Others (Warehouse clubs, gas stations, etc.)
- 7.2.2. On-Trade
- 7.2.1. Off-Trade
- 7.1. Market Analysis, Insights and Forecast - by Category
- 8. Europe Dairy Products Industry Analysis, Insights and Forecast, 2019-2031
- 8.1. Market Analysis, Insights and Forecast - by Category
- 8.1.1. Butter
- 8.1.1.1. By Product Type
- 8.1.1.1.1. Cultured Butter
- 8.1.1.1.2. Uncultured Butter
- 8.1.1.1. By Product Type
- 8.1.2. Cheese
- 8.1.2.1. Natural Cheese
- 8.1.2.2. Processed Cheese
- 8.1.3. Cream
- 8.1.3.1. Double Cream
- 8.1.3.2. Single Cream
- 8.1.3.3. Whipping Cream
- 8.1.3.4. Others
- 8.1.4. Dairy Desserts
- 8.1.4.1. Cheesecakes
- 8.1.4.2. Frozen Desserts
- 8.1.4.3. Ice Cream
- 8.1.4.4. Mousses
- 8.1.5. Milk
- 8.1.5.1. Condensed milk
- 8.1.5.2. Flavored Milk
- 8.1.5.3. Fresh Milk
- 8.1.5.4. Powdered Milk
- 8.1.5.5. UHT Milk
- 8.1.6. Sour Milk Drinks
- 8.1.7. Yogurt
- 8.1.7.1. Flavored Yogurt
- 8.1.7.2. Unflavored Yogurt
- 8.1.1. Butter
- 8.2. Market Analysis, Insights and Forecast - by Distribution Channel
- 8.2.1. Off-Trade
- 8.2.1.1. Convenience Stores
- 8.2.1.2. Online Retail
- 8.2.1.3. Specialist Retailers
- 8.2.1.4. Supermarkets and Hypermarkets
- 8.2.1.5. Others (Warehouse clubs, gas stations, etc.)
- 8.2.2. On-Trade
- 8.2.1. Off-Trade
- 8.1. Market Analysis, Insights and Forecast - by Category
- 9. Middle East & Africa Dairy Products Industry Analysis, Insights and Forecast, 2019-2031
- 9.1. Market Analysis, Insights and Forecast - by Category
- 9.1.1. Butter
- 9.1.1.1. By Product Type
- 9.1.1.1.1. Cultured Butter
- 9.1.1.1.2. Uncultured Butter
- 9.1.1.1. By Product Type
- 9.1.2. Cheese
- 9.1.2.1. Natural Cheese
- 9.1.2.2. Processed Cheese
- 9.1.3. Cream
- 9.1.3.1. Double Cream
- 9.1.3.2. Single Cream
- 9.1.3.3. Whipping Cream
- 9.1.3.4. Others
- 9.1.4. Dairy Desserts
- 9.1.4.1. Cheesecakes
- 9.1.4.2. Frozen Desserts
- 9.1.4.3. Ice Cream
- 9.1.4.4. Mousses
- 9.1.5. Milk
- 9.1.5.1. Condensed milk
- 9.1.5.2. Flavored Milk
- 9.1.5.3. Fresh Milk
- 9.1.5.4. Powdered Milk
- 9.1.5.5. UHT Milk
- 9.1.6. Sour Milk Drinks
- 9.1.7. Yogurt
- 9.1.7.1. Flavored Yogurt
- 9.1.7.2. Unflavored Yogurt
- 9.1.1. Butter
- 9.2. Market Analysis, Insights and Forecast - by Distribution Channel
- 9.2.1. Off-Trade
- 9.2.1.1. Convenience Stores
- 9.2.1.2. Online Retail
- 9.2.1.3. Specialist Retailers
- 9.2.1.4. Supermarkets and Hypermarkets
- 9.2.1.5. Others (Warehouse clubs, gas stations, etc.)
- 9.2.2. On-Trade
- 9.2.1. Off-Trade
- 9.1. Market Analysis, Insights and Forecast - by Category
- 10. Asia Pacific Dairy Products Industry Analysis, Insights and Forecast, 2019-2031
- 10.1. Market Analysis, Insights and Forecast - by Category
- 10.1.1. Butter
- 10.1.1.1. By Product Type
- 10.1.1.1.1. Cultured Butter
- 10.1.1.1.2. Uncultured Butter
- 10.1.1.1. By Product Type
- 10.1.2. Cheese
- 10.1.2.1. Natural Cheese
- 10.1.2.2. Processed Cheese
- 10.1.3. Cream
- 10.1.3.1. Double Cream
- 10.1.3.2. Single Cream
- 10.1.3.3. Whipping Cream
- 10.1.3.4. Others
- 10.1.4. Dairy Desserts
- 10.1.4.1. Cheesecakes
- 10.1.4.2. Frozen Desserts
- 10.1.4.3. Ice Cream
- 10.1.4.4. Mousses
- 10.1.5. Milk
- 10.1.5.1. Condensed milk
- 10.1.5.2. Flavored Milk
- 10.1.5.3. Fresh Milk
- 10.1.5.4. Powdered Milk
- 10.1.5.5. UHT Milk
- 10.1.6. Sour Milk Drinks
- 10.1.7. Yogurt
- 10.1.7.1. Flavored Yogurt
- 10.1.7.2. Unflavored Yogurt
- 10.1.1. Butter
- 10.2. Market Analysis, Insights and Forecast - by Distribution Channel
- 10.2.1. Off-Trade
- 10.2.1.1. Convenience Stores
- 10.2.1.2. Online Retail
- 10.2.1.3. Specialist Retailers
- 10.2.1.4. Supermarkets and Hypermarkets
- 10.2.1.5. Others (Warehouse clubs, gas stations, etc.)
- 10.2.2. On-Trade
- 10.2.1. Off-Trade
- 10.1. Market Analysis, Insights and Forecast - by Category
- 11. North America Dairy Products Industry Analysis, Insights and Forecast, 2019-2031
- 11.1. Market Analysis, Insights and Forecast - By Country/Sub-region
- 11.1.1 United States
- 11.1.2 Canada
- 11.1.3 Mexico
- 12. South America Dairy Products Industry Analysis, Insights and Forecast, 2019-2031
- 12.1. Market Analysis, Insights and Forecast - By Country/Sub-region
- 12.1.1 Brazil
- 12.1.2 Argentina
- 12.1.3 Rest of South America
- 13. Europe Dairy Products Industry Analysis, Insights and Forecast, 2019-2031
- 13.1. Market Analysis, Insights and Forecast - By Country/Sub-region
- 13.1.1 Germany
- 13.1.2 France
- 13.1.3 Italy
- 13.1.4 United Kingdom
- 13.1.5 Netherlands
- 13.1.6 Rest of Europe
- 14. Asia Pacific Dairy Products Industry Analysis, Insights and Forecast, 2019-2031
- 14.1. Market Analysis, Insights and Forecast - By Country/Sub-region
- 14.1.1 China
- 14.1.2 Japan
- 14.1.3 India
- 14.1.4 South Korea
- 14.1.5 Taiwan
- 14.1.6 Australia
- 14.1.7 Rest of Asia-Pacific
- 15. Middle East & Africa Dairy Products Industry Analysis, Insights and Forecast, 2019-2031
- 15.1. Market Analysis, Insights and Forecast - By Country/Sub-region
- 15.1.1 UAE
- 15.1.2 South Africa
- 15.1.3 Saudi Arabia
- 15.1.4 Rest of MEA
- 16. Competitive Analysis
- 16.1. Global Market Share Analysis 2024
- 16.2. Company Profiles
- 16.2.1 Inner Mongolia Yili Industrial Group Co Ltd
- 16.2.1.1. Overview
- 16.2.1.2. Products
- 16.2.1.3. SWOT Analysis
- 16.2.1.4. Recent Developments
- 16.2.1.5. Financials (Based on Availability)
- 16.2.2 Nestlé SA
- 16.2.2.1. Overview
- 16.2.2.2. Products
- 16.2.2.3. SWOT Analysis
- 16.2.2.4. Recent Developments
- 16.2.2.5. Financials (Based on Availability)
- 16.2.3 Almarai Company
- 16.2.3.1. Overview
- 16.2.3.2. Products
- 16.2.3.3. SWOT Analysis
- 16.2.3.4. Recent Developments
- 16.2.3.5. Financials (Based on Availability)
- 16.2.4 Unilever PL
- 16.2.4.1. Overview
- 16.2.4.2. Products
- 16.2.4.3. SWOT Analysis
- 16.2.4.4. Recent Developments
- 16.2.4.5. Financials (Based on Availability)
- 16.2.5 Danone SA
- 16.2.5.1. Overview
- 16.2.5.2. Products
- 16.2.5.3. SWOT Analysis
- 16.2.5.4. Recent Developments
- 16.2.5.5. Financials (Based on Availability)
- 16.2.6 Arla Foods Amba
- 16.2.6.1. Overview
- 16.2.6.2. Products
- 16.2.6.3. SWOT Analysis
- 16.2.6.4. Recent Developments
- 16.2.6.5. Financials (Based on Availability)
- 16.2.7 Dairy Farmers of America Inc
- 16.2.7.1. Overview
- 16.2.7.2. Products
- 16.2.7.3. SWOT Analysis
- 16.2.7.4. Recent Developments
- 16.2.7.5. Financials (Based on Availability)
- 16.2.8 Fonterra Co-operative Group Limited
- 16.2.8.1. Overview
- 16.2.8.2. Products
- 16.2.8.3. SWOT Analysis
- 16.2.8.4. Recent Developments
- 16.2.8.5. Financials (Based on Availability)
- 16.2.9 Gujarat Co-operative Milk Marketing Federation Ltd
- 16.2.9.1. Overview
- 16.2.9.2. Products
- 16.2.9.3. SWOT Analysis
- 16.2.9.4. Recent Developments
- 16.2.9.5. Financials (Based on Availability)
- 16.2.10 Saputo Inc
- 16.2.10.1. Overview
- 16.2.10.2. Products
- 16.2.10.3. SWOT Analysis
- 16.2.10.4. Recent Developments
- 16.2.10.5. Financials (Based on Availability)
- 16.2.11 Groupe Lactalis
- 16.2.11.1. Overview
- 16.2.11.2. Products
- 16.2.11.3. SWOT Analysis
- 16.2.11.4. Recent Developments
- 16.2.11.5. Financials (Based on Availability)
- 16.2.12 China Mengniu Dairy Company Ltd
- 16.2.12.1. Overview
- 16.2.12.2. Products
- 16.2.12.3. SWOT Analysis
- 16.2.12.4. Recent Developments
- 16.2.12.5. Financials (Based on Availability)
- 16.2.1 Inner Mongolia Yili Industrial Group Co Ltd
List of Figures
- Figure 1: Global Dairy Products Industry Revenue Breakdown (Million, %) by Region 2024 & 2032
- Figure 2: North America Dairy Products Industry Revenue (Million), by Country 2024 & 2032
- Figure 3: North America Dairy Products Industry Revenue Share (%), by Country 2024 & 2032
- Figure 4: South America Dairy Products Industry Revenue (Million), by Country 2024 & 2032
- Figure 5: South America Dairy Products Industry Revenue Share (%), by Country 2024 & 2032
- Figure 6: Europe Dairy Products Industry Revenue (Million), by Country 2024 & 2032
- Figure 7: Europe Dairy Products Industry Revenue Share (%), by Country 2024 & 2032
- Figure 8: Asia Pacific Dairy Products Industry Revenue (Million), by Country 2024 & 2032
- Figure 9: Asia Pacific Dairy Products Industry Revenue Share (%), by Country 2024 & 2032
- Figure 10: Middle East & Africa Dairy Products Industry Revenue (Million), by Country 2024 & 2032
- Figure 11: Middle East & Africa Dairy Products Industry Revenue Share (%), by Country 2024 & 2032
- Figure 12: North America Dairy Products Industry Revenue (Million), by Category 2024 & 2032
- Figure 13: North America Dairy Products Industry Revenue Share (%), by Category 2024 & 2032
- Figure 14: North America Dairy Products Industry Revenue (Million), by Distribution Channel 2024 & 2032
- Figure 15: North America Dairy Products Industry Revenue Share (%), by Distribution Channel 2024 & 2032
- Figure 16: North America Dairy Products Industry Revenue (Million), by Country 2024 & 2032
- Figure 17: North America Dairy Products Industry Revenue Share (%), by Country 2024 & 2032
- Figure 18: South America Dairy Products Industry Revenue (Million), by Category 2024 & 2032
- Figure 19: South America Dairy Products Industry Revenue Share (%), by Category 2024 & 2032
- Figure 20: South America Dairy Products Industry Revenue (Million), by Distribution Channel 2024 & 2032
- Figure 21: South America Dairy Products Industry Revenue Share (%), by Distribution Channel 2024 & 2032
- Figure 22: South America Dairy Products Industry Revenue (Million), by Country 2024 & 2032
- Figure 23: South America Dairy Products Industry Revenue Share (%), by Country 2024 & 2032
- Figure 24: Europe Dairy Products Industry Revenue (Million), by Category 2024 & 2032
- Figure 25: Europe Dairy Products Industry Revenue Share (%), by Category 2024 & 2032
- Figure 26: Europe Dairy Products Industry Revenue (Million), by Distribution Channel 2024 & 2032
- Figure 27: Europe Dairy Products Industry Revenue Share (%), by Distribution Channel 2024 & 2032
- Figure 28: Europe Dairy Products Industry Revenue (Million), by Country 2024 & 2032
- Figure 29: Europe Dairy Products Industry Revenue Share (%), by Country 2024 & 2032
- Figure 30: Middle East & Africa Dairy Products Industry Revenue (Million), by Category 2024 & 2032
- Figure 31: Middle East & Africa Dairy Products Industry Revenue Share (%), by Category 2024 & 2032
- Figure 32: Middle East & Africa Dairy Products Industry Revenue (Million), by Distribution Channel 2024 & 2032
- Figure 33: Middle East & Africa Dairy Products Industry Revenue Share (%), by Distribution Channel 2024 & 2032
- Figure 34: Middle East & Africa Dairy Products Industry Revenue (Million), by Country 2024 & 2032
- Figure 35: Middle East & Africa Dairy Products Industry Revenue Share (%), by Country 2024 & 2032
- Figure 36: Asia Pacific Dairy Products Industry Revenue (Million), by Category 2024 & 2032
- Figure 37: Asia Pacific Dairy Products Industry Revenue Share (%), by Category 2024 & 2032
- Figure 38: Asia Pacific Dairy Products Industry Revenue (Million), by Distribution Channel 2024 & 2032
- Figure 39: Asia Pacific Dairy Products Industry Revenue Share (%), by Distribution Channel 2024 & 2032
- Figure 40: Asia Pacific Dairy Products Industry Revenue (Million), by Country 2024 & 2032
- Figure 41: Asia Pacific Dairy Products Industry Revenue Share (%), by Country 2024 & 2032
List of Tables
- Table 1: Global Dairy Products Industry Revenue Million Forecast, by Region 2019 & 2032
- Table 2: Global Dairy Products Industry Revenue Million Forecast, by Category 2019 & 2032
- Table 3: Global Dairy Products Industry Revenue Million Forecast, by Distribution Channel 2019 & 2032
- Table 4: Global Dairy Products Industry Revenue Million Forecast, by Region 2019 & 2032
- Table 5: Global Dairy Products Industry Revenue Million Forecast, by Country 2019 & 2032
- Table 6: United States Dairy Products Industry Revenue (Million) Forecast, by Application 2019 & 2032
- Table 7: Canada Dairy Products Industry Revenue (Million) Forecast, by Application 2019 & 2032
- Table 8: Mexico Dairy Products Industry Revenue (Million) Forecast, by Application 2019 & 2032
- Table 9: Global Dairy Products Industry Revenue Million Forecast, by Country 2019 & 2032
- Table 10: Brazil Dairy Products Industry Revenue (Million) Forecast, by Application 2019 & 2032
- Table 11: Argentina Dairy Products Industry Revenue (Million) Forecast, by Application 2019 & 2032
- Table 12: Rest of South America Dairy Products Industry Revenue (Million) Forecast, by Application 2019 & 2032
- Table 13: Global Dairy Products Industry Revenue Million Forecast, by Country 2019 & 2032
- Table 14: Germany Dairy Products Industry Revenue (Million) Forecast, by Application 2019 & 2032
- Table 15: France Dairy Products Industry Revenue (Million) Forecast, by Application 2019 & 2032
- Table 16: Italy Dairy Products Industry Revenue (Million) Forecast, by Application 2019 & 2032
- Table 17: United Kingdom Dairy Products Industry Revenue (Million) Forecast, by Application 2019 & 2032
- Table 18: Netherlands Dairy Products Industry Revenue (Million) Forecast, by Application 2019 & 2032
- Table 19: Rest of Europe Dairy Products Industry Revenue (Million) Forecast, by Application 2019 & 2032
- Table 20: Global Dairy Products Industry Revenue Million Forecast, by Country 2019 & 2032
- Table 21: China Dairy Products Industry Revenue (Million) Forecast, by Application 2019 & 2032
- Table 22: Japan Dairy Products Industry Revenue (Million) Forecast, by Application 2019 & 2032
- Table 23: India Dairy Products Industry Revenue (Million) Forecast, by Application 2019 & 2032
- Table 24: South Korea Dairy Products Industry Revenue (Million) Forecast, by Application 2019 & 2032
- Table 25: Taiwan Dairy Products Industry Revenue (Million) Forecast, by Application 2019 & 2032
- Table 26: Australia Dairy Products Industry Revenue (Million) Forecast, by Application 2019 & 2032
- Table 27: Rest of Asia-Pacific Dairy Products Industry Revenue (Million) Forecast, by Application 2019 & 2032
- Table 28: Global Dairy Products Industry Revenue Million Forecast, by Country 2019 & 2032
- Table 29: UAE Dairy Products Industry Revenue (Million) Forecast, by Application 2019 & 2032
- Table 30: South Africa Dairy Products Industry Revenue (Million) Forecast, by Application 2019 & 2032
- Table 31: Saudi Arabia Dairy Products Industry Revenue (Million) Forecast, by Application 2019 & 2032
- Table 32: Rest of MEA Dairy Products Industry Revenue (Million) Forecast, by Application 2019 & 2032
- Table 33: Global Dairy Products Industry Revenue Million Forecast, by Category 2019 & 2032
- Table 34: Global Dairy Products Industry Revenue Million Forecast, by Distribution Channel 2019 & 2032
- Table 35: Global Dairy Products Industry Revenue Million Forecast, by Country 2019 & 2032
- Table 36: United States Dairy Products Industry Revenue (Million) Forecast, by Application 2019 & 2032
- Table 37: Canada Dairy Products Industry Revenue (Million) Forecast, by Application 2019 & 2032
- Table 38: Mexico Dairy Products Industry Revenue (Million) Forecast, by Application 2019 & 2032
- Table 39: Global Dairy Products Industry Revenue Million Forecast, by Category 2019 & 2032
- Table 40: Global Dairy Products Industry Revenue Million Forecast, by Distribution Channel 2019 & 2032
- Table 41: Global Dairy Products Industry Revenue Million Forecast, by Country 2019 & 2032
- Table 42: Brazil Dairy Products Industry Revenue (Million) Forecast, by Application 2019 & 2032
- Table 43: Argentina Dairy Products Industry Revenue (Million) Forecast, by Application 2019 & 2032
- Table 44: Rest of South America Dairy Products Industry Revenue (Million) Forecast, by Application 2019 & 2032
- Table 45: Global Dairy Products Industry Revenue Million Forecast, by Category 2019 & 2032
- Table 46: Global Dairy Products Industry Revenue Million Forecast, by Distribution Channel 2019 & 2032
- Table 47: Global Dairy Products Industry Revenue Million Forecast, by Country 2019 & 2032
- Table 48: United Kingdom Dairy Products Industry Revenue (Million) Forecast, by Application 2019 & 2032
- Table 49: Germany Dairy Products Industry Revenue (Million) Forecast, by Application 2019 & 2032
- Table 50: France Dairy Products Industry Revenue (Million) Forecast, by Application 2019 & 2032
- Table 51: Italy Dairy Products Industry Revenue (Million) Forecast, by Application 2019 & 2032
- Table 52: Spain Dairy Products Industry Revenue (Million) Forecast, by Application 2019 & 2032
- Table 53: Russia Dairy Products Industry Revenue (Million) Forecast, by Application 2019 & 2032
- Table 54: Benelux Dairy Products Industry Revenue (Million) Forecast, by Application 2019 & 2032
- Table 55: Nordics Dairy Products Industry Revenue (Million) Forecast, by Application 2019 & 2032
- Table 56: Rest of Europe Dairy Products Industry Revenue (Million) Forecast, by Application 2019 & 2032
- Table 57: Global Dairy Products Industry Revenue Million Forecast, by Category 2019 & 2032
- Table 58: Global Dairy Products Industry Revenue Million Forecast, by Distribution Channel 2019 & 2032
- Table 59: Global Dairy Products Industry Revenue Million Forecast, by Country 2019 & 2032
- Table 60: Turkey Dairy Products Industry Revenue (Million) Forecast, by Application 2019 & 2032
- Table 61: Israel Dairy Products Industry Revenue (Million) Forecast, by Application 2019 & 2032
- Table 62: GCC Dairy Products Industry Revenue (Million) Forecast, by Application 2019 & 2032
- Table 63: North Africa Dairy Products Industry Revenue (Million) Forecast, by Application 2019 & 2032
- Table 64: South Africa Dairy Products Industry Revenue (Million) Forecast, by Application 2019 & 2032
- Table 65: Rest of Middle East & Africa Dairy Products Industry Revenue (Million) Forecast, by Application 2019 & 2032
- Table 66: Global Dairy Products Industry Revenue Million Forecast, by Category 2019 & 2032
- Table 67: Global Dairy Products Industry Revenue Million Forecast, by Distribution Channel 2019 & 2032
- Table 68: Global Dairy Products Industry Revenue Million Forecast, by Country 2019 & 2032
- Table 69: China Dairy Products Industry Revenue (Million) Forecast, by Application 2019 & 2032
- Table 70: India Dairy Products Industry Revenue (Million) Forecast, by Application 2019 & 2032
- Table 71: Japan Dairy Products Industry Revenue (Million) Forecast, by Application 2019 & 2032
- Table 72: South Korea Dairy Products Industry Revenue (Million) Forecast, by Application 2019 & 2032
- Table 73: ASEAN Dairy Products Industry Revenue (Million) Forecast, by Application 2019 & 2032
- Table 74: Oceania Dairy Products Industry Revenue (Million) Forecast, by Application 2019 & 2032
- Table 75: Rest of Asia Pacific Dairy Products Industry Revenue (Million) Forecast, by Application 2019 & 2032
Frequently Asked Questions
1. What is the projected Compound Annual Growth Rate (CAGR) of the Dairy Products Industry?
The projected CAGR is approximately 3.44%.
2. Which companies are prominent players in the Dairy Products Industry?
Key companies in the market include Inner Mongolia Yili Industrial Group Co Ltd, Nestlé SA, Almarai Company, Unilever PL, Danone SA, Arla Foods Amba, Dairy Farmers of America Inc, Fonterra Co-operative Group Limited, Gujarat Co-operative Milk Marketing Federation Ltd, Saputo Inc, Groupe Lactalis, China Mengniu Dairy Company Ltd.
3. What are the main segments of the Dairy Products Industry?
The market segments include Category, Distribution Channel.
4. Can you provide details about the market size?
The market size is estimated to be USD 131.5 Million as of 2022.
5. What are some drivers contributing to market growth?
Rising Demand for Clean Label Food & Beverage Products; Rising Demand for Dairy Products.
6. What are the notable trends driving market growth?
OTHER KEY INDUSTRY TRENDS COVERED IN THE REPORT.
7. Are there any restraints impacting market growth?
Presence of Preservatives in Ready Meals may Hamper the Market Growth.
8. Can you provide examples of recent developments in the market?
September 2023: China Mengniu acquired organic infant formula producer Bellamy's Australia for USD 1 billion.October 2022: Unilever partnered with ASAP for the distribution of its ice cream goods. As per the partnership, ASAP will also deliver ice cream and treats from Unilever's virtual storefront, The Ice Cream Shop.August 2022: Dairy Farmers of America acquired two shelf-extended facilities of SmithFoods. The strategy of this acquisition was to assist the corporation in capitalizing on the market's growing demand for products with extended shelf lives.
9. What pricing options are available for accessing the report?
Pricing options include single-user, multi-user, and enterprise licenses priced at USD 3800, USD 4500, and USD 5800 respectively.
10. Is the market size provided in terms of value or volume?
The market size is provided in terms of value, measured in Million.
11. Are there any specific market keywords associated with the report?
Yes, the market keyword associated with the report is "Dairy Products Industry," which aids in identifying and referencing the specific market segment covered.
12. How do I determine which pricing option suits my needs best?
The pricing options vary based on user requirements and access needs. Individual users may opt for single-user licenses, while businesses requiring broader access may choose multi-user or enterprise licenses for cost-effective access to the report.
13. Are there any additional resources or data provided in the Dairy Products Industry report?
While the report offers comprehensive insights, it's advisable to review the specific contents or supplementary materials provided to ascertain if additional resources or data are available.
14. How can I stay updated on further developments or reports in the Dairy Products Industry?
To stay informed about further developments, trends, and reports in the Dairy Products Industry, consider subscribing to industry newsletters, following relevant companies and organizations, or regularly checking reputable industry news sources and publications.
Methodology
Step 1 - Identification of Relevant Samples Size from Population Database


Step 2 - Approaches for Defining Global Market Size (Value, Volume* & Price*)

Note*: In applicable scenarios
Step 3 - Data Sources
Primary Research
- Web Analytics
- Survey Reports
- Research Institute
- Latest Research Reports
- Opinion Leaders
Secondary Research
- Annual Reports
- White Paper
- Latest Press Release
- Industry Association
- Paid Database
- Investor Presentations

Step 4 - Data Triangulation
Involves using different sources of information in order to increase the validity of a study
These sources are likely to be stakeholders in a program - participants, other researchers, program staff, other community members, and so on.
Then we put all data in single framework & apply various statistical tools to find out the dynamic on the market.
During the analysis stage, feedback from the stakeholder groups would be compared to determine areas of agreement as well as areas of divergence
