

Key Insights
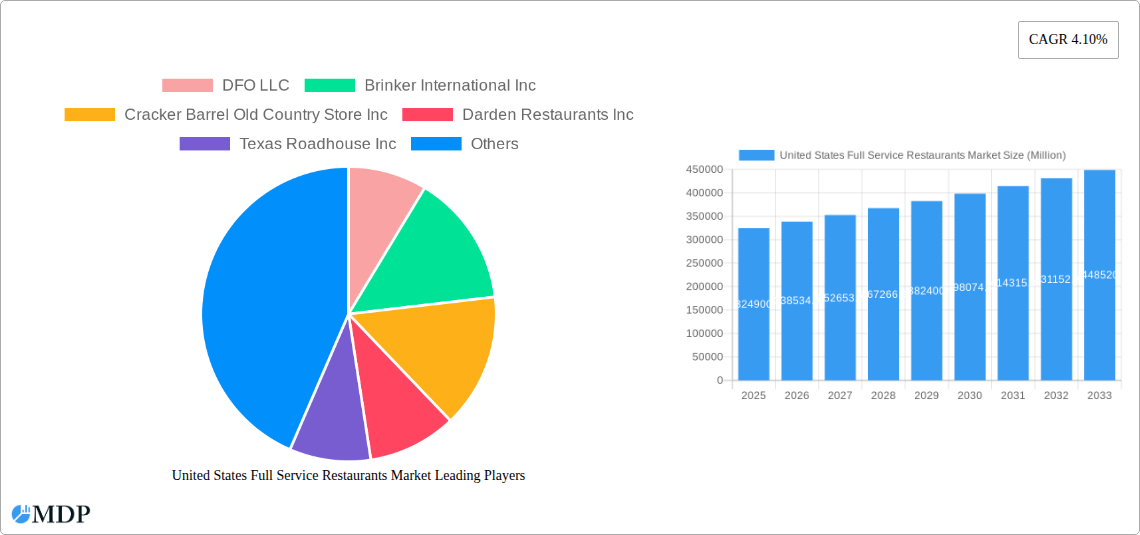
The United States Full Service Restaurant (FSR) market, valued at $324.9 billion in 2025, is projected to experience steady growth, driven by several key factors. The increasing disposable incomes and changing lifestyles among American consumers fuel demand for convenient and high-quality dining experiences. The market is segmented by cuisine type, with Asian, European, and North American cuisines holding significant market share. Growth is further fueled by evolving consumer preferences towards diverse culinary options and personalized dining experiences. The rise of casual dining concepts and the incorporation of technology, including online ordering and delivery services, contribute to market expansion. However, challenges remain, including rising food and labor costs, increased competition from fast-casual and quick-service restaurants, and the lingering effects of economic uncertainty impacting consumer spending. The market is geographically diversified across the US, with significant regional variations in preferences and spending patterns. The dominance of chained outlets is notable, reflecting economies of scale and brand recognition, yet independent outlets continue to thrive, showcasing the appeal of unique, localized dining experiences.
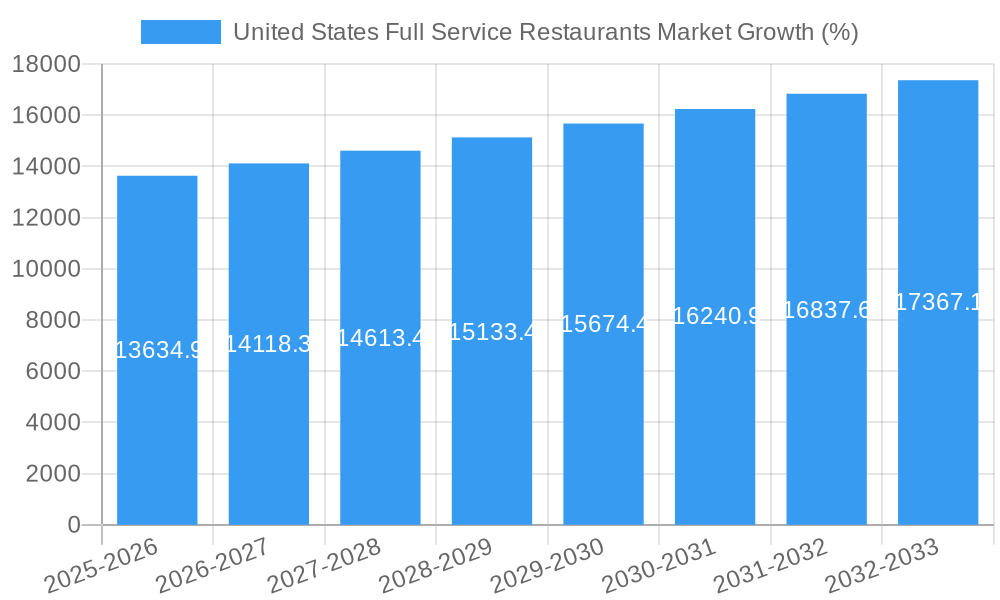
Growth within the US FSR market will likely be influenced by inflation and economic factors. A conservative projection, considering the 4.10% CAGR and potential economic headwinds, estimates a market size exceeding $400 billion by 2030. This growth will be uneven across segments. The chained outlet segment is expected to maintain a dominant position due to their established branding and operational efficiencies. However, the independent outlet segment, offering niche cuisines and personalized service, will likely see growth driven by consumer demand for unique dining experiences. Geographic concentration is expected to continue, with major metropolitan areas and tourist destinations maintaining a significant market share. Continued innovation in menu offerings, service models, and technology integration will be crucial for success within this competitive landscape. Market players will need to adapt to evolving consumer preferences and address challenges associated with rising operational costs to maintain market share and profitability.
United States Full Service Restaurants Market: A Comprehensive Report (2019-2033)
This comprehensive report offers an in-depth analysis of the United States Full Service Restaurants (FSR) market, providing invaluable insights for industry stakeholders, investors, and strategic planners. With a detailed study period spanning from 2019 to 2033 (Base Year: 2025, Estimated Year: 2025, Forecast Period: 2025-2033, Historical Period: 2019-2024), this report unveils the market's current state, future trajectory, and key players shaping its evolution. Expect detailed analysis of market size (in Millions), CAGR, and market share across various segments, allowing for informed decision-making and strategic advantage.
United States Full Service Restaurants Market Market Dynamics & Concentration
The United States FSR market, valued at xx Million in 2024, is characterized by a moderately concentrated landscape with several large chains and a multitude of independent operators. Market share is largely distributed among the top 10 players, including DFO LLC, Brinker International Inc, Cracker Barrel Old Country Store Inc, Darden Restaurants Inc, Texas Roadhouse Inc, The Cheesecake Factory Restaurants Inc, Red Lobster Hospitality LLC, Dine Brands Global Inc, Bloomin' Brands Inc, and BJ's Restaurants Inc. However, the market exhibits significant dynamism driven by several factors:
- Innovation Drivers: Technological advancements in kitchen equipment, online ordering platforms, and loyalty programs are transforming operational efficiency and customer experience.
- Regulatory Frameworks: Health and safety regulations, labor laws, and taxation policies influence operational costs and profitability. Changes in minimum wage legislation, for example, directly impact labor costs.
- Product Substitutes: The rise of fast-casual dining and meal delivery services presents competition, forcing FSRs to adapt and offer value-added services.
- End-User Trends: Shifting consumer preferences towards healthier options, personalized experiences, and sustainable practices influence menu development and marketing strategies.
- M&A Activities: The recent acquisition of Fuzzy's Taco Shop by Dine Brands Global Inc. demonstrates ongoing consolidation within the market, with an estimated xx M&A deals occurring in the last five years. This trend indicates a drive towards greater scale and efficiency. Market concentration is expected to increase further at a CAGR of xx% during the forecast period. This consolidation is driven by a desire for increased market share and economies of scale.
United States Full Service Restaurants Market Industry Trends & Analysis
The US FSR market exhibits robust growth, driven by several key factors. A rising disposable income, coupled with a growing preference for dining out, fuels market expansion. Technological disruptions, such as online ordering and delivery services, are enhancing customer convenience and driving market penetration. Changing consumer preferences towards experiential dining, personalized menus, and locally-sourced ingredients are reshaping the competitive landscape. The market is projected to witness a CAGR of xx% during the forecast period (2025-2033), reaching a value of xx Million by 2033. This growth is primarily propelled by the increasing popularity of specific cuisines, such as North American and Asian, and the expansion of chained outlets. Competitive dynamics are intense, with established players investing heavily in brand building, menu innovation, and technological upgrades to maintain market share. The market penetration of online ordering systems is also steadily increasing, with an estimated xx% of FSRs currently utilizing such technology.
Leading Markets & Segments in United States Full Service Restaurants Market
The North American cuisine segment dominates the market, followed by Asian cuisine. Chained outlets account for a significant market share due to economies of scale and brand recognition. Standalone locations remain the prevalent outlet type, offering flexibility and targeted market penetration. The leisure segment leads in terms of location type, attracting a large share of customers seeking dining experiences.
- Key Drivers:
- Economic Policies: Favorable economic conditions stimulate consumer spending, boosting demand.
- Infrastructure: Development of robust transportation networks and tourism infrastructure enhances accessibility and expands market reach.
- Technological Advancements: Online ordering, delivery platforms, and point-of-sale systems improve efficiency and customer engagement.
Detailed dominance analysis reveals the North American cuisine segment's strong performance attributed to its broad appeal and cultural significance. Similarly, chained outlets leverage brand recognition and marketing efficiency, while standalone locations offer localized customization and adaptability. The leisure segment's dominance stems from its association with social gatherings and entertainment, further emphasizing the experiential aspect of dining.
United States Full Service Restaurants Market Product Developments
Recent product innovations focus on enhancing convenience (e.g., to-go-only locations), catering to dietary preferences (e.g., vegetarian, vegan options), and personalizing the dining experience (e.g., customized meal kits). The integration of technology, such as online ordering and contactless payment systems, is also gaining momentum. These innovations reflect the market's evolving consumer needs and preferences, creating competitive advantages for businesses that are able to adapt quickly.
Key Drivers of United States Full Service Restaurants Market Growth
Several key factors are fueling the growth of the US FSR market. Increasing disposable income and urbanization are driving higher spending on dining out. Technological advancements, such as online ordering and delivery platforms, are enhancing consumer convenience, expanding market reach, and boosting efficiency. Favorable demographic trends, including a growing population and a shift towards more affluent demographics, are increasing the market's potential customer base. Lastly, government policies supporting the hospitality industry also play a role.
Challenges in the United States Full Service Restaurants Market Market
The US FSR market faces significant challenges, including rising labor costs, fluctuating food prices, stringent regulations impacting operational costs and profitability, and intense competition requiring substantial investments in marketing and technology. Supply chain disruptions also pose a risk, leading to unpredictable ingredient availability and price fluctuations. The combined impact of these challenges results in reduced profitability margins, requiring operators to implement cost-saving measures and improve operational efficiencies to stay competitive. These challenges affect the overall market size, reducing the overall growth potential and posing a threat to smaller players.
Emerging Opportunities in United States Full Service Restaurants Market
The FSR market presents several growth opportunities, such as expanding into underserved markets, leveraging technological advancements to enhance the customer experience, and catering to evolving consumer preferences (e.g., health-conscious choices, sustainability). Strategic partnerships with technology providers can improve operational efficiency and customer engagement. Exploring new and innovative cuisine concepts, and expanding into adjacent markets (e.g., ghost kitchens, meal prep services), present further opportunities for long-term market expansion and growth.
Leading Players in the United States Full Service Restaurants Market Sector
- DFO LLC
- Brinker International Inc
- Cracker Barrel Old Country Store Inc
- Darden Restaurants Inc
- Texas Roadhouse Inc
- The Cheesecake Factory Restaurants Inc
- Red Lobster Hospitality LLC
- Dine Brands Global Inc
- Bloomin' Brands Inc
- BJ's Restaurants Inc
Key Milestones in United States Full Service Restaurants Market Industry
- November 2022: Brinker International announced that its brand Chili's Grill & Bar launched its first to-go-only location nationwide, highlighting a growing trend towards convenience.
- December 2022: Dine Brands Global Inc. acquired Fuzzy's Taco Shop for USD 80 Million, signifying market consolidation and expansion of brand portfolios.
- January 2023: Applebee’s announced the return of its USD 6 Smoocho Mucho Sips, demonstrating the importance of promotional strategies in driving customer engagement and sales.
Strategic Outlook for United States Full Service Restaurants Market Market
The US FSR market offers significant long-term growth potential, driven by continued consumer spending, technological advancements, and evolving consumer preferences. Strategic opportunities exist in focusing on enhanced customer experiences, menu innovation, technology integration, and sustainable practices. Businesses that are able to adapt to changing market trends and invest in innovation will be well-positioned to capitalize on the market's future growth prospects. Market expansion into new geographical areas and the development of new dining concepts will also contribute to the sustained growth of this sector.
United States Full Service Restaurants Market Segmentation
-
1. Cuisine
- 1.1. Asian
- 1.2. European
- 1.3. Latin American
- 1.4. Middle Eastern
- 1.5. North American
- 1.6. Other FSR Cuisines
-
2. Outlet
- 2.1. Chained Outlets
- 2.2. Independent Outlets
-
3. Location
- 3.1. Leisure
- 3.2. Lodging
- 3.3. Retail
- 3.4. Standalone
- 3.5. Travel
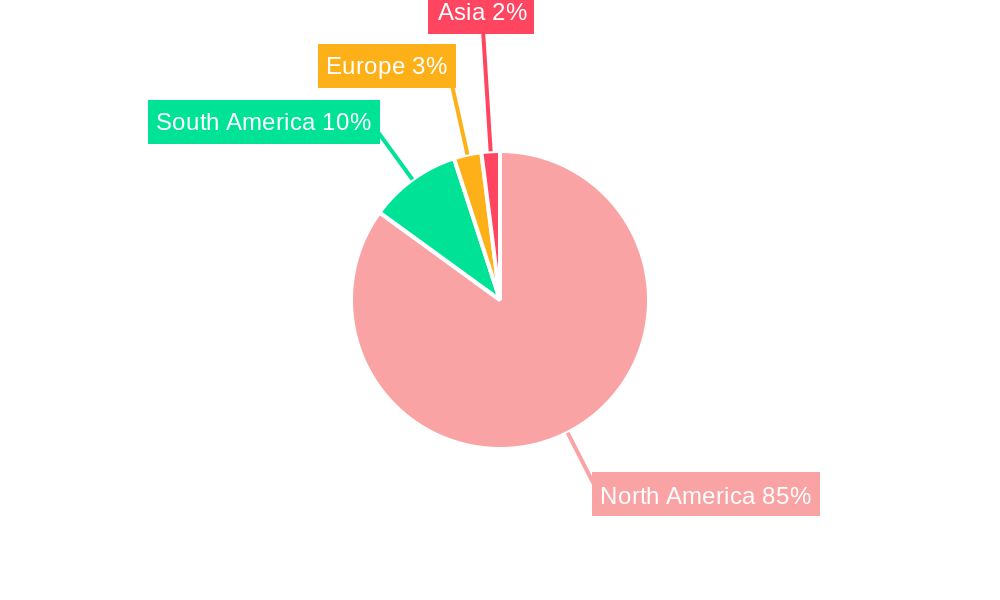
United States Full Service Restaurants Market Segmentation By Geography
- 1. United States
United States Full Service Restaurants Market REPORT HIGHLIGHTS
| Aspects | Details |
|---|---|
| Study Period | 2019-2033 |
| Base Year | 2024 |
| Estimated Year | 2025 |
| Forecast Period | 2025-2033 |
| Historical Period | 2019-2024 |
| Growth Rate | CAGR of 4.10% from 2019-2033 |
| Segmentation |
|
Table of Contents
- 1. Introduction
- 1.1. Research Scope
- 1.2. Market Segmentation
- 1.3. Research Methodology
- 1.4. Definitions and Assumptions
- 2. Executive Summary
- 2.1. Introduction
- 3. Market Dynamics
- 3.1. Introduction
- 3.2. Market Drivers
- 3.2.1. Increasing Demand for Functional and Fortified Food; Multi-functionality and Wide Application of Riboflavin
- 3.3. Market Restrains
- 3.3.1. Low Stability of Riboflavin on Exposure to Light and Heat
- 3.4. Market Trends
- 3.4.1 A significant rise in tourist arrivals is driving the market growth
- 3.4.2 capitalizing on the opportunities presented by the influx of visitors
- 4. Market Factor Analysis
- 4.1. Porters Five Forces
- 4.2. Supply/Value Chain
- 4.3. PESTEL analysis
- 4.4. Market Entropy
- 4.5. Patent/Trademark Analysis
- 5. United States Full Service Restaurants Market Analysis, Insights and Forecast, 2019-2031
- 5.1. Market Analysis, Insights and Forecast - by Cuisine
- 5.1.1. Asian
- 5.1.2. European
- 5.1.3. Latin American
- 5.1.4. Middle Eastern
- 5.1.5. North American
- 5.1.6. Other FSR Cuisines
- 5.2. Market Analysis, Insights and Forecast - by Outlet
- 5.2.1. Chained Outlets
- 5.2.2. Independent Outlets
- 5.3. Market Analysis, Insights and Forecast - by Location
- 5.3.1. Leisure
- 5.3.2. Lodging
- 5.3.3. Retail
- 5.3.4. Standalone
- 5.3.5. Travel
- 5.4. Market Analysis, Insights and Forecast - by Region
- 5.4.1. United States
- 5.1. Market Analysis, Insights and Forecast - by Cuisine
- 6. North America United States Full Service Restaurants Market Analysis, Insights and Forecast, 2019-2031
- 6.1. Market Analysis, Insights and Forecast - By Country/Sub-region
- 6.1.1 United States
- 6.1.2 Canada
- 6.1.3 Mexico
- 7. South America United States Full Service Restaurants Market Analysis, Insights and Forecast, 2019-2031
- 7.1. Market Analysis, Insights and Forecast - By Country/Sub-region
- 7.1.1 Brazil
- 7.1.2 Argentina
- 7.1.3 Rest of South America
- 8. Competitive Analysis
- 8.1. Market Share Analysis 2024
- 8.2. Company Profiles
- 8.2.1 DFO LLC
- 8.2.1.1. Overview
- 8.2.1.2. Products
- 8.2.1.3. SWOT Analysis
- 8.2.1.4. Recent Developments
- 8.2.1.5. Financials (Based on Availability)
- 8.2.2 Brinker International Inc
- 8.2.2.1. Overview
- 8.2.2.2. Products
- 8.2.2.3. SWOT Analysis
- 8.2.2.4. Recent Developments
- 8.2.2.5. Financials (Based on Availability)
- 8.2.3 Cracker Barrel Old Country Store Inc
- 8.2.3.1. Overview
- 8.2.3.2. Products
- 8.2.3.3. SWOT Analysis
- 8.2.3.4. Recent Developments
- 8.2.3.5. Financials (Based on Availability)
- 8.2.4 Darden Restaurants Inc
- 8.2.4.1. Overview
- 8.2.4.2. Products
- 8.2.4.3. SWOT Analysis
- 8.2.4.4. Recent Developments
- 8.2.4.5. Financials (Based on Availability)
- 8.2.5 Texas Roadhouse Inc
- 8.2.5.1. Overview
- 8.2.5.2. Products
- 8.2.5.3. SWOT Analysis
- 8.2.5.4. Recent Developments
- 8.2.5.5. Financials (Based on Availability)
- 8.2.6 The Cheesecake Factory Restaurants Inc
- 8.2.6.1. Overview
- 8.2.6.2. Products
- 8.2.6.3. SWOT Analysis
- 8.2.6.4. Recent Developments
- 8.2.6.5. Financials (Based on Availability)
- 8.2.7 Red Lobster Hospitality LLC
- 8.2.7.1. Overview
- 8.2.7.2. Products
- 8.2.7.3. SWOT Analysis
- 8.2.7.4. Recent Developments
- 8.2.7.5. Financials (Based on Availability)
- 8.2.8 Dine Brands Global Inc
- 8.2.8.1. Overview
- 8.2.8.2. Products
- 8.2.8.3. SWOT Analysis
- 8.2.8.4. Recent Developments
- 8.2.8.5. Financials (Based on Availability)
- 8.2.9 Bloomin' Brands Inc
- 8.2.9.1. Overview
- 8.2.9.2. Products
- 8.2.9.3. SWOT Analysis
- 8.2.9.4. Recent Developments
- 8.2.9.5. Financials (Based on Availability)
- 8.2.10 BJ's Restaurants Inc
- 8.2.10.1. Overview
- 8.2.10.2. Products
- 8.2.10.3. SWOT Analysis
- 8.2.10.4. Recent Developments
- 8.2.10.5. Financials (Based on Availability)
- 8.2.1 DFO LLC
List of Figures
- Figure 1: United States Full Service Restaurants Market Revenue Breakdown (Million, %) by Product 2024 & 2032
- Figure 2: United States Full Service Restaurants Market Share (%) by Company 2024
List of Tables
- Table 1: United States Full Service Restaurants Market Revenue Million Forecast, by Region 2019 & 2032
- Table 2: United States Full Service Restaurants Market Revenue Million Forecast, by Cuisine 2019 & 2032
- Table 3: United States Full Service Restaurants Market Revenue Million Forecast, by Outlet 2019 & 2032
- Table 4: United States Full Service Restaurants Market Revenue Million Forecast, by Location 2019 & 2032
- Table 5: United States Full Service Restaurants Market Revenue Million Forecast, by Region 2019 & 2032
- Table 6: United States Full Service Restaurants Market Revenue Million Forecast, by Country 2019 & 2032
- Table 7: United States United States Full Service Restaurants Market Revenue (Million) Forecast, by Application 2019 & 2032
- Table 8: Canada United States Full Service Restaurants Market Revenue (Million) Forecast, by Application 2019 & 2032
- Table 9: Mexico United States Full Service Restaurants Market Revenue (Million) Forecast, by Application 2019 & 2032
- Table 10: United States Full Service Restaurants Market Revenue Million Forecast, by Country 2019 & 2032
- Table 11: Brazil United States Full Service Restaurants Market Revenue (Million) Forecast, by Application 2019 & 2032
- Table 12: Argentina United States Full Service Restaurants Market Revenue (Million) Forecast, by Application 2019 & 2032
- Table 13: Rest of South America United States Full Service Restaurants Market Revenue (Million) Forecast, by Application 2019 & 2032
- Table 14: United States Full Service Restaurants Market Revenue Million Forecast, by Cuisine 2019 & 2032
- Table 15: United States Full Service Restaurants Market Revenue Million Forecast, by Outlet 2019 & 2032
- Table 16: United States Full Service Restaurants Market Revenue Million Forecast, by Location 2019 & 2032
- Table 17: United States Full Service Restaurants Market Revenue Million Forecast, by Country 2019 & 2032
Frequently Asked Questions
1. What is the projected Compound Annual Growth Rate (CAGR) of the United States Full Service Restaurants Market?
The projected CAGR is approximately 4.10%.
2. Which companies are prominent players in the United States Full Service Restaurants Market?
Key companies in the market include DFO LLC, Brinker International Inc, Cracker Barrel Old Country Store Inc, Darden Restaurants Inc, Texas Roadhouse Inc, The Cheesecake Factory Restaurants Inc, Red Lobster Hospitality LLC, Dine Brands Global Inc, Bloomin' Brands Inc, BJ's Restaurants Inc.
3. What are the main segments of the United States Full Service Restaurants Market?
The market segments include Cuisine, Outlet, Location.
4. Can you provide details about the market size?
The market size is estimated to be USD 324,900 Million as of 2022.
5. What are some drivers contributing to market growth?
Increasing Demand for Functional and Fortified Food; Multi-functionality and Wide Application of Riboflavin.
6. What are the notable trends driving market growth?
A significant rise in tourist arrivals is driving the market growth. capitalizing on the opportunities presented by the influx of visitors.
7. Are there any restraints impacting market growth?
Low Stability of Riboflavin on Exposure to Light and Heat.
8. Can you provide examples of recent developments in the market?
January 2023: Applebee’s announced the return of its USD 6 Smoocho Mucho Sips.December 2022: Dine Brands Global Inc. acquired Fuzzy's Taco Shop® ("Fuzzy's") from Experiential Brands LLC, a wholly-owned subsidiary of NRD Holding Company, for USD 80 million in cash.November 2022: Brinker International announced that its brand Chili's Grill & Bar launched its first to-go-only location nationwide.
9. What pricing options are available for accessing the report?
Pricing options include single-user, multi-user, and enterprise licenses priced at USD 3800, USD 4500, and USD 5800 respectively.
10. Is the market size provided in terms of value or volume?
The market size is provided in terms of value, measured in Million.
11. Are there any specific market keywords associated with the report?
Yes, the market keyword associated with the report is "United States Full Service Restaurants Market," which aids in identifying and referencing the specific market segment covered.
12. How do I determine which pricing option suits my needs best?
The pricing options vary based on user requirements and access needs. Individual users may opt for single-user licenses, while businesses requiring broader access may choose multi-user or enterprise licenses for cost-effective access to the report.
13. Are there any additional resources or data provided in the United States Full Service Restaurants Market report?
While the report offers comprehensive insights, it's advisable to review the specific contents or supplementary materials provided to ascertain if additional resources or data are available.
14. How can I stay updated on further developments or reports in the United States Full Service Restaurants Market?
To stay informed about further developments, trends, and reports in the United States Full Service Restaurants Market, consider subscribing to industry newsletters, following relevant companies and organizations, or regularly checking reputable industry news sources and publications.
Methodology
Step 1 - Identification of Relevant Samples Size from Population Database


Step 2 - Approaches for Defining Global Market Size (Value, Volume* & Price*)

Note*: In applicable scenarios
Step 3 - Data Sources
Primary Research
- Web Analytics
- Survey Reports
- Research Institute
- Latest Research Reports
- Opinion Leaders
Secondary Research
- Annual Reports
- White Paper
- Latest Press Release
- Industry Association
- Paid Database
- Investor Presentations

Step 4 - Data Triangulation
Involves using different sources of information in order to increase the validity of a study
These sources are likely to be stakeholders in a program - participants, other researchers, program staff, other community members, and so on.
Then we put all data in single framework & apply various statistical tools to find out the dynamic on the market.
During the analysis stage, feedback from the stakeholder groups would be compared to determine areas of agreement as well as areas of divergence
