

Key Insights
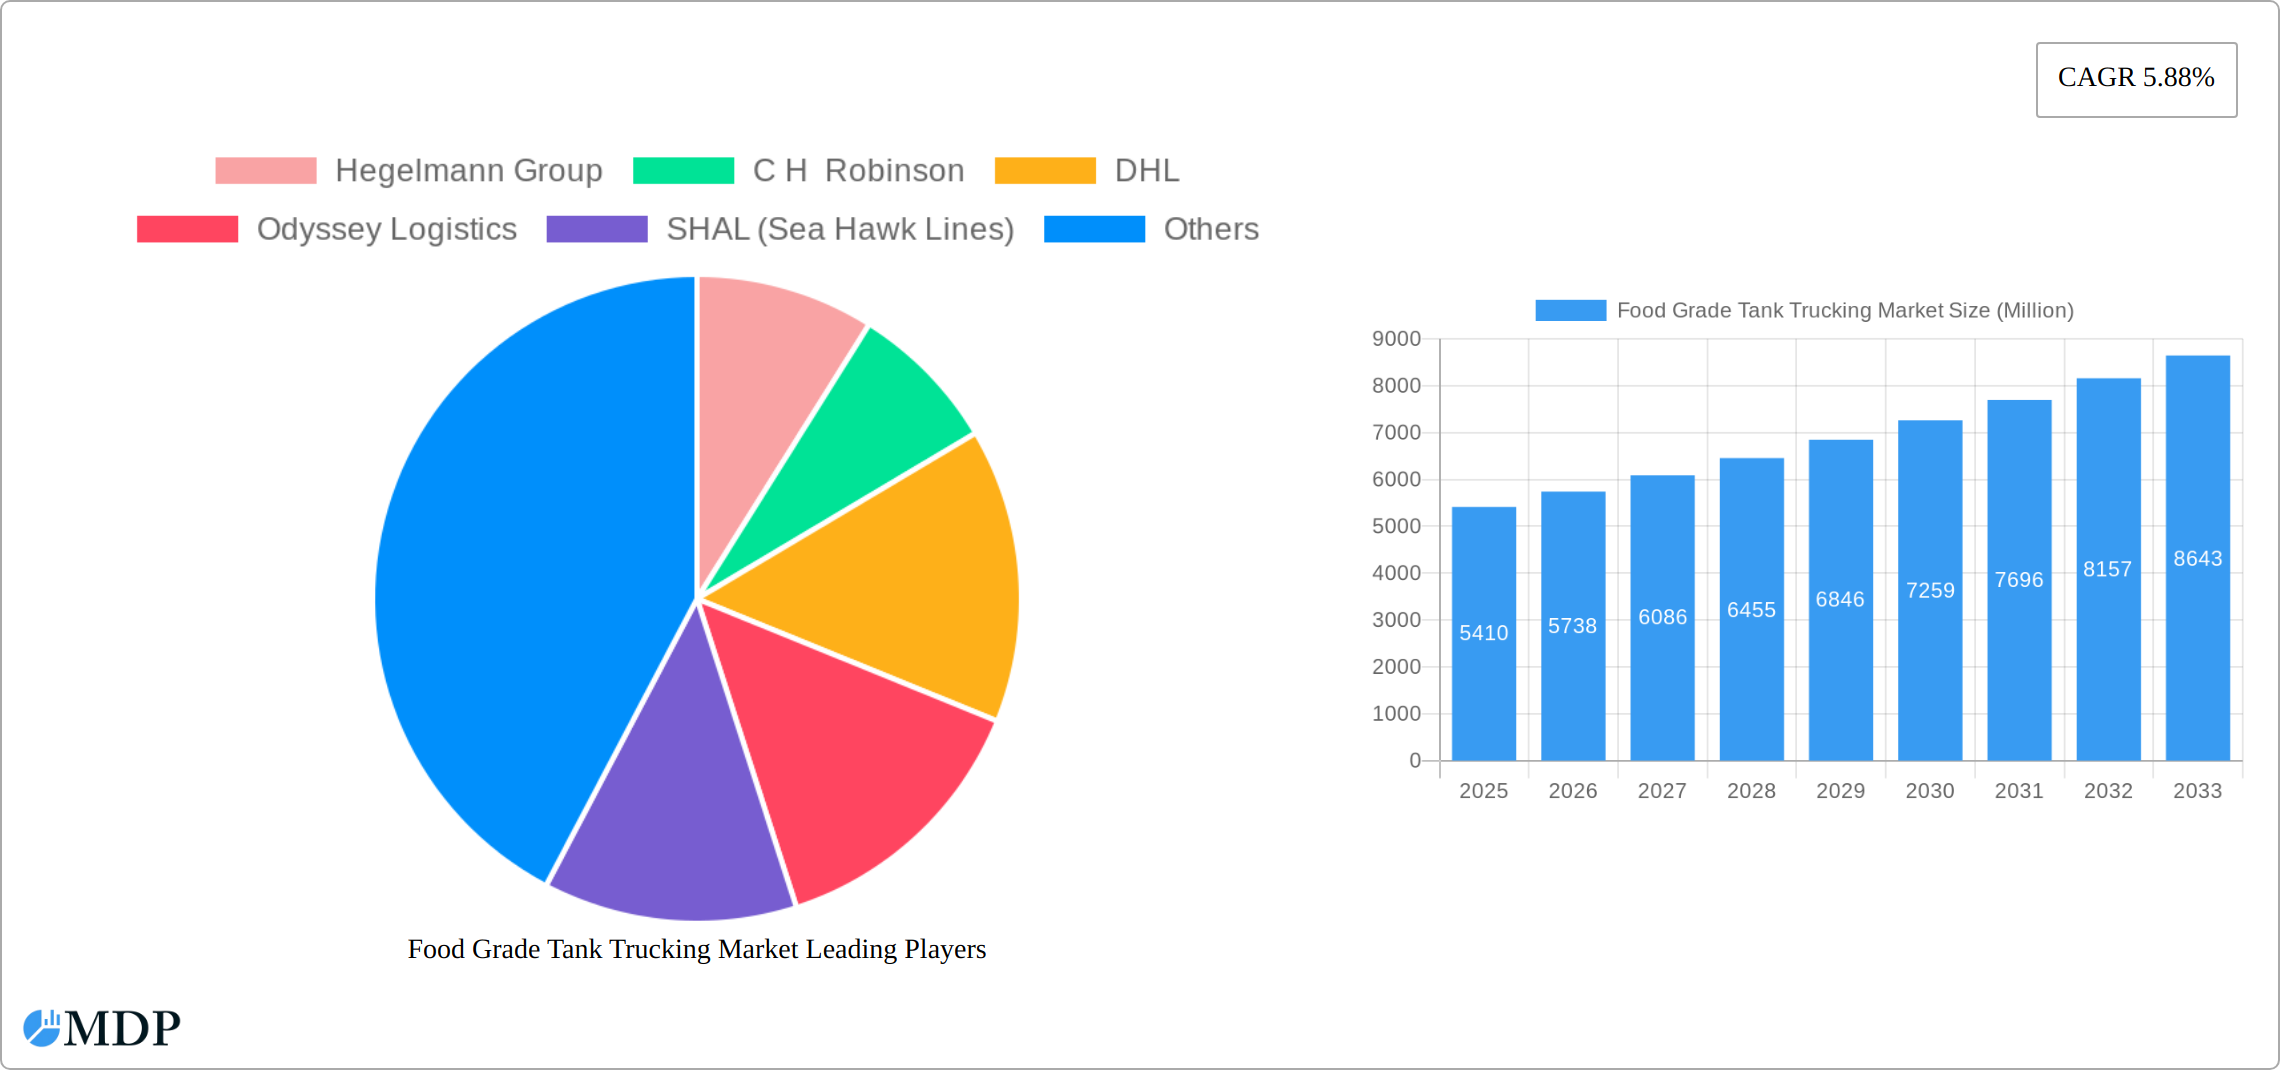
The global food grade tank trucking market, valued at $5.41 billion in 2025, is projected to experience robust growth, driven by the increasing demand for safe and efficient transportation of temperature-sensitive food products. A compound annual growth rate (CAGR) of 5.88% from 2025 to 2033 indicates a significant expansion of this market. Key drivers include the rising global population and its growing demand for processed and perishable food items, necessitating specialized transportation solutions. Furthermore, the stringent regulatory environment surrounding food safety and hygiene is pushing companies to invest in modern, food-grade compliant tank trucks and logistics services. Growth is also fuelled by the expansion of e-commerce and online grocery delivery, requiring faster and more reliable delivery networks. While increasing fuel costs and driver shortages pose challenges, technological advancements, such as improved tracking and monitoring systems, are mitigating these restraints and improving operational efficiency. Major players like Hegelmann Group, C.H. Robinson, DHL, and others are strategically investing in fleet modernization and expanding their service offerings to capture a larger market share. The market segmentation likely encompasses various vehicle types (e.g., tankers, refrigerated tankers), cargo types (e.g., dairy, beverages, edible oils), and regions (with North America and Europe likely dominating). Overall, the outlook for the food grade tank trucking market is positive, driven by consistent growth in food production and consumption globally.
The market's expansion will be influenced by evolving consumer preferences toward healthier and more convenient food options. The increasing focus on sustainable and eco-friendly transportation methods will further shape market dynamics. Companies are likely investing in fuel-efficient vehicles and adopting optimized routes to reduce their carbon footprint and meet sustainability goals. Moreover, advancements in technology and data analytics are streamlining logistics and improving supply chain visibility, leading to enhanced efficiency and reduced operational costs. The competitive landscape is characterized by both large multinational companies and specialized regional players. Strategic alliances, mergers, and acquisitions are anticipated to further consolidate the market and drive innovation. The continued growth in the food processing and manufacturing sectors directly correlates with the expansion of the food-grade tank trucking market, making it a highly attractive sector for investment and expansion.
Food Grade Tank Trucking Market: A Comprehensive Report (2019-2033)
This in-depth report provides a comprehensive analysis of the Food Grade Tank Trucking Market, offering invaluable insights for industry stakeholders, investors, and businesses seeking to navigate this dynamic sector. With a study period spanning 2019-2033, a base year of 2025, and a forecast period of 2025-2033, this report delivers actionable intelligence based on rigorous market research and data analysis. The market size is predicted to reach xx Million by 2033, exhibiting a CAGR of xx% during the forecast period.
Food Grade Tank Trucking Market Dynamics & Concentration
The Food Grade Tank Trucking market is characterized by a moderately consolidated landscape with several major players competing for market share. The market concentration is influenced by factors such as economies of scale, specialized logistics capabilities, and regulatory compliance. Mergers and acquisitions (M&A) activity is a key dynamic, shaping market structure and competitive dynamics. In recent years, the number of M&A deals has increased, indicating consolidation and expansion efforts within the sector. Key drivers for innovation include the need for enhanced safety, improved efficiency, and sustainable transportation solutions. Stringent regulatory frameworks, particularly concerning food safety and environmental protection, play a significant role in shaping market operations. Product substitutes, such as rail transport for certain products, and evolving end-user trends, such as increased demand for specialized food products and sustainable practices, also influence market growth.
- Market Share: The top 10 players account for approximately xx% of the total market share in 2025. Hegelmann Group, C H Robinson, and DHL hold significant shares.
- M&A Activity: A total of xx M&A deals were recorded between 2019 and 2024, with an average deal value of xx Million.
Food Grade Tank Trucking Market Industry Trends & Analysis
The Food Grade Tank Trucking market is experiencing robust growth, driven by several key factors. The rising demand for processed foods and beverages fuels the need for efficient and safe transportation of liquid food products. Technological advancements, such as the adoption of telematics and GPS tracking systems, enhance operational efficiency and safety. Shifting consumer preferences towards convenience and a wider variety of food products are also contributing to market growth. However, fluctuating fuel prices and driver shortages pose challenges to the industry. Competitive dynamics are characterized by price competition, service differentiation, and strategic alliances. The market is experiencing a gradual shift towards specialized services and customized solutions catering to specific food product types.
- CAGR (2025-2033): xx%
- Market Penetration: The market penetration rate is expected to reach xx% by 2033.

Leading Markets & Segments in Food Grade Tank Trucking Market
North America currently dominates the Food Grade Tank Trucking Market, driven by a large food processing sector and robust infrastructure. Within North America, the US holds the largest market share due to factors such as high consumption of processed foods and a well-developed transportation network.
- Key Drivers in North America:
- Extensive highway network facilitating efficient transportation.
- Large food processing industry with high demand for bulk liquid transportation.
- Favorable regulatory environment promoting industry growth.
Food Grade Tank Trucking Market Product Developments
Recent product innovations focus on enhancing the safety and efficiency of food-grade tank transportation. Technological advancements, such as improved tank cleaning technologies and real-time monitoring systems, enhance food safety and reduce the risk of contamination. The integration of telematics and IoT (Internet of Things) devices provides real-time tracking and monitoring of shipments, enhancing efficiency and supply chain visibility. These innovations are crucial in meeting the increasing demand for secure and reliable food transportation solutions.
Key Drivers of Food Grade Tank Trucking Market Growth
Several factors drive the growth of the Food Grade Tank Trucking market. Increased consumer demand for processed foods and beverages is a significant driver, requiring efficient transportation solutions. Technological advancements like improved tank design, telematics, and route optimization software contribute to increased efficiency and reduced operational costs. Government regulations promoting food safety and environmental sustainability further propel market growth. Finally, the rise of e-commerce and online grocery delivery services necessitate reliable food transportation networks.
Challenges in the Food Grade Tank Trucking Market
The Food Grade Tank Trucking market faces several challenges. Stringent regulations and compliance requirements increase operational costs and complexity. Driver shortages and high driver turnover rates impact operational efficiency and capacity. Fluctuating fuel prices and volatile oil markets introduce uncertainty into cost structures. Finally, intense competition among existing players necessitates continuous innovation and cost optimization to maintain profitability.
Emerging Opportunities in Food Grade Tank Trucking Market
The Food Grade Tank Trucking market presents significant opportunities for growth. Expansion into emerging economies with a growing food processing industry presents untapped potential. Strategic partnerships and collaborations between trucking companies and food processing businesses can streamline operations and improve efficiency. Technological advancements, such as the adoption of autonomous vehicles and improved route optimization software, offer significant potential for enhanced efficiency and cost reduction. Focus on sustainable practices and environmentally friendly transportation solutions will attract environmentally conscious customers.
Leading Players in the Food Grade Tank Trucking Market Sector
- Hegelmann Group
- C H Robinson
- DHL
- Odyssey Logistics
- SHAL (Sea Hawk Lines)
- Kenan Advantage Group Inc
- Bulk Connection
- Trimac Transportation Services
- Heniff Transportation Systems LLC
- Quality Carriers
- 73 Other Companies
Key Milestones in Food Grade Tank Trucking Market Industry
- June 2024: TFI International's acquisition of Entreposage Marco expands its reach in the Canadian food-grade tank haulage market.
- April 2023: Trimac Transportation's acquisition of AIP Logistics strengthens its position in bulk transportation and food-grade warehousing.
Strategic Outlook for Food Grade Tank Trucking Market
The Food Grade Tank Trucking market holds immense future potential. Continued technological advancements and strategic investments in infrastructure are key growth accelerators. Companies focusing on sustainability and efficiency will be well-positioned to capitalize on emerging opportunities. Expansion into new geographical markets and strategic partnerships will drive future growth. The market's future depends heavily on the ability of companies to adapt to evolving regulations, manage supply chain complexities, and provide cost-effective, safe, and sustainable transportation solutions.
Food Grade Tank Trucking Market Segmentation
-
1. Food Item
- 1.1. Oil
- 1.2. Dairy
- 1.3. Juice and Beverage
- 1.4. Other Food Items
Food Grade Tank Trucking Market Segmentation By Geography
-
1. North America
- 1.1. United States
- 1.2. Canada
- 1.3. Mexico
-
2. Europe
- 2.1. France
- 2.2. Italy
- 2.3. Spain
- 2.4. Netherlands
- 2.5. Rest of Europe
-
3. Asia Pacific
- 3.1. China
- 3.2. Japan
- 3.3. India
- 3.4. Russia
- 3.5. Rest of Asia Pacific
-
4. Middle East and Africa
- 4.1. GCC
- 4.2. South Africa
- 4.3. Rest of Middle East and Africa
-
5. South America
- 5.1. Brazil
- 5.2. Argentina
- 5.3. Rest of South America

Food Grade Tank Trucking Market REPORT HIGHLIGHTS
| Aspects | Details |
|---|---|
| Study Period | 2019-2033 |
| Base Year | 2024 |
| Estimated Year | 2025 |
| Forecast Period | 2025-2033 |
| Historical Period | 2019-2024 |
| Growth Rate | CAGR of 5.88% from 2019-2033 |
| Segmentation |
|
Table of Contents
- 1. Introduction
- 1.1. Research Scope
- 1.2. Market Segmentation
- 1.3. Research Methodology
- 1.4. Definitions and Assumptions
- 2. Executive Summary
- 2.1. Introduction
- 3. Market Dynamics
- 3.1. Introduction
- 3.2. Market Drivers
- 3.2.1. Increasing Demand for Food Safety and Quality; Expansion of the Food and Beverage Industry
- 3.3. Market Restrains
- 3.3.1. Increasing Demand for Food Safety and Quality; Expansion of the Food and Beverage Industry
- 3.4. Market Trends
- 3.4.1. Global Cow Milk Consumption and Production Propel Food Grade Tank Trucking Demand
- 4. Market Factor Analysis
- 4.1. Porters Five Forces
- 4.2. Supply/Value Chain
- 4.3. PESTEL analysis
- 4.4. Market Entropy
- 4.5. Patent/Trademark Analysis
- 5. Global Food Grade Tank Trucking Market Analysis, Insights and Forecast, 2019-2031
- 5.1. Market Analysis, Insights and Forecast - by Food Item
- 5.1.1. Oil
- 5.1.2. Dairy
- 5.1.3. Juice and Beverage
- 5.1.4. Other Food Items
- 5.2. Market Analysis, Insights and Forecast - by Region
- 5.2.1. North America
- 5.2.2. Europe
- 5.2.3. Asia Pacific
- 5.2.4. Middle East and Africa
- 5.2.5. South America
- 5.1. Market Analysis, Insights and Forecast - by Food Item
- 6. North America Food Grade Tank Trucking Market Analysis, Insights and Forecast, 2019-2031
- 6.1. Market Analysis, Insights and Forecast - by Food Item
- 6.1.1. Oil
- 6.1.2. Dairy
- 6.1.3. Juice and Beverage
- 6.1.4. Other Food Items
- 6.1. Market Analysis, Insights and Forecast - by Food Item
- 7. Europe Food Grade Tank Trucking Market Analysis, Insights and Forecast, 2019-2031
- 7.1. Market Analysis, Insights and Forecast - by Food Item
- 7.1.1. Oil
- 7.1.2. Dairy
- 7.1.3. Juice and Beverage
- 7.1.4. Other Food Items
- 7.1. Market Analysis, Insights and Forecast - by Food Item
- 8. Asia Pacific Food Grade Tank Trucking Market Analysis, Insights and Forecast, 2019-2031
- 8.1. Market Analysis, Insights and Forecast - by Food Item
- 8.1.1. Oil
- 8.1.2. Dairy
- 8.1.3. Juice and Beverage
- 8.1.4. Other Food Items
- 8.1. Market Analysis, Insights and Forecast - by Food Item
- 9. Middle East and Africa Food Grade Tank Trucking Market Analysis, Insights and Forecast, 2019-2031
- 9.1. Market Analysis, Insights and Forecast - by Food Item
- 9.1.1. Oil
- 9.1.2. Dairy
- 9.1.3. Juice and Beverage
- 9.1.4. Other Food Items
- 9.1. Market Analysis, Insights and Forecast - by Food Item
- 10. South America Food Grade Tank Trucking Market Analysis, Insights and Forecast, 2019-2031
- 10.1. Market Analysis, Insights and Forecast - by Food Item
- 10.1.1. Oil
- 10.1.2. Dairy
- 10.1.3. Juice and Beverage
- 10.1.4. Other Food Items
- 10.1. Market Analysis, Insights and Forecast - by Food Item
- 11. Competitive Analysis
- 11.1. Global Market Share Analysis 2024
- 11.2. Company Profiles
- 11.2.1 Hegelmann Group
- 11.2.1.1. Overview
- 11.2.1.2. Products
- 11.2.1.3. SWOT Analysis
- 11.2.1.4. Recent Developments
- 11.2.1.5. Financials (Based on Availability)
- 11.2.2 C H Robinson
- 11.2.2.1. Overview
- 11.2.2.2. Products
- 11.2.2.3. SWOT Analysis
- 11.2.2.4. Recent Developments
- 11.2.2.5. Financials (Based on Availability)
- 11.2.3 DHL
- 11.2.3.1. Overview
- 11.2.3.2. Products
- 11.2.3.3. SWOT Analysis
- 11.2.3.4. Recent Developments
- 11.2.3.5. Financials (Based on Availability)
- 11.2.4 Odyssey Logistics
- 11.2.4.1. Overview
- 11.2.4.2. Products
- 11.2.4.3. SWOT Analysis
- 11.2.4.4. Recent Developments
- 11.2.4.5. Financials (Based on Availability)
- 11.2.5 SHAL (Sea Hawk Lines)
- 11.2.5.1. Overview
- 11.2.5.2. Products
- 11.2.5.3. SWOT Analysis
- 11.2.5.4. Recent Developments
- 11.2.5.5. Financials (Based on Availability)
- 11.2.6 Kenan Advantage Group Inc
- 11.2.6.1. Overview
- 11.2.6.2. Products
- 11.2.6.3. SWOT Analysis
- 11.2.6.4. Recent Developments
- 11.2.6.5. Financials (Based on Availability)
- 11.2.7 Bulk Connection
- 11.2.7.1. Overview
- 11.2.7.2. Products
- 11.2.7.3. SWOT Analysis
- 11.2.7.4. Recent Developments
- 11.2.7.5. Financials (Based on Availability)
- 11.2.8 Trimac Transportation Services
- 11.2.8.1. Overview
- 11.2.8.2. Products
- 11.2.8.3. SWOT Analysis
- 11.2.8.4. Recent Developments
- 11.2.8.5. Financials (Based on Availability)
- 11.2.9 Heniff Transportation Systems LLC
- 11.2.9.1. Overview
- 11.2.9.2. Products
- 11.2.9.3. SWOT Analysis
- 11.2.9.4. Recent Developments
- 11.2.9.5. Financials (Based on Availability)
- 11.2.10 Quality Carriers**List Not Exhaustive 7 3 Other Companie
- 11.2.10.1. Overview
- 11.2.10.2. Products
- 11.2.10.3. SWOT Analysis
- 11.2.10.4. Recent Developments
- 11.2.10.5. Financials (Based on Availability)
- 11.2.1 Hegelmann Group
List of Figures
- Figure 1: Global Food Grade Tank Trucking Market Revenue Breakdown (Million, %) by Region 2024 & 2032
- Figure 2: Global Food Grade Tank Trucking Market Volume Breakdown (Billion, %) by Region 2024 & 2032
- Figure 3: North America Food Grade Tank Trucking Market Revenue (Million), by Food Item 2024 & 2032
- Figure 4: North America Food Grade Tank Trucking Market Volume (Billion), by Food Item 2024 & 2032
- Figure 5: North America Food Grade Tank Trucking Market Revenue Share (%), by Food Item 2024 & 2032
- Figure 6: North America Food Grade Tank Trucking Market Volume Share (%), by Food Item 2024 & 2032
- Figure 7: North America Food Grade Tank Trucking Market Revenue (Million), by Country 2024 & 2032
- Figure 8: North America Food Grade Tank Trucking Market Volume (Billion), by Country 2024 & 2032
- Figure 9: North America Food Grade Tank Trucking Market Revenue Share (%), by Country 2024 & 2032
- Figure 10: North America Food Grade Tank Trucking Market Volume Share (%), by Country 2024 & 2032
- Figure 11: Europe Food Grade Tank Trucking Market Revenue (Million), by Food Item 2024 & 2032
- Figure 12: Europe Food Grade Tank Trucking Market Volume (Billion), by Food Item 2024 & 2032
- Figure 13: Europe Food Grade Tank Trucking Market Revenue Share (%), by Food Item 2024 & 2032
- Figure 14: Europe Food Grade Tank Trucking Market Volume Share (%), by Food Item 2024 & 2032
- Figure 15: Europe Food Grade Tank Trucking Market Revenue (Million), by Country 2024 & 2032
- Figure 16: Europe Food Grade Tank Trucking Market Volume (Billion), by Country 2024 & 2032
- Figure 17: Europe Food Grade Tank Trucking Market Revenue Share (%), by Country 2024 & 2032
- Figure 18: Europe Food Grade Tank Trucking Market Volume Share (%), by Country 2024 & 2032
- Figure 19: Asia Pacific Food Grade Tank Trucking Market Revenue (Million), by Food Item 2024 & 2032
- Figure 20: Asia Pacific Food Grade Tank Trucking Market Volume (Billion), by Food Item 2024 & 2032
- Figure 21: Asia Pacific Food Grade Tank Trucking Market Revenue Share (%), by Food Item 2024 & 2032
- Figure 22: Asia Pacific Food Grade Tank Trucking Market Volume Share (%), by Food Item 2024 & 2032
- Figure 23: Asia Pacific Food Grade Tank Trucking Market Revenue (Million), by Country 2024 & 2032
- Figure 24: Asia Pacific Food Grade Tank Trucking Market Volume (Billion), by Country 2024 & 2032
- Figure 25: Asia Pacific Food Grade Tank Trucking Market Revenue Share (%), by Country 2024 & 2032
- Figure 26: Asia Pacific Food Grade Tank Trucking Market Volume Share (%), by Country 2024 & 2032
- Figure 27: Middle East and Africa Food Grade Tank Trucking Market Revenue (Million), by Food Item 2024 & 2032
- Figure 28: Middle East and Africa Food Grade Tank Trucking Market Volume (Billion), by Food Item 2024 & 2032
- Figure 29: Middle East and Africa Food Grade Tank Trucking Market Revenue Share (%), by Food Item 2024 & 2032
- Figure 30: Middle East and Africa Food Grade Tank Trucking Market Volume Share (%), by Food Item 2024 & 2032
- Figure 31: Middle East and Africa Food Grade Tank Trucking Market Revenue (Million), by Country 2024 & 2032
- Figure 32: Middle East and Africa Food Grade Tank Trucking Market Volume (Billion), by Country 2024 & 2032
- Figure 33: Middle East and Africa Food Grade Tank Trucking Market Revenue Share (%), by Country 2024 & 2032
- Figure 34: Middle East and Africa Food Grade Tank Trucking Market Volume Share (%), by Country 2024 & 2032
- Figure 35: South America Food Grade Tank Trucking Market Revenue (Million), by Food Item 2024 & 2032
- Figure 36: South America Food Grade Tank Trucking Market Volume (Billion), by Food Item 2024 & 2032
- Figure 37: South America Food Grade Tank Trucking Market Revenue Share (%), by Food Item 2024 & 2032
- Figure 38: South America Food Grade Tank Trucking Market Volume Share (%), by Food Item 2024 & 2032
- Figure 39: South America Food Grade Tank Trucking Market Revenue (Million), by Country 2024 & 2032
- Figure 40: South America Food Grade Tank Trucking Market Volume (Billion), by Country 2024 & 2032
- Figure 41: South America Food Grade Tank Trucking Market Revenue Share (%), by Country 2024 & 2032
- Figure 42: South America Food Grade Tank Trucking Market Volume Share (%), by Country 2024 & 2032
List of Tables
- Table 1: Global Food Grade Tank Trucking Market Revenue Million Forecast, by Region 2019 & 2032
- Table 2: Global Food Grade Tank Trucking Market Volume Billion Forecast, by Region 2019 & 2032
- Table 3: Global Food Grade Tank Trucking Market Revenue Million Forecast, by Food Item 2019 & 2032
- Table 4: Global Food Grade Tank Trucking Market Volume Billion Forecast, by Food Item 2019 & 2032
- Table 5: Global Food Grade Tank Trucking Market Revenue Million Forecast, by Region 2019 & 2032
- Table 6: Global Food Grade Tank Trucking Market Volume Billion Forecast, by Region 2019 & 2032
- Table 7: Global Food Grade Tank Trucking Market Revenue Million Forecast, by Food Item 2019 & 2032
- Table 8: Global Food Grade Tank Trucking Market Volume Billion Forecast, by Food Item 2019 & 2032
- Table 9: Global Food Grade Tank Trucking Market Revenue Million Forecast, by Country 2019 & 2032
- Table 10: Global Food Grade Tank Trucking Market Volume Billion Forecast, by Country 2019 & 2032
- Table 11: United States Food Grade Tank Trucking Market Revenue (Million) Forecast, by Application 2019 & 2032
- Table 12: United States Food Grade Tank Trucking Market Volume (Billion) Forecast, by Application 2019 & 2032
- Table 13: Canada Food Grade Tank Trucking Market Revenue (Million) Forecast, by Application 2019 & 2032
- Table 14: Canada Food Grade Tank Trucking Market Volume (Billion) Forecast, by Application 2019 & 2032
- Table 15: Mexico Food Grade Tank Trucking Market Revenue (Million) Forecast, by Application 2019 & 2032
- Table 16: Mexico Food Grade Tank Trucking Market Volume (Billion) Forecast, by Application 2019 & 2032
- Table 17: Global Food Grade Tank Trucking Market Revenue Million Forecast, by Food Item 2019 & 2032
- Table 18: Global Food Grade Tank Trucking Market Volume Billion Forecast, by Food Item 2019 & 2032
- Table 19: Global Food Grade Tank Trucking Market Revenue Million Forecast, by Country 2019 & 2032
- Table 20: Global Food Grade Tank Trucking Market Volume Billion Forecast, by Country 2019 & 2032
- Table 21: France Food Grade Tank Trucking Market Revenue (Million) Forecast, by Application 2019 & 2032
- Table 22: France Food Grade Tank Trucking Market Volume (Billion) Forecast, by Application 2019 & 2032
- Table 23: Italy Food Grade Tank Trucking Market Revenue (Million) Forecast, by Application 2019 & 2032
- Table 24: Italy Food Grade Tank Trucking Market Volume (Billion) Forecast, by Application 2019 & 2032
- Table 25: Spain Food Grade Tank Trucking Market Revenue (Million) Forecast, by Application 2019 & 2032
- Table 26: Spain Food Grade Tank Trucking Market Volume (Billion) Forecast, by Application 2019 & 2032
- Table 27: Netherlands Food Grade Tank Trucking Market Revenue (Million) Forecast, by Application 2019 & 2032
- Table 28: Netherlands Food Grade Tank Trucking Market Volume (Billion) Forecast, by Application 2019 & 2032
- Table 29: Rest of Europe Food Grade Tank Trucking Market Revenue (Million) Forecast, by Application 2019 & 2032
- Table 30: Rest of Europe Food Grade Tank Trucking Market Volume (Billion) Forecast, by Application 2019 & 2032
- Table 31: Global Food Grade Tank Trucking Market Revenue Million Forecast, by Food Item 2019 & 2032
- Table 32: Global Food Grade Tank Trucking Market Volume Billion Forecast, by Food Item 2019 & 2032
- Table 33: Global Food Grade Tank Trucking Market Revenue Million Forecast, by Country 2019 & 2032
- Table 34: Global Food Grade Tank Trucking Market Volume Billion Forecast, by Country 2019 & 2032
- Table 35: China Food Grade Tank Trucking Market Revenue (Million) Forecast, by Application 2019 & 2032
- Table 36: China Food Grade Tank Trucking Market Volume (Billion) Forecast, by Application 2019 & 2032
- Table 37: Japan Food Grade Tank Trucking Market Revenue (Million) Forecast, by Application 2019 & 2032
- Table 38: Japan Food Grade Tank Trucking Market Volume (Billion) Forecast, by Application 2019 & 2032
- Table 39: India Food Grade Tank Trucking Market Revenue (Million) Forecast, by Application 2019 & 2032
- Table 40: India Food Grade Tank Trucking Market Volume (Billion) Forecast, by Application 2019 & 2032
- Table 41: Russia Food Grade Tank Trucking Market Revenue (Million) Forecast, by Application 2019 & 2032
- Table 42: Russia Food Grade Tank Trucking Market Volume (Billion) Forecast, by Application 2019 & 2032
- Table 43: Rest of Asia Pacific Food Grade Tank Trucking Market Revenue (Million) Forecast, by Application 2019 & 2032
- Table 44: Rest of Asia Pacific Food Grade Tank Trucking Market Volume (Billion) Forecast, by Application 2019 & 2032
- Table 45: Global Food Grade Tank Trucking Market Revenue Million Forecast, by Food Item 2019 & 2032
- Table 46: Global Food Grade Tank Trucking Market Volume Billion Forecast, by Food Item 2019 & 2032
- Table 47: Global Food Grade Tank Trucking Market Revenue Million Forecast, by Country 2019 & 2032
- Table 48: Global Food Grade Tank Trucking Market Volume Billion Forecast, by Country 2019 & 2032
- Table 49: GCC Food Grade Tank Trucking Market Revenue (Million) Forecast, by Application 2019 & 2032
- Table 50: GCC Food Grade Tank Trucking Market Volume (Billion) Forecast, by Application 2019 & 2032
- Table 51: South Africa Food Grade Tank Trucking Market Revenue (Million) Forecast, by Application 2019 & 2032
- Table 52: South Africa Food Grade Tank Trucking Market Volume (Billion) Forecast, by Application 2019 & 2032
- Table 53: Rest of Middle East and Africa Food Grade Tank Trucking Market Revenue (Million) Forecast, by Application 2019 & 2032
- Table 54: Rest of Middle East and Africa Food Grade Tank Trucking Market Volume (Billion) Forecast, by Application 2019 & 2032
- Table 55: Global Food Grade Tank Trucking Market Revenue Million Forecast, by Food Item 2019 & 2032
- Table 56: Global Food Grade Tank Trucking Market Volume Billion Forecast, by Food Item 2019 & 2032
- Table 57: Global Food Grade Tank Trucking Market Revenue Million Forecast, by Country 2019 & 2032
- Table 58: Global Food Grade Tank Trucking Market Volume Billion Forecast, by Country 2019 & 2032
- Table 59: Brazil Food Grade Tank Trucking Market Revenue (Million) Forecast, by Application 2019 & 2032
- Table 60: Brazil Food Grade Tank Trucking Market Volume (Billion) Forecast, by Application 2019 & 2032
- Table 61: Argentina Food Grade Tank Trucking Market Revenue (Million) Forecast, by Application 2019 & 2032
- Table 62: Argentina Food Grade Tank Trucking Market Volume (Billion) Forecast, by Application 2019 & 2032
- Table 63: Rest of South America Food Grade Tank Trucking Market Revenue (Million) Forecast, by Application 2019 & 2032
- Table 64: Rest of South America Food Grade Tank Trucking Market Volume (Billion) Forecast, by Application 2019 & 2032
Frequently Asked Questions
1. What is the projected Compound Annual Growth Rate (CAGR) of the Food Grade Tank Trucking Market?
The projected CAGR is approximately 5.88%.
2. Which companies are prominent players in the Food Grade Tank Trucking Market?
Key companies in the market include Hegelmann Group, C H Robinson, DHL, Odyssey Logistics, SHAL (Sea Hawk Lines), Kenan Advantage Group Inc, Bulk Connection, Trimac Transportation Services, Heniff Transportation Systems LLC, Quality Carriers**List Not Exhaustive 7 3 Other Companie.
3. What are the main segments of the Food Grade Tank Trucking Market?
The market segments include Food Item.
4. Can you provide details about the market size?
The market size is estimated to be USD 5.41 Million as of 2022.
5. What are some drivers contributing to market growth?
Increasing Demand for Food Safety and Quality; Expansion of the Food and Beverage Industry.
6. What are the notable trends driving market growth?
Global Cow Milk Consumption and Production Propel Food Grade Tank Trucking Demand.
7. Are there any restraints impacting market growth?
Increasing Demand for Food Safety and Quality; Expansion of the Food and Beverage Industry.
8. Can you provide examples of recent developments in the market?
June 2024: TFI International has acquired Entreposage Marco, a Quebec, Canada-based food-grade tank hauler. Specializing in the transportation of edible products such as oils, liquid yeast, sweeteners, and fruit juices, Entreposage Marco operates a fleet of 15 power units, as reported by the Federal Motor Carrier Safety Administration. This acquisition is significant and aims to increase the market reach of TFI International.April 2023: Trimac Transportation acquired American Industrial Partners (AIP) Logistics, a Central Ohio-based company specializing in bulk terminal services, transportation, and warehousing for industries such as plastics, liquid chemicals, food-grade storage, and metal production. AIP's fleet includes 13 tractors, 119 trailers, and various yard vehicles. Located on a 52-acre property in Wapakoneta, Ohio, the facility offers cold, dry, and food-grade warehousing, bulk transloading, and storage, with direct access to CSX Transportation’s rail line and capacity for up to 70 railcars. This acquisition strengthens Trimac's five-year strategy to enhance its position in bulk transportation, wash, and maintenance services.
9. What pricing options are available for accessing the report?
Pricing options include single-user, multi-user, and enterprise licenses priced at USD 4750, USD 5250, and USD 8750 respectively.
10. Is the market size provided in terms of value or volume?
The market size is provided in terms of value, measured in Million and volume, measured in Billion.
11. Are there any specific market keywords associated with the report?
Yes, the market keyword associated with the report is "Food Grade Tank Trucking Market," which aids in identifying and referencing the specific market segment covered.
12. How do I determine which pricing option suits my needs best?
The pricing options vary based on user requirements and access needs. Individual users may opt for single-user licenses, while businesses requiring broader access may choose multi-user or enterprise licenses for cost-effective access to the report.
13. Are there any additional resources or data provided in the Food Grade Tank Trucking Market report?
While the report offers comprehensive insights, it's advisable to review the specific contents or supplementary materials provided to ascertain if additional resources or data are available.
14. How can I stay updated on further developments or reports in the Food Grade Tank Trucking Market?
To stay informed about further developments, trends, and reports in the Food Grade Tank Trucking Market, consider subscribing to industry newsletters, following relevant companies and organizations, or regularly checking reputable industry news sources and publications.
Methodology
Step 1 - Identification of Relevant Samples Size from Population Database


Step 2 - Approaches for Defining Global Market Size (Value, Volume* & Price*)

Note*: In applicable scenarios
Step 3 - Data Sources
Primary Research
- Web Analytics
- Survey Reports
- Research Institute
- Latest Research Reports
- Opinion Leaders
Secondary Research
- Annual Reports
- White Paper
- Latest Press Release
- Industry Association
- Paid Database
- Investor Presentations

Step 4 - Data Triangulation
Involves using different sources of information in order to increase the validity of a study
These sources are likely to be stakeholders in a program - participants, other researchers, program staff, other community members, and so on.
Then we put all data in single framework & apply various statistical tools to find out the dynamic on the market.
During the analysis stage, feedback from the stakeholder groups would be compared to determine areas of agreement as well as areas of divergence
