

Key Insights
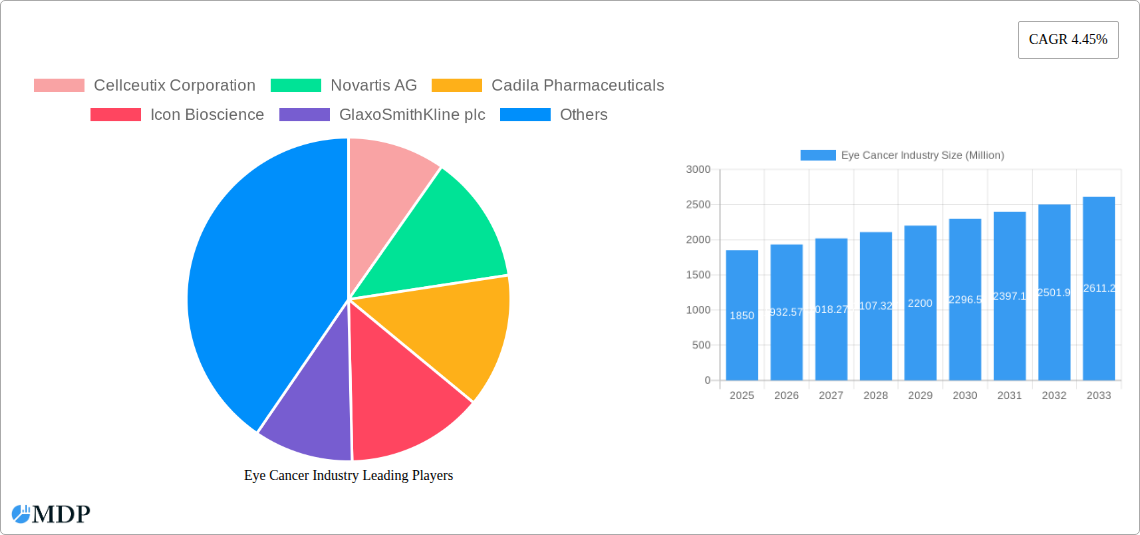
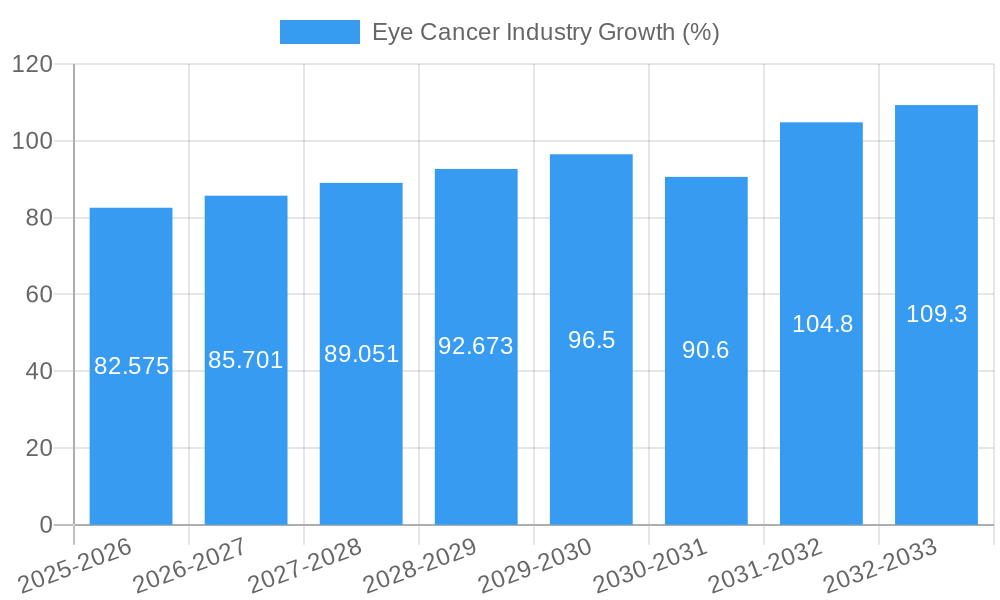
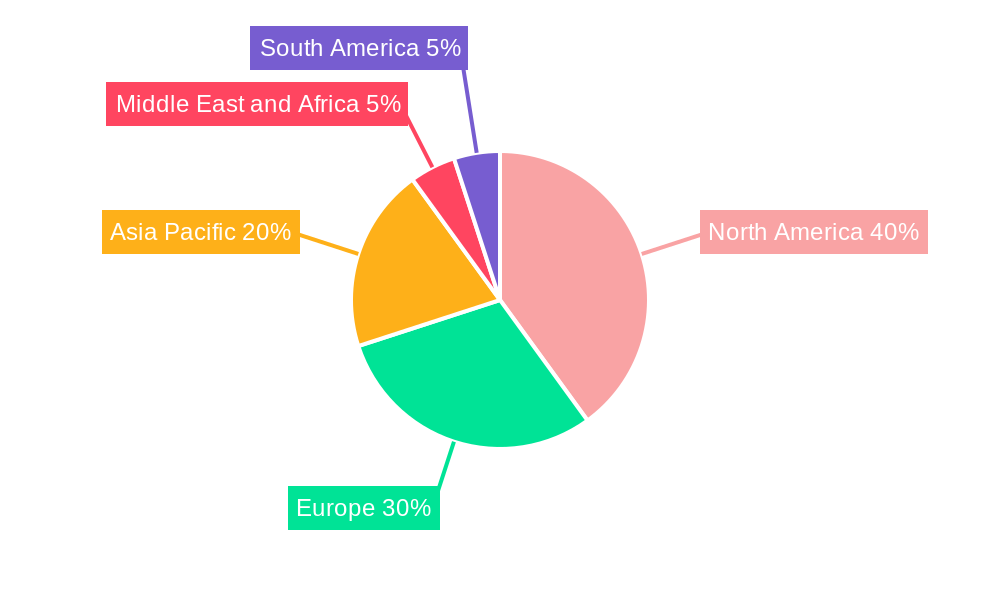
The global eye cancer market, currently valued at approximately $1.85 billion in 2025, is projected to experience robust growth, exhibiting a Compound Annual Growth Rate (CAGR) of 4.45% from 2025 to 2033. This expansion is driven by several key factors. Increasing prevalence of retinoblastoma, particularly in developing nations with limited access to early diagnosis and treatment, significantly fuels market growth. Advancements in diagnostic technologies, such as improved imaging techniques and genetic screening, enable earlier detection and more effective treatment strategies, contributing to market expansion. The rising geriatric population globally, coupled with a higher incidence of age-related eye cancers like uveal melanoma, further propels market demand. Furthermore, ongoing research and development efforts focused on novel therapies, including targeted therapies and immunotherapies, are expected to introduce innovative treatment options, enhancing market prospects. The market is segmented by retinoblastoma type (intraocular, extraocular), treatment type (surgery, radiation, chemotherapy, etc.), and geography, with North America and Europe currently holding substantial market shares due to advanced healthcare infrastructure and higher diagnostic rates. However, Asia-Pacific is anticipated to witness significant growth over the forecast period owing to increasing awareness, rising healthcare expenditure, and expanding patient populations. While challenges remain, such as high treatment costs and potential side effects of certain therapies, the overall market outlook for eye cancer treatment remains positive, indicating substantial future growth potential.
Despite the promising growth trajectory, several factors could influence the market's trajectory. The high cost of advanced therapies, particularly novel targeted and immunotherapies, poses a significant barrier to access, especially in low- and middle-income countries. Furthermore, the development of resistance to certain chemotherapeutic agents necessitates continuous research into novel treatment strategies to maintain therapeutic efficacy. Regulatory hurdles and lengthy approval processes for new drugs can also impede market expansion. However, collaborative efforts between pharmaceutical companies, research institutions, and healthcare providers are expected to overcome these challenges. Increased investment in research and development, along with government initiatives to improve healthcare access and affordability, will play a crucial role in shaping the future of the eye cancer market. The focus on personalized medicine, tailoring treatment strategies based on individual patient characteristics and genetic profiles, presents a significant opportunity for growth and improved patient outcomes.
Eye Cancer Industry Market Report: 2019-2033 Forecast
This comprehensive report provides a detailed analysis of the global eye cancer industry, offering invaluable insights for stakeholders, investors, and industry professionals. Covering the period 2019-2033, with a focus on 2025, this report projects a market valued at $XX Million and reveals significant growth opportunities. The report meticulously examines market dynamics, leading players, technological advancements, and future trends, enabling informed decision-making in this dynamic sector.
Eye Cancer Industry Market Dynamics & Concentration
The global eye cancer market, estimated at $XX Million in 2025, displays a moderately concentrated landscape. While a few large pharmaceutical companies hold significant market share, numerous smaller specialized firms contribute to innovation and competition. The market's dynamic nature is driven by several factors:
- Innovation Drivers: Significant R&D investments in novel therapies, diagnostics, and targeted drug delivery systems are driving market growth. The discovery of molecules like ESRRG (see Key Milestones) exemplifies this ongoing research.
- Regulatory Frameworks: Stringent regulatory approvals and clinical trial processes influence market entry and product lifecycle management. Varying regulations across different geographies impact market penetration strategies.
- Product Substitutes: The availability of alternative treatments and the ongoing development of less invasive procedures influence treatment choices and market competition.
- End-User Trends: Increasing awareness about eye cancer, improved diagnostic capabilities, and a rising elderly population contribute to market expansion.
- M&A Activities: Consolidation through mergers and acquisitions is a notable trend, with an estimated XX M&A deals in the past five years, leading to increased market share for larger players. These deals often focus on acquiring innovative technologies or expanding geographic reach. The market share of the top 5 players accounts for approximately xx%.
Eye Cancer Industry Industry Trends & Analysis
The eye cancer market exhibits a robust CAGR of xx% during the forecast period (2025-2033). This growth is propelled by several key factors:
- Technological Disruptions: Advances in molecular diagnostics, targeted therapies, and minimally invasive surgical techniques significantly impact treatment outcomes and market expansion. This includes the advent of new imaging technologies, such as OCT angiography, which are able to improve the early detection of retinoblastoma.
- Market Growth Drivers: The rising prevalence of eye cancer, particularly retinoblastoma, coupled with an aging global population fuels demand for effective treatments. Increased healthcare spending and improved access to healthcare in developing nations also contribute to market growth.
- Consumer Preferences: Patients increasingly seek personalized and minimally invasive treatment options, driving demand for advanced therapies and influencing the adoption of innovative technologies.
- Competitive Dynamics: Intense competition among established pharmaceutical companies and emerging biotech firms fosters innovation and drives down treatment costs. This competitive landscape is further shaped by the strategic partnerships and collaborations between companies in different areas of expertise. Market penetration is expected to reach xx% by 2033.
Leading Markets & Segments in Eye Cancer Industry
While data for precise market share per segment is unavailable, the report suggests that:
- By Type of Staging: Intraocular retinoblastoma accounts for a larger market share compared to extraocular retinoblastoma, primarily due to higher prevalence.
- By Treatment Type: Surgery remains the dominant treatment modality, followed by radiation therapy and chemotherapy. The increasing adoption of targeted therapies, such as laser therapy and cryotherapy, however, is driving segment growth and changing this balance. The market for bone marrow transplantation/stem cell transplant is expected to increase due to the higher success rates and reduced side effects.
- By Type of Retinoblastoma: Non-hereditary retinoblastoma holds a larger market share than hereditary retinoblastoma due to its higher incidence rates. However, the management of hereditary retinoblastoma is becoming increasingly complex due to the increased risk of secondary tumors.
Key Drivers:
- North America dominates the market due to high healthcare expenditure, advanced healthcare infrastructure, and a high prevalence of eye cancer.
- Europe shows significant growth potential, driven by favorable reimbursement policies and technological advancements.
- Asia-Pacific exhibits substantial growth potential, fuelled by rising healthcare expenditure and an increasing prevalence of eye cancer in this region, especially in India and China.
Eye Cancer Industry Product Developments
Recent advancements focus on developing targeted therapies, improving diagnostic tools, and enhancing drug delivery systems. This includes the exploration of novel drug combinations and the development of less-invasive surgical techniques to reduce side effects and improve patient outcomes. Technological advancements, particularly in gene therapy and immunotherapy, offer significant opportunities for improved treatment efficacy. These new product developments are carefully tailored to meet the specific needs of each patient, resulting in a more personalized treatment approach.
Key Drivers of Eye Cancer Industry Growth
The eye cancer industry's growth is driven by several factors:
- Technological advancements: Innovations in diagnostics, treatment modalities, and drug delivery systems drive market growth.
- Increased awareness: Growing awareness and improved screening programs lead to earlier diagnosis and improved treatment outcomes.
- Favorable regulatory environments: Supportive regulatory frameworks expedite the approval of new therapies and diagnostic tools.
Challenges in the Eye Cancer Industry Market
The market faces several challenges:
- High treatment costs: The cost of advanced therapies can limit accessibility for patients in low- and middle-income countries.
- Side effects: Certain treatment modalities can result in significant side effects, impacting patient compliance and treatment outcomes.
- Resistance to therapies: The development of resistance to current treatment options limits long-term efficacy.
Emerging Opportunities in Eye Cancer Industry
Significant opportunities exist in:
- Personalized medicine: Tailoring treatments to individual patient characteristics can improve treatment efficacy and reduce side effects.
- Strategic partnerships: Collaboration between pharmaceutical companies, research institutions, and healthcare providers accelerates the development and deployment of innovative solutions.
- Expanding into emerging markets: Untapped potential exists in developing countries with high eye cancer prevalence but limited access to advanced therapies.
Leading Players in the Eye Cancer Industry Sector
- Cellceutix Corporation
- Novartis AG
- Cadila Pharmaceuticals
- Icon Bioscience
- GlaxoSmithKline plc
- Teva Pharmaceutical Industries Ltd
- Johnson & Johnson
- RXi Pharmaceuticals
- Merck & Co
- Baxter International Inc
- Bristol-Myers Squibb Company
- Pfizer Inc
Key Milestones in Eye Cancer Industry Industry
- May 2022: The UK's National Health Service launched a new test to detect retinoblastoma in unborn babies, enabling early intervention and potentially saving eyesight.
- September 2022: Researchers discovered the ESRRG molecule's role in retinoblastoma, paving the way for targeted therapies.
Strategic Outlook for Eye Cancer Industry Market
The eye cancer market is poised for substantial growth driven by technological advancements, increasing awareness, and a growing elderly population. Strategic partnerships, personalized medicine approaches, and expansion into emerging markets represent significant opportunities for industry players. The focus on early detection and targeted therapies will further shape the future landscape of this dynamic sector.
Eye Cancer Industry Segmentation
-
1. Treatment Type
- 1.1. Surgery
- 1.2. Radiation therapy
- 1.3. Laser Therapy
- 1.4. Cryotherapy
- 1.5. Chemotherapy
- 1.6. Bone Marrow Transplantation/Stem Cell Transplant
-
2. Type of Retinoblastoma
- 2.1. Non-hereditary Retinoblastoma
- 2.2. Hereditary Retinoblastoma
-
3. Type of Staging
- 3.1. Intraocular Retinoblastoma
- 3.2. Extraocular Retinoblastoma
Eye Cancer Industry Segmentation By Geography
-
1. North America
- 1.1. United States
- 1.2. Canada
- 1.3. Mexico
-
2. Europe
- 2.1. Germany
- 2.2. United Kingdom
- 2.3. France
- 2.4. Italy
- 2.5. Spain
- 2.6. Rest of Europe
-
3. Asia Pacific
- 3.1. China
- 3.2. Japan
- 3.3. India
- 3.4. Australia
- 3.5. South Korea
- 3.6. Rest of Asia Pacific
-
4. Middle East and Africa
- 4.1. GCC
- 4.2. South Africa
- 4.3. Rest of Middle East and Africa
-
5. South America
- 5.1. Brazil
- 5.2. Argentina
- 5.3. Rest of South America
Eye Cancer Industry REPORT HIGHLIGHTS
| Aspects | Details |
|---|---|
| Study Period | 2019-2033 |
| Base Year | 2024 |
| Estimated Year | 2025 |
| Forecast Period | 2025-2033 |
| Historical Period | 2019-2024 |
| Growth Rate | CAGR of 4.45% from 2019-2033 |
| Segmentation |
|
Table of Contents
- 1. Introduction
- 1.1. Research Scope
- 1.2. Market Segmentation
- 1.3. Research Methodology
- 1.4. Definitions and Assumptions
- 2. Executive Summary
- 2.1. Introduction
- 3. Market Dynamics
- 3.1. Introduction
- 3.2. Market Drivers
- 3.2.1. Remission and the Chance of Recurrence of Retinoblastoma; Increasing Public Awareness on Retinoblastoma
- 3.3. Market Restrains
- 3.3.1. Side Effects of Retinoblastoma Surgery and High Cost of Treatment in Developing Countries
- 3.4. Market Trends
- 3.4.1. Non-hereditary Retinoblastoma is Expected to hold a Significant Market Share Over the Forecast Period
- 4. Market Factor Analysis
- 4.1. Porters Five Forces
- 4.2. Supply/Value Chain
- 4.3. PESTEL analysis
- 4.4. Market Entropy
- 4.5. Patent/Trademark Analysis
- 5. Global Eye Cancer Industry Analysis, Insights and Forecast, 2019-2031
- 5.1. Market Analysis, Insights and Forecast - by Treatment Type
- 5.1.1. Surgery
- 5.1.2. Radiation therapy
- 5.1.3. Laser Therapy
- 5.1.4. Cryotherapy
- 5.1.5. Chemotherapy
- 5.1.6. Bone Marrow Transplantation/Stem Cell Transplant
- 5.2. Market Analysis, Insights and Forecast - by Type of Retinoblastoma
- 5.2.1. Non-hereditary Retinoblastoma
- 5.2.2. Hereditary Retinoblastoma
- 5.3. Market Analysis, Insights and Forecast - by Type of Staging
- 5.3.1. Intraocular Retinoblastoma
- 5.3.2. Extraocular Retinoblastoma
- 5.4. Market Analysis, Insights and Forecast - by Region
- 5.4.1. North America
- 5.4.2. Europe
- 5.4.3. Asia Pacific
- 5.4.4. Middle East and Africa
- 5.4.5. South America
- 5.1. Market Analysis, Insights and Forecast - by Treatment Type
- 6. North America Eye Cancer Industry Analysis, Insights and Forecast, 2019-2031
- 6.1. Market Analysis, Insights and Forecast - by Treatment Type
- 6.1.1. Surgery
- 6.1.2. Radiation therapy
- 6.1.3. Laser Therapy
- 6.1.4. Cryotherapy
- 6.1.5. Chemotherapy
- 6.1.6. Bone Marrow Transplantation/Stem Cell Transplant
- 6.2. Market Analysis, Insights and Forecast - by Type of Retinoblastoma
- 6.2.1. Non-hereditary Retinoblastoma
- 6.2.2. Hereditary Retinoblastoma
- 6.3. Market Analysis, Insights and Forecast - by Type of Staging
- 6.3.1. Intraocular Retinoblastoma
- 6.3.2. Extraocular Retinoblastoma
- 6.1. Market Analysis, Insights and Forecast - by Treatment Type
- 7. Europe Eye Cancer Industry Analysis, Insights and Forecast, 2019-2031
- 7.1. Market Analysis, Insights and Forecast - by Treatment Type
- 7.1.1. Surgery
- 7.1.2. Radiation therapy
- 7.1.3. Laser Therapy
- 7.1.4. Cryotherapy
- 7.1.5. Chemotherapy
- 7.1.6. Bone Marrow Transplantation/Stem Cell Transplant
- 7.2. Market Analysis, Insights and Forecast - by Type of Retinoblastoma
- 7.2.1. Non-hereditary Retinoblastoma
- 7.2.2. Hereditary Retinoblastoma
- 7.3. Market Analysis, Insights and Forecast - by Type of Staging
- 7.3.1. Intraocular Retinoblastoma
- 7.3.2. Extraocular Retinoblastoma
- 7.1. Market Analysis, Insights and Forecast - by Treatment Type
- 8. Asia Pacific Eye Cancer Industry Analysis, Insights and Forecast, 2019-2031
- 8.1. Market Analysis, Insights and Forecast - by Treatment Type
- 8.1.1. Surgery
- 8.1.2. Radiation therapy
- 8.1.3. Laser Therapy
- 8.1.4. Cryotherapy
- 8.1.5. Chemotherapy
- 8.1.6. Bone Marrow Transplantation/Stem Cell Transplant
- 8.2. Market Analysis, Insights and Forecast - by Type of Retinoblastoma
- 8.2.1. Non-hereditary Retinoblastoma
- 8.2.2. Hereditary Retinoblastoma
- 8.3. Market Analysis, Insights and Forecast - by Type of Staging
- 8.3.1. Intraocular Retinoblastoma
- 8.3.2. Extraocular Retinoblastoma
- 8.1. Market Analysis, Insights and Forecast - by Treatment Type
- 9. Middle East and Africa Eye Cancer Industry Analysis, Insights and Forecast, 2019-2031
- 9.1. Market Analysis, Insights and Forecast - by Treatment Type
- 9.1.1. Surgery
- 9.1.2. Radiation therapy
- 9.1.3. Laser Therapy
- 9.1.4. Cryotherapy
- 9.1.5. Chemotherapy
- 9.1.6. Bone Marrow Transplantation/Stem Cell Transplant
- 9.2. Market Analysis, Insights and Forecast - by Type of Retinoblastoma
- 9.2.1. Non-hereditary Retinoblastoma
- 9.2.2. Hereditary Retinoblastoma
- 9.3. Market Analysis, Insights and Forecast - by Type of Staging
- 9.3.1. Intraocular Retinoblastoma
- 9.3.2. Extraocular Retinoblastoma
- 9.1. Market Analysis, Insights and Forecast - by Treatment Type
- 10. South America Eye Cancer Industry Analysis, Insights and Forecast, 2019-2031
- 10.1. Market Analysis, Insights and Forecast - by Treatment Type
- 10.1.1. Surgery
- 10.1.2. Radiation therapy
- 10.1.3. Laser Therapy
- 10.1.4. Cryotherapy
- 10.1.5. Chemotherapy
- 10.1.6. Bone Marrow Transplantation/Stem Cell Transplant
- 10.2. Market Analysis, Insights and Forecast - by Type of Retinoblastoma
- 10.2.1. Non-hereditary Retinoblastoma
- 10.2.2. Hereditary Retinoblastoma
- 10.3. Market Analysis, Insights and Forecast - by Type of Staging
- 10.3.1. Intraocular Retinoblastoma
- 10.3.2. Extraocular Retinoblastoma
- 10.1. Market Analysis, Insights and Forecast - by Treatment Type
- 11. North America Eye Cancer Industry Analysis, Insights and Forecast, 2019-2031
- 11.1. Market Analysis, Insights and Forecast - By Country/Sub-region
- 11.1.1 United States
- 11.1.2 Canada
- 11.1.3 Mexico
- 12. Europe Eye Cancer Industry Analysis, Insights and Forecast, 2019-2031
- 12.1. Market Analysis, Insights and Forecast - By Country/Sub-region
- 12.1.1 Germany
- 12.1.2 United Kingdom
- 12.1.3 France
- 12.1.4 Italy
- 12.1.5 Spain
- 12.1.6 Rest of Europe
- 13. Asia Pacific Eye Cancer Industry Analysis, Insights and Forecast, 2019-2031
- 13.1. Market Analysis, Insights and Forecast - By Country/Sub-region
- 13.1.1 China
- 13.1.2 Japan
- 13.1.3 India
- 13.1.4 Australia
- 13.1.5 South Korea
- 13.1.6 Rest of Asia Pacific
- 14. Middle East and Africa Eye Cancer Industry Analysis, Insights and Forecast, 2019-2031
- 14.1. Market Analysis, Insights and Forecast - By Country/Sub-region
- 14.1.1 GCC
- 14.1.2 South Africa
- 14.1.3 Rest of Middle East and Africa
- 15. South America Eye Cancer Industry Analysis, Insights and Forecast, 2019-2031
- 15.1. Market Analysis, Insights and Forecast - By Country/Sub-region
- 15.1.1 Brazil
- 15.1.2 Argentina
- 15.1.3 Rest of South America
- 16. Competitive Analysis
- 16.1. Global Market Share Analysis 2024
- 16.2. Company Profiles
- 16.2.1 Cellceutix Corporation
- 16.2.1.1. Overview
- 16.2.1.2. Products
- 16.2.1.3. SWOT Analysis
- 16.2.1.4. Recent Developments
- 16.2.1.5. Financials (Based on Availability)
- 16.2.2 Novartis AG
- 16.2.2.1. Overview
- 16.2.2.2. Products
- 16.2.2.3. SWOT Analysis
- 16.2.2.4. Recent Developments
- 16.2.2.5. Financials (Based on Availability)
- 16.2.3 Cadila Pharmaceuticals
- 16.2.3.1. Overview
- 16.2.3.2. Products
- 16.2.3.3. SWOT Analysis
- 16.2.3.4. Recent Developments
- 16.2.3.5. Financials (Based on Availability)
- 16.2.4 Icon Bioscience
- 16.2.4.1. Overview
- 16.2.4.2. Products
- 16.2.4.3. SWOT Analysis
- 16.2.4.4. Recent Developments
- 16.2.4.5. Financials (Based on Availability)
- 16.2.5 GlaxoSmithKline plc
- 16.2.5.1. Overview
- 16.2.5.2. Products
- 16.2.5.3. SWOT Analysis
- 16.2.5.4. Recent Developments
- 16.2.5.5. Financials (Based on Availability)
- 16.2.6 Teva Pharmaceutical Industries Ltd
- 16.2.6.1. Overview
- 16.2.6.2. Products
- 16.2.6.3. SWOT Analysis
- 16.2.6.4. Recent Developments
- 16.2.6.5. Financials (Based on Availability)
- 16.2.7 Johnson & Johnson
- 16.2.7.1. Overview
- 16.2.7.2. Products
- 16.2.7.3. SWOT Analysis
- 16.2.7.4. Recent Developments
- 16.2.7.5. Financials (Based on Availability)
- 16.2.8 RXi Pharmaceuticals*List Not Exhaustive
- 16.2.8.1. Overview
- 16.2.8.2. Products
- 16.2.8.3. SWOT Analysis
- 16.2.8.4. Recent Developments
- 16.2.8.5. Financials (Based on Availability)
- 16.2.9 Merck & Co
- 16.2.9.1. Overview
- 16.2.9.2. Products
- 16.2.9.3. SWOT Analysis
- 16.2.9.4. Recent Developments
- 16.2.9.5. Financials (Based on Availability)
- 16.2.10 Baxter International Inc
- 16.2.10.1. Overview
- 16.2.10.2. Products
- 16.2.10.3. SWOT Analysis
- 16.2.10.4. Recent Developments
- 16.2.10.5. Financials (Based on Availability)
- 16.2.11 Bristol-Myers Squibb Company
- 16.2.11.1. Overview
- 16.2.11.2. Products
- 16.2.11.3. SWOT Analysis
- 16.2.11.4. Recent Developments
- 16.2.11.5. Financials (Based on Availability)
- 16.2.12 Pfizer Inc
- 16.2.12.1. Overview
- 16.2.12.2. Products
- 16.2.12.3. SWOT Analysis
- 16.2.12.4. Recent Developments
- 16.2.12.5. Financials (Based on Availability)
- 16.2.1 Cellceutix Corporation
List of Figures
- Figure 1: Global Eye Cancer Industry Revenue Breakdown (Million, %) by Region 2024 & 2032
- Figure 2: North America Eye Cancer Industry Revenue (Million), by Country 2024 & 2032
- Figure 3: North America Eye Cancer Industry Revenue Share (%), by Country 2024 & 2032
- Figure 4: Europe Eye Cancer Industry Revenue (Million), by Country 2024 & 2032
- Figure 5: Europe Eye Cancer Industry Revenue Share (%), by Country 2024 & 2032
- Figure 6: Asia Pacific Eye Cancer Industry Revenue (Million), by Country 2024 & 2032
- Figure 7: Asia Pacific Eye Cancer Industry Revenue Share (%), by Country 2024 & 2032
- Figure 8: Middle East and Africa Eye Cancer Industry Revenue (Million), by Country 2024 & 2032
- Figure 9: Middle East and Africa Eye Cancer Industry Revenue Share (%), by Country 2024 & 2032
- Figure 10: South America Eye Cancer Industry Revenue (Million), by Country 2024 & 2032
- Figure 11: South America Eye Cancer Industry Revenue Share (%), by Country 2024 & 2032
- Figure 12: North America Eye Cancer Industry Revenue (Million), by Treatment Type 2024 & 2032
- Figure 13: North America Eye Cancer Industry Revenue Share (%), by Treatment Type 2024 & 2032
- Figure 14: North America Eye Cancer Industry Revenue (Million), by Type of Retinoblastoma 2024 & 2032
- Figure 15: North America Eye Cancer Industry Revenue Share (%), by Type of Retinoblastoma 2024 & 2032
- Figure 16: North America Eye Cancer Industry Revenue (Million), by Type of Staging 2024 & 2032
- Figure 17: North America Eye Cancer Industry Revenue Share (%), by Type of Staging 2024 & 2032
- Figure 18: North America Eye Cancer Industry Revenue (Million), by Country 2024 & 2032
- Figure 19: North America Eye Cancer Industry Revenue Share (%), by Country 2024 & 2032
- Figure 20: Europe Eye Cancer Industry Revenue (Million), by Treatment Type 2024 & 2032
- Figure 21: Europe Eye Cancer Industry Revenue Share (%), by Treatment Type 2024 & 2032
- Figure 22: Europe Eye Cancer Industry Revenue (Million), by Type of Retinoblastoma 2024 & 2032
- Figure 23: Europe Eye Cancer Industry Revenue Share (%), by Type of Retinoblastoma 2024 & 2032
- Figure 24: Europe Eye Cancer Industry Revenue (Million), by Type of Staging 2024 & 2032
- Figure 25: Europe Eye Cancer Industry Revenue Share (%), by Type of Staging 2024 & 2032
- Figure 26: Europe Eye Cancer Industry Revenue (Million), by Country 2024 & 2032
- Figure 27: Europe Eye Cancer Industry Revenue Share (%), by Country 2024 & 2032
- Figure 28: Asia Pacific Eye Cancer Industry Revenue (Million), by Treatment Type 2024 & 2032
- Figure 29: Asia Pacific Eye Cancer Industry Revenue Share (%), by Treatment Type 2024 & 2032
- Figure 30: Asia Pacific Eye Cancer Industry Revenue (Million), by Type of Retinoblastoma 2024 & 2032
- Figure 31: Asia Pacific Eye Cancer Industry Revenue Share (%), by Type of Retinoblastoma 2024 & 2032
- Figure 32: Asia Pacific Eye Cancer Industry Revenue (Million), by Type of Staging 2024 & 2032
- Figure 33: Asia Pacific Eye Cancer Industry Revenue Share (%), by Type of Staging 2024 & 2032
- Figure 34: Asia Pacific Eye Cancer Industry Revenue (Million), by Country 2024 & 2032
- Figure 35: Asia Pacific Eye Cancer Industry Revenue Share (%), by Country 2024 & 2032
- Figure 36: Middle East and Africa Eye Cancer Industry Revenue (Million), by Treatment Type 2024 & 2032
- Figure 37: Middle East and Africa Eye Cancer Industry Revenue Share (%), by Treatment Type 2024 & 2032
- Figure 38: Middle East and Africa Eye Cancer Industry Revenue (Million), by Type of Retinoblastoma 2024 & 2032
- Figure 39: Middle East and Africa Eye Cancer Industry Revenue Share (%), by Type of Retinoblastoma 2024 & 2032
- Figure 40: Middle East and Africa Eye Cancer Industry Revenue (Million), by Type of Staging 2024 & 2032
- Figure 41: Middle East and Africa Eye Cancer Industry Revenue Share (%), by Type of Staging 2024 & 2032
- Figure 42: Middle East and Africa Eye Cancer Industry Revenue (Million), by Country 2024 & 2032
- Figure 43: Middle East and Africa Eye Cancer Industry Revenue Share (%), by Country 2024 & 2032
- Figure 44: South America Eye Cancer Industry Revenue (Million), by Treatment Type 2024 & 2032
- Figure 45: South America Eye Cancer Industry Revenue Share (%), by Treatment Type 2024 & 2032
- Figure 46: South America Eye Cancer Industry Revenue (Million), by Type of Retinoblastoma 2024 & 2032
- Figure 47: South America Eye Cancer Industry Revenue Share (%), by Type of Retinoblastoma 2024 & 2032
- Figure 48: South America Eye Cancer Industry Revenue (Million), by Type of Staging 2024 & 2032
- Figure 49: South America Eye Cancer Industry Revenue Share (%), by Type of Staging 2024 & 2032
- Figure 50: South America Eye Cancer Industry Revenue (Million), by Country 2024 & 2032
- Figure 51: South America Eye Cancer Industry Revenue Share (%), by Country 2024 & 2032
List of Tables
- Table 1: Global Eye Cancer Industry Revenue Million Forecast, by Region 2019 & 2032
- Table 2: Global Eye Cancer Industry Revenue Million Forecast, by Treatment Type 2019 & 2032
- Table 3: Global Eye Cancer Industry Revenue Million Forecast, by Type of Retinoblastoma 2019 & 2032
- Table 4: Global Eye Cancer Industry Revenue Million Forecast, by Type of Staging 2019 & 2032
- Table 5: Global Eye Cancer Industry Revenue Million Forecast, by Region 2019 & 2032
- Table 6: Global Eye Cancer Industry Revenue Million Forecast, by Country 2019 & 2032
- Table 7: United States Eye Cancer Industry Revenue (Million) Forecast, by Application 2019 & 2032
- Table 8: Canada Eye Cancer Industry Revenue (Million) Forecast, by Application 2019 & 2032
- Table 9: Mexico Eye Cancer Industry Revenue (Million) Forecast, by Application 2019 & 2032
- Table 10: Global Eye Cancer Industry Revenue Million Forecast, by Country 2019 & 2032
- Table 11: Germany Eye Cancer Industry Revenue (Million) Forecast, by Application 2019 & 2032
- Table 12: United Kingdom Eye Cancer Industry Revenue (Million) Forecast, by Application 2019 & 2032
- Table 13: France Eye Cancer Industry Revenue (Million) Forecast, by Application 2019 & 2032
- Table 14: Italy Eye Cancer Industry Revenue (Million) Forecast, by Application 2019 & 2032
- Table 15: Spain Eye Cancer Industry Revenue (Million) Forecast, by Application 2019 & 2032
- Table 16: Rest of Europe Eye Cancer Industry Revenue (Million) Forecast, by Application 2019 & 2032
- Table 17: Global Eye Cancer Industry Revenue Million Forecast, by Country 2019 & 2032
- Table 18: China Eye Cancer Industry Revenue (Million) Forecast, by Application 2019 & 2032
- Table 19: Japan Eye Cancer Industry Revenue (Million) Forecast, by Application 2019 & 2032
- Table 20: India Eye Cancer Industry Revenue (Million) Forecast, by Application 2019 & 2032
- Table 21: Australia Eye Cancer Industry Revenue (Million) Forecast, by Application 2019 & 2032
- Table 22: South Korea Eye Cancer Industry Revenue (Million) Forecast, by Application 2019 & 2032
- Table 23: Rest of Asia Pacific Eye Cancer Industry Revenue (Million) Forecast, by Application 2019 & 2032
- Table 24: Global Eye Cancer Industry Revenue Million Forecast, by Country 2019 & 2032
- Table 25: GCC Eye Cancer Industry Revenue (Million) Forecast, by Application 2019 & 2032
- Table 26: South Africa Eye Cancer Industry Revenue (Million) Forecast, by Application 2019 & 2032
- Table 27: Rest of Middle East and Africa Eye Cancer Industry Revenue (Million) Forecast, by Application 2019 & 2032
- Table 28: Global Eye Cancer Industry Revenue Million Forecast, by Country 2019 & 2032
- Table 29: Brazil Eye Cancer Industry Revenue (Million) Forecast, by Application 2019 & 2032
- Table 30: Argentina Eye Cancer Industry Revenue (Million) Forecast, by Application 2019 & 2032
- Table 31: Rest of South America Eye Cancer Industry Revenue (Million) Forecast, by Application 2019 & 2032
- Table 32: Global Eye Cancer Industry Revenue Million Forecast, by Treatment Type 2019 & 2032
- Table 33: Global Eye Cancer Industry Revenue Million Forecast, by Type of Retinoblastoma 2019 & 2032
- Table 34: Global Eye Cancer Industry Revenue Million Forecast, by Type of Staging 2019 & 2032
- Table 35: Global Eye Cancer Industry Revenue Million Forecast, by Country 2019 & 2032
- Table 36: United States Eye Cancer Industry Revenue (Million) Forecast, by Application 2019 & 2032
- Table 37: Canada Eye Cancer Industry Revenue (Million) Forecast, by Application 2019 & 2032
- Table 38: Mexico Eye Cancer Industry Revenue (Million) Forecast, by Application 2019 & 2032
- Table 39: Global Eye Cancer Industry Revenue Million Forecast, by Treatment Type 2019 & 2032
- Table 40: Global Eye Cancer Industry Revenue Million Forecast, by Type of Retinoblastoma 2019 & 2032
- Table 41: Global Eye Cancer Industry Revenue Million Forecast, by Type of Staging 2019 & 2032
- Table 42: Global Eye Cancer Industry Revenue Million Forecast, by Country 2019 & 2032
- Table 43: Germany Eye Cancer Industry Revenue (Million) Forecast, by Application 2019 & 2032
- Table 44: United Kingdom Eye Cancer Industry Revenue (Million) Forecast, by Application 2019 & 2032
- Table 45: France Eye Cancer Industry Revenue (Million) Forecast, by Application 2019 & 2032
- Table 46: Italy Eye Cancer Industry Revenue (Million) Forecast, by Application 2019 & 2032
- Table 47: Spain Eye Cancer Industry Revenue (Million) Forecast, by Application 2019 & 2032
- Table 48: Rest of Europe Eye Cancer Industry Revenue (Million) Forecast, by Application 2019 & 2032
- Table 49: Global Eye Cancer Industry Revenue Million Forecast, by Treatment Type 2019 & 2032
- Table 50: Global Eye Cancer Industry Revenue Million Forecast, by Type of Retinoblastoma 2019 & 2032
- Table 51: Global Eye Cancer Industry Revenue Million Forecast, by Type of Staging 2019 & 2032
- Table 52: Global Eye Cancer Industry Revenue Million Forecast, by Country 2019 & 2032
- Table 53: China Eye Cancer Industry Revenue (Million) Forecast, by Application 2019 & 2032
- Table 54: Japan Eye Cancer Industry Revenue (Million) Forecast, by Application 2019 & 2032
- Table 55: India Eye Cancer Industry Revenue (Million) Forecast, by Application 2019 & 2032
- Table 56: Australia Eye Cancer Industry Revenue (Million) Forecast, by Application 2019 & 2032
- Table 57: South Korea Eye Cancer Industry Revenue (Million) Forecast, by Application 2019 & 2032
- Table 58: Rest of Asia Pacific Eye Cancer Industry Revenue (Million) Forecast, by Application 2019 & 2032
- Table 59: Global Eye Cancer Industry Revenue Million Forecast, by Treatment Type 2019 & 2032
- Table 60: Global Eye Cancer Industry Revenue Million Forecast, by Type of Retinoblastoma 2019 & 2032
- Table 61: Global Eye Cancer Industry Revenue Million Forecast, by Type of Staging 2019 & 2032
- Table 62: Global Eye Cancer Industry Revenue Million Forecast, by Country 2019 & 2032
- Table 63: GCC Eye Cancer Industry Revenue (Million) Forecast, by Application 2019 & 2032
- Table 64: South Africa Eye Cancer Industry Revenue (Million) Forecast, by Application 2019 & 2032
- Table 65: Rest of Middle East and Africa Eye Cancer Industry Revenue (Million) Forecast, by Application 2019 & 2032
- Table 66: Global Eye Cancer Industry Revenue Million Forecast, by Treatment Type 2019 & 2032
- Table 67: Global Eye Cancer Industry Revenue Million Forecast, by Type of Retinoblastoma 2019 & 2032
- Table 68: Global Eye Cancer Industry Revenue Million Forecast, by Type of Staging 2019 & 2032
- Table 69: Global Eye Cancer Industry Revenue Million Forecast, by Country 2019 & 2032
- Table 70: Brazil Eye Cancer Industry Revenue (Million) Forecast, by Application 2019 & 2032
- Table 71: Argentina Eye Cancer Industry Revenue (Million) Forecast, by Application 2019 & 2032
- Table 72: Rest of South America Eye Cancer Industry Revenue (Million) Forecast, by Application 2019 & 2032
Frequently Asked Questions
1. What is the projected Compound Annual Growth Rate (CAGR) of the Eye Cancer Industry?
The projected CAGR is approximately 4.45%.
2. Which companies are prominent players in the Eye Cancer Industry?
Key companies in the market include Cellceutix Corporation, Novartis AG, Cadila Pharmaceuticals, Icon Bioscience, GlaxoSmithKline plc, Teva Pharmaceutical Industries Ltd, Johnson & Johnson, RXi Pharmaceuticals*List Not Exhaustive, Merck & Co, Baxter International Inc, Bristol-Myers Squibb Company, Pfizer Inc.
3. What are the main segments of the Eye Cancer Industry?
The market segments include Treatment Type, Type of Retinoblastoma, Type of Staging.
4. Can you provide details about the market size?
The market size is estimated to be USD 1.85 Million as of 2022.
5. What are some drivers contributing to market growth?
Remission and the Chance of Recurrence of Retinoblastoma; Increasing Public Awareness on Retinoblastoma.
6. What are the notable trends driving market growth?
Non-hereditary Retinoblastoma is Expected to hold a Significant Market Share Over the Forecast Period.
7. Are there any restraints impacting market growth?
Side Effects of Retinoblastoma Surgery and High Cost of Treatment in Developing Countries.
8. Can you provide examples of recent developments in the market?
September 2022: researchers at UT Southwestern and the University of Miami discovered a molecule, estrogen-related receptor gamma, or ESRRG that is hyperactive and promotes tumor cell survival in retinoblastoma. Blocking ESRRG, the team reported in Science Advances, kills retinoblastoma cells.
9. What pricing options are available for accessing the report?
Pricing options include single-user, multi-user, and enterprise licenses priced at USD 4750, USD 5250, and USD 8750 respectively.
10. Is the market size provided in terms of value or volume?
The market size is provided in terms of value, measured in Million.
11. Are there any specific market keywords associated with the report?
Yes, the market keyword associated with the report is "Eye Cancer Industry," which aids in identifying and referencing the specific market segment covered.
12. How do I determine which pricing option suits my needs best?
The pricing options vary based on user requirements and access needs. Individual users may opt for single-user licenses, while businesses requiring broader access may choose multi-user or enterprise licenses for cost-effective access to the report.
13. Are there any additional resources or data provided in the Eye Cancer Industry report?
While the report offers comprehensive insights, it's advisable to review the specific contents or supplementary materials provided to ascertain if additional resources or data are available.
14. How can I stay updated on further developments or reports in the Eye Cancer Industry?
To stay informed about further developments, trends, and reports in the Eye Cancer Industry, consider subscribing to industry newsletters, following relevant companies and organizations, or regularly checking reputable industry news sources and publications.
Methodology
Step 1 - Identification of Relevant Samples Size from Population Database


Step 2 - Approaches for Defining Global Market Size (Value, Volume* & Price*)

Note*: In applicable scenarios
Step 3 - Data Sources
Primary Research
- Web Analytics
- Survey Reports
- Research Institute
- Latest Research Reports
- Opinion Leaders
Secondary Research
- Annual Reports
- White Paper
- Latest Press Release
- Industry Association
- Paid Database
- Investor Presentations

Step 4 - Data Triangulation
Involves using different sources of information in order to increase the validity of a study
These sources are likely to be stakeholders in a program - participants, other researchers, program staff, other community members, and so on.
Then we put all data in single framework & apply various statistical tools to find out the dynamic on the market.
During the analysis stage, feedback from the stakeholder groups would be compared to determine areas of agreement as well as areas of divergence
