

Key Insights
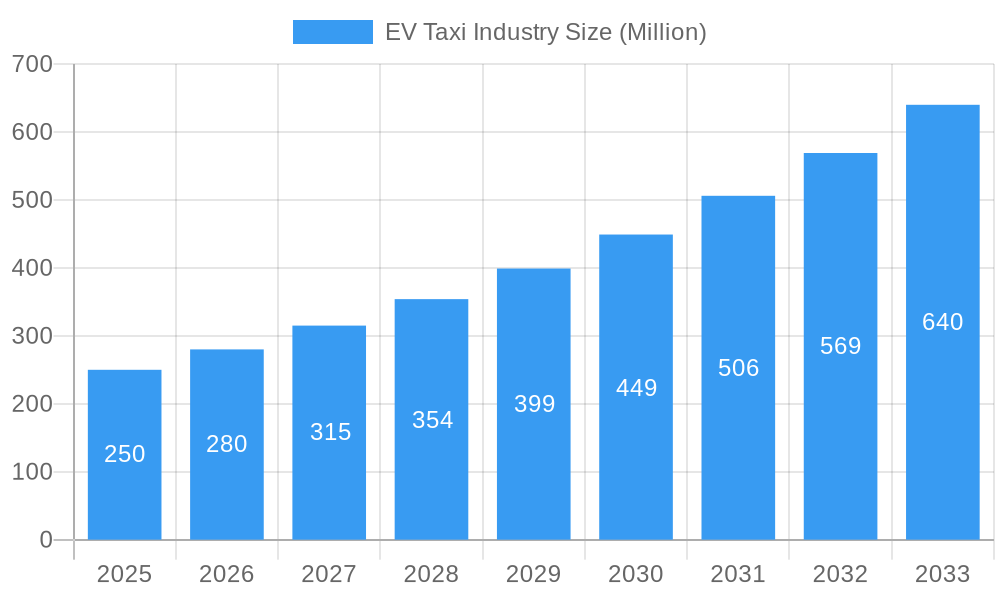
The Electric Vehicle (EV) taxi market is poised for significant expansion, driven by heightened environmental consciousness, supportive government initiatives, and declining battery costs. With an estimated market size of $29.54 billion in the base year 2025, the market is projected to grow at a Compound Annual Growth Rate (CAGR) of 25.56% from 2025 to 2033. Key growth drivers include increasing urban air pollution concerns prompting cleaner transport solutions, substantial government subsidies and tax incentives for EV adoption, and advancements in battery technology improving range and charging times. The market is segmented by vehicle type (two-wheelers and four-wheelers) and powertrain (hybrid and battery electric).
EV Taxi Industry Market Size (In Billion)
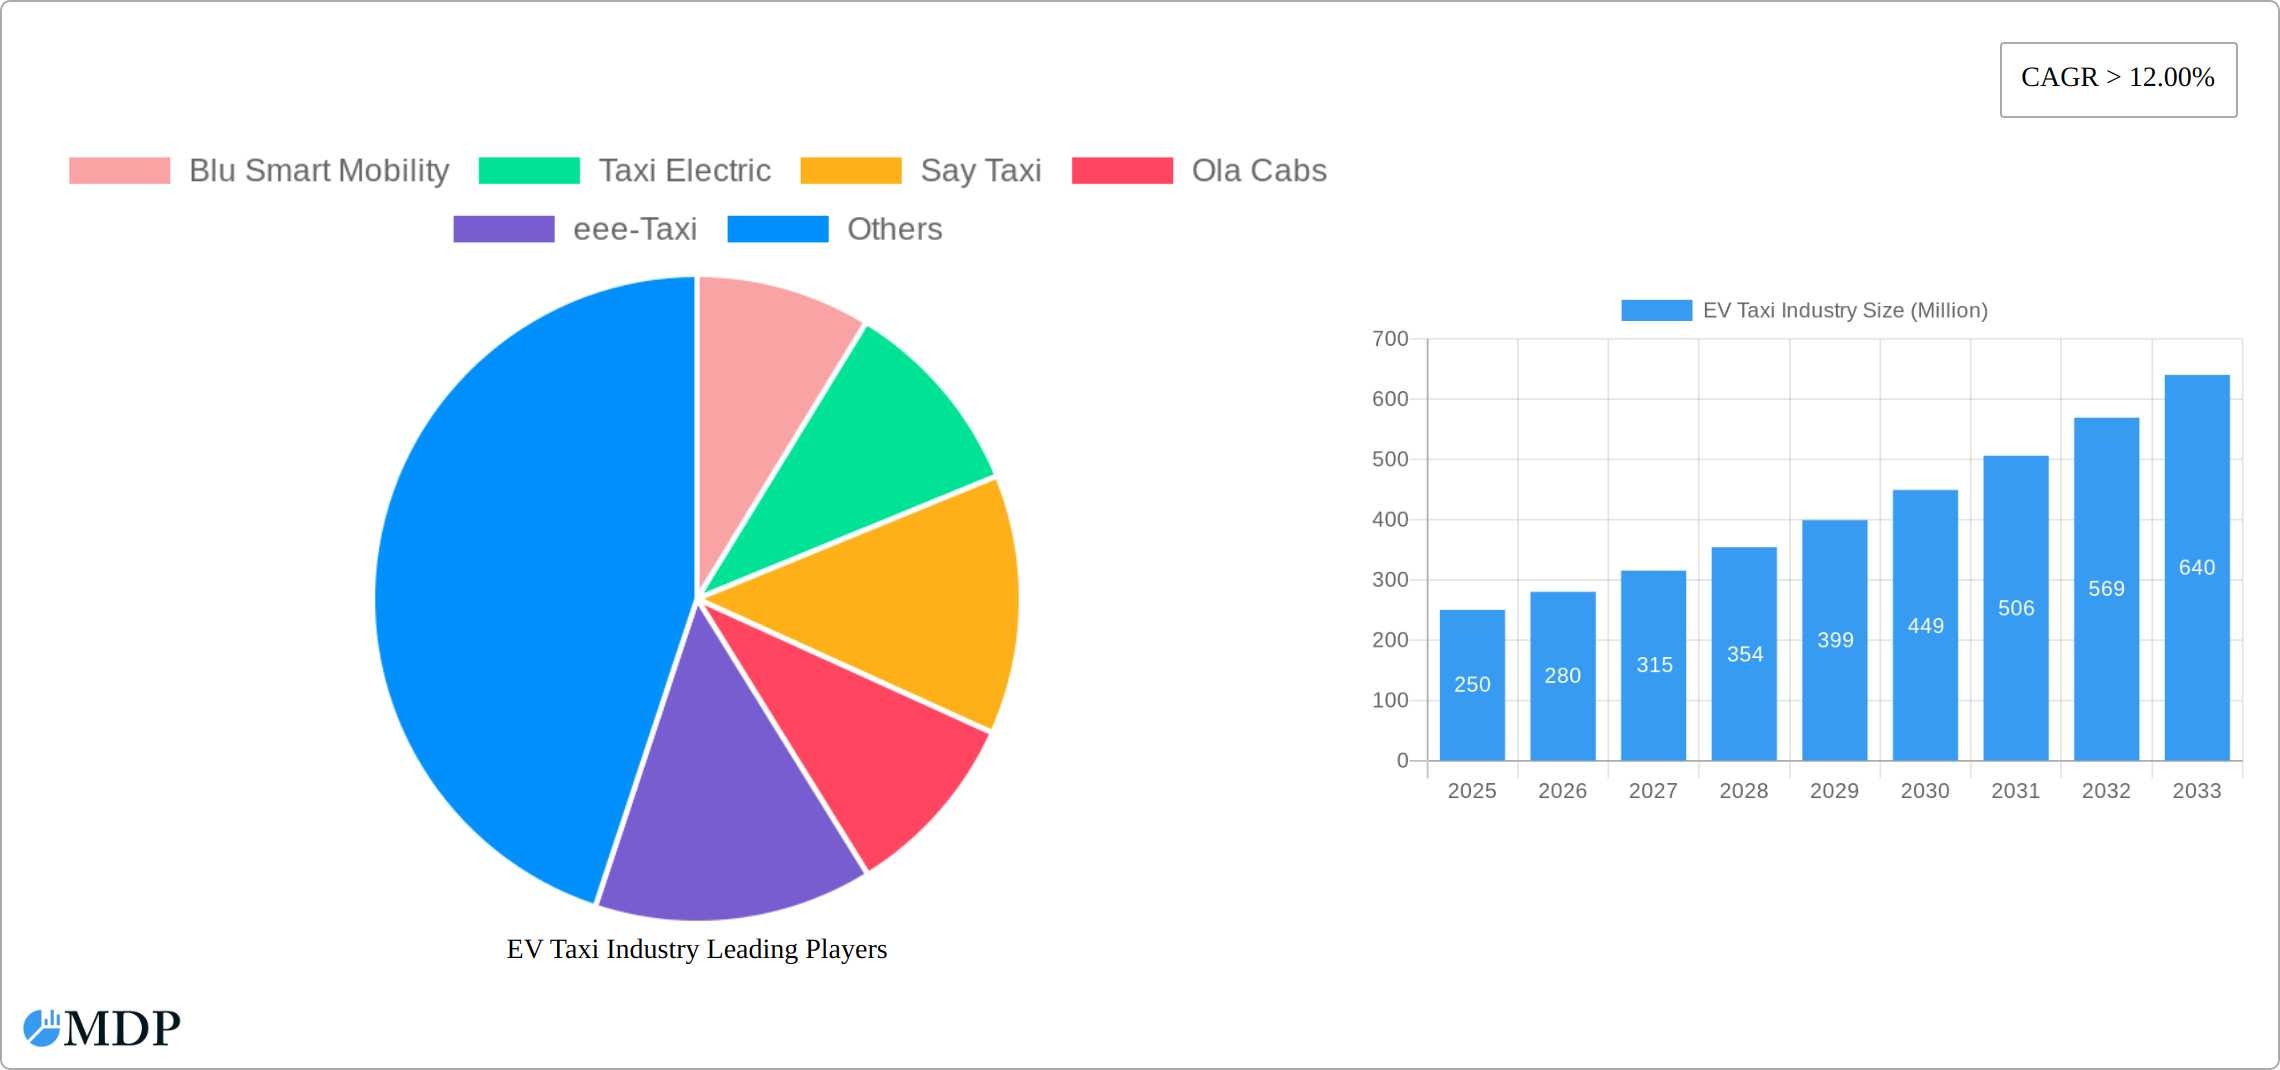
The competitive landscape features prominent players such as Ola Cabs and Uber, alongside dedicated EV taxi services including Blu Smart Mobility and Taxi Electric. Geographically, North America and Europe are leading adoption due to robust regulations and consumer awareness, while Asia-Pacific, particularly India and China, is anticipated to experience substantial growth fueled by urbanization and a growing middle class. Challenges such as high initial EV costs, charging infrastructure gaps, and varying government support will require strategic navigation to sustain projected market growth.
EV Taxi Industry Company Market Share
Revolutionizing Rides: A Comprehensive Report on the Explosive Growth of the EV Taxi Industry (2019-2033)
This in-depth report provides a comprehensive analysis of the burgeoning Electric Vehicle (EV) Taxi industry, projecting a market value exceeding $XX Million by 2033. Uncover critical insights into market dynamics, technological advancements, leading players, and future growth opportunities. This report is essential for investors, industry stakeholders, and anyone seeking to navigate this rapidly evolving sector. We delve into key segments including Hybrid Electric Vehicles (HEVs) and Battery Electric Vehicles (BEVs), across two-wheeler and four-wheeler taxi types. The study period covers 2019-2033, with a base year of 2025 and a forecast period of 2025-2033.
EV Taxi Industry Market Dynamics & Concentration
This section analyzes the competitive landscape of the EV taxi industry, examining market concentration, innovation drivers, regulatory frameworks, and other influential factors. We explore the impact of mergers and acquisitions (M&A) activities, providing insights into market share distribution and deal counts. The global EV taxi market witnessed significant M&A activity in the historical period (2019-2024), with approximately xx deals recorded. This consolidation is expected to continue, driven by the need for scale and technological advancements. Major players like Ola Cabs and Uber are actively shaping the market through strategic investments and expansions. The market share is currently dominated by a few key players, with Ola Cabs holding an estimated xx% market share in 2025, followed by Uber with xx% and Blu Smart Mobility with xx%. The industry is characterized by intense competition, fuelled by technological innovation and evolving consumer preferences. Regulatory frameworks, particularly those related to emissions standards and charging infrastructure, are significantly impacting market dynamics. The emergence of new entrants and the adoption of alternative fuel vehicles represent substantial disruptive forces within the market.
EV Taxi Industry Industry Trends & Analysis
The global EV taxi market is undergoing a transformative period, marked by exponential growth fueled by a confluence of powerful factors. Significant advancements in battery technology are continuously extending vehicle range and reducing charging times. Simultaneously, the expansion of accessible and rapid charging infrastructure is alleviating range anxiety for both drivers and passengers. The increasing affordability of electric vehicles, coupled with growing consumer demand for sustainable and eco-friendly transportation alternatives, are powerful market drivers. We are observing a decisive shift towards Battery Electric Vehicles (BEVs) dominating the market over Hybrid Electric Vehicles (HEVs). Our projections indicate a robust Compound Annual Growth Rate (CAGR) of [Insert Projected CAGR Here]% for the forecast period of 2025-2033. This impressive trajectory is further bolstered by proactive government initiatives, including substantial subsidies, tax incentives, and favorable regulatory frameworks that actively promote EV adoption. The competitive landscape is intensifying, with established players strategically adapting to disruptive innovations and new entrants introducing novel business models and cutting-edge technologies. By 2033, EV taxis are projected to capture a significant market share, estimated at [Insert Projected Market Share Here]%. Success in this evolving market will hinge on competitive pricing, superior service quality, distinct technological differentiation, and strong brand recognition.
Leading Markets & Segments in EV Taxi Industry
The Asia-Pacific region is currently the dominant market for EV taxis, driven by strong government support, increasing urbanization, and a growing middle class. Within this region, India and China are leading the charge, exhibiting significant growth.
Key Drivers:
- Favorable Government Policies: Substantial subsidies and tax breaks are incentivizing EV adoption.
- Rapid Urbanization: Increased population density fuels the demand for efficient transportation solutions.
- Growing Middle Class: Rising disposable incomes contribute to increased spending on transportation services.
- Technological Advancements: Cost reductions in battery technology and improvements in charging infrastructure are facilitating wider adoption.
Segment Dominance:
- Four-Wheeler Taxis: This segment currently holds the largest market share due to higher passenger capacity and greater comfort.
- Battery Electric Vehicles (BEVs): BEVs are gaining traction rapidly, surpassing HEVs in terms of market share due to superior efficiency and lower running costs.
A detailed analysis of market dominance within each segment (HEV vs BEV, two-wheeler vs four-wheeler) across key regions is included in the full report.
EV Taxi Industry Product Developments
Product development in the EV taxi sector is laser-focused on optimizing vehicle performance, expanding operational range, accelerating charging capabilities, and elevating the overall passenger experience. Key innovations include the integration of next-generation battery chemistries, the deployment of more efficient and widespread charging solutions, and the incorporation of intelligent onboard systems for sophisticated route optimization and dynamic energy management. The industry is witnessing a strong emphasis on developing more refined and user-centric in-vehicle technologies that enhance passenger comfort, connectivity, and safety. These advancements are crucial for establishing a competitive edge by delivering superior vehicle performance, unwavering reliability, and demonstrable cost-effectiveness to operators.
Key Drivers of EV Taxi Industry Growth
The rapid expansion of the EV taxi industry is propelled by a dynamic interplay of critical factors. Foremost among these are technological advancements in battery technology, leading to enhanced energy density, faster charging, and extended vehicle lifespan. Complementing these are robust government policies and regulations mandating emission reductions, offering substantial financial incentives for EV procurement, and supporting the build-out of charging infrastructure. Furthermore, a heightened global awareness of environmental challenges and a pronounced consumer preference for sustainable and cleaner transportation options are significantly influencing demand for EV taxi services.
Challenges in the EV Taxi Industry Market
Despite significant growth potential, the EV taxi industry faces several challenges. The high initial investment cost of EVs, coupled with potential range anxiety and limited charging infrastructure in certain regions, pose significant barriers to entry. Supply chain disruptions, particularly related to battery materials, can impact production and availability. Furthermore, intense competition among established players and new entrants adds pressure on profit margins. These factors could collectively impact the market growth negatively to an extent of xx%.
Emerging Opportunities in EV Taxi Industry
The long-term growth trajectory of the EV taxi industry is significantly influenced by a range of exciting emerging opportunities. Breakthroughs in solid-state battery technology, the integration of advanced autonomous driving systems, and the continuous evolution of ultra-fast charging infrastructure are poised to fundamentally reshape the sector. The formation of strategic alliances between EV manufacturers, charging network operators, and leading ride-hailing platforms will foster synergistic growth and create new service ecosystems. Moreover, significant expansion potential lies in entering new geographic markets, particularly in densely populated developing nations where public transportation infrastructure may be underdeveloped, presenting a substantial opportunity for widespread EV taxi adoption.
Leading Players in the EV Taxi Industry Sector
- Blu Smart Mobility
- Taxi Electric
- Say Taxi
- Ola Cabs
- eee-Taxi
- Connexxion
- Uber
- Prakrit
Key Milestones in EV Taxi Industry Industry
- 2020: Significant investments in EV taxi fleets by major players.
- 2021: Launch of government incentives to promote EV adoption.
- 2022: Introduction of new EV taxi models with enhanced range and features.
- 2023: Expansion of charging infrastructure networks in key cities.
- 2024: Increased partnerships between ride-hailing platforms and EV manufacturers.
Strategic Outlook for EV Taxi Industry Market
The future outlook for the EV taxi industry is exceptionally bright, characterized by sustained high growth potential. Ongoing technological innovations, coupled with continued strong governmental support and an ever-increasing consumer demand for environmentally conscious mobility, will be the primary engines of expansion. Strategic partnerships and the development of agile, innovative business models will be instrumental in defining the competitive landscape. The industry is on the cusp of substantial expansion, offering immense opportunities for both established market leaders and agile new entrants. Proactive and strategic investments in charging infrastructure, cutting-edge technology, and talent development are paramount for securing a dominant market position in this rapidly evolving and dynamic sector.
EV Taxi Industry Segmentation
-
1. Type
- 1.1. Hybrid Electric Vehicle
- 1.2. Battery Electric Vehicle
-
2. Vehicle Type
- 2.1. Two Wheeler Taxi
- 2.2. Four Wheeler Taxi
EV Taxi Industry Segmentation By Geography
- 1. United States
- 2. Canada
- 3. Rest of North America
- 4. Germany
- 5. United Kingdom
- 6. France
- 7. Italy
- 8. Rest of Europe
- 9. China
- 10. India
- 11. Japan
- 12. South Korea
- 13. Rest of Asia Pacific
- 14. Mexico
- 15. Brazil
- 16. United Arab Emirates
- 17. Other Countries
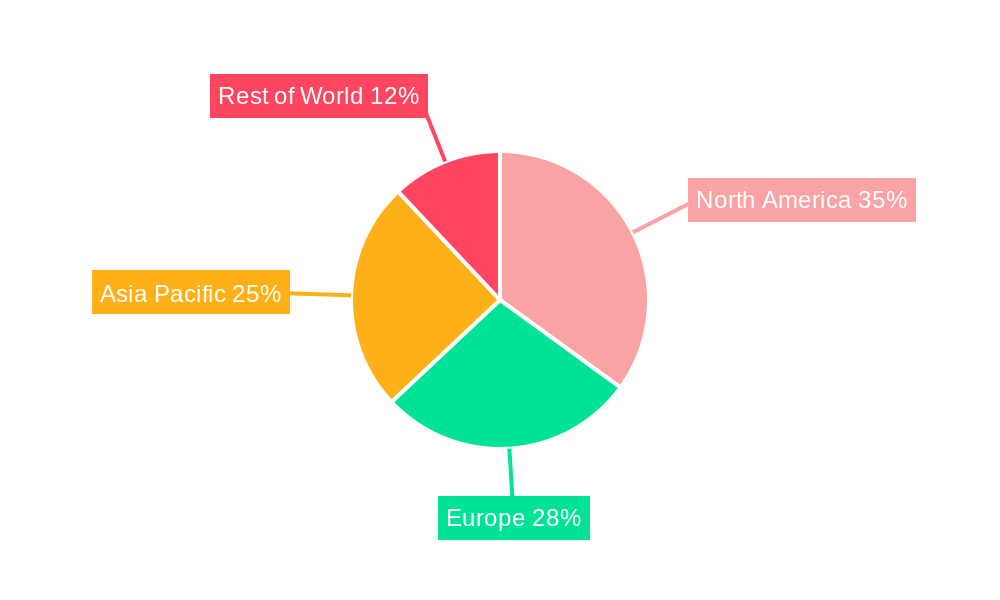
EV Taxi Industry Regional Market Share
Geographic Coverage of EV Taxi Industry
EV Taxi Industry REPORT HIGHLIGHTS
| Aspects | Details |
|---|---|
| Study Period | 2020-2034 |
| Base Year | 2025 |
| Estimated Year | 2026 |
| Forecast Period | 2026-2034 |
| Historical Period | 2020-2025 |
| Growth Rate | CAGR of 25.56% from 2020-2034 |
| Segmentation |
|
Table of Contents
- 1. Introduction
- 1.1. Research Scope
- 1.2. Market Segmentation
- 1.3. Research Methodology
- 1.4. Definitions and Assumptions
- 2. Executive Summary
- 2.1. Introduction
- 3. Market Dynamics
- 3.1. Introduction
- 3.2. Market Drivers
- 3.2.1. Government Policies to promote electric Vehicles Sales
- 3.3. Market Restrains
- 3.3.1. High Cost of Capital Expenditure for Electric Vehicle Infrastructure
- 3.4. Market Trends
- 3.4.1. Government Initiatives and Investment is Boosting the Demand
- 4. Market Factor Analysis
- 4.1. Porters Five Forces
- 4.2. Supply/Value Chain
- 4.3. PESTEL analysis
- 4.4. Market Entropy
- 4.5. Patent/Trademark Analysis
- 5. Global EV Taxi Industry Analysis, Insights and Forecast, 2020-2032
- 5.1. Market Analysis, Insights and Forecast - by Type
- 5.1.1. Hybrid Electric Vehicle
- 5.1.2. Battery Electric Vehicle
- 5.2. Market Analysis, Insights and Forecast - by Vehicle Type
- 5.2.1. Two Wheeler Taxi
- 5.2.2. Four Wheeler Taxi
- 5.3. Market Analysis, Insights and Forecast - by Region
- 5.3.1. United States
- 5.3.2. Canada
- 5.3.3. Rest of North America
- 5.3.4. Germany
- 5.3.5. United Kingdom
- 5.3.6. France
- 5.3.7. Italy
- 5.3.8. Rest of Europe
- 5.3.9. China
- 5.3.10. India
- 5.3.11. Japan
- 5.3.12. South Korea
- 5.3.13. Rest of Asia Pacific
- 5.3.14. Mexico
- 5.3.15. Brazil
- 5.3.16. United Arab Emirates
- 5.3.17. Other Countries
- 5.1. Market Analysis, Insights and Forecast - by Type
- 6. United States EV Taxi Industry Analysis, Insights and Forecast, 2020-2032
- 6.1. Market Analysis, Insights and Forecast - by Type
- 6.1.1. Hybrid Electric Vehicle
- 6.1.2. Battery Electric Vehicle
- 6.2. Market Analysis, Insights and Forecast - by Vehicle Type
- 6.2.1. Two Wheeler Taxi
- 6.2.2. Four Wheeler Taxi
- 6.1. Market Analysis, Insights and Forecast - by Type
- 7. Canada EV Taxi Industry Analysis, Insights and Forecast, 2020-2032
- 7.1. Market Analysis, Insights and Forecast - by Type
- 7.1.1. Hybrid Electric Vehicle
- 7.1.2. Battery Electric Vehicle
- 7.2. Market Analysis, Insights and Forecast - by Vehicle Type
- 7.2.1. Two Wheeler Taxi
- 7.2.2. Four Wheeler Taxi
- 7.1. Market Analysis, Insights and Forecast - by Type
- 8. Rest of North America EV Taxi Industry Analysis, Insights and Forecast, 2020-2032
- 8.1. Market Analysis, Insights and Forecast - by Type
- 8.1.1. Hybrid Electric Vehicle
- 8.1.2. Battery Electric Vehicle
- 8.2. Market Analysis, Insights and Forecast - by Vehicle Type
- 8.2.1. Two Wheeler Taxi
- 8.2.2. Four Wheeler Taxi
- 8.1. Market Analysis, Insights and Forecast - by Type
- 9. Germany EV Taxi Industry Analysis, Insights and Forecast, 2020-2032
- 9.1. Market Analysis, Insights and Forecast - by Type
- 9.1.1. Hybrid Electric Vehicle
- 9.1.2. Battery Electric Vehicle
- 9.2. Market Analysis, Insights and Forecast - by Vehicle Type
- 9.2.1. Two Wheeler Taxi
- 9.2.2. Four Wheeler Taxi
- 9.1. Market Analysis, Insights and Forecast - by Type
- 10. United Kingdom EV Taxi Industry Analysis, Insights and Forecast, 2020-2032
- 10.1. Market Analysis, Insights and Forecast - by Type
- 10.1.1. Hybrid Electric Vehicle
- 10.1.2. Battery Electric Vehicle
- 10.2. Market Analysis, Insights and Forecast - by Vehicle Type
- 10.2.1. Two Wheeler Taxi
- 10.2.2. Four Wheeler Taxi
- 10.1. Market Analysis, Insights and Forecast - by Type
- 11. France EV Taxi Industry Analysis, Insights and Forecast, 2020-2032
- 11.1. Market Analysis, Insights and Forecast - by Type
- 11.1.1. Hybrid Electric Vehicle
- 11.1.2. Battery Electric Vehicle
- 11.2. Market Analysis, Insights and Forecast - by Vehicle Type
- 11.2.1. Two Wheeler Taxi
- 11.2.2. Four Wheeler Taxi
- 11.1. Market Analysis, Insights and Forecast - by Type
- 12. Italy EV Taxi Industry Analysis, Insights and Forecast, 2020-2032
- 12.1. Market Analysis, Insights and Forecast - by Type
- 12.1.1. Hybrid Electric Vehicle
- 12.1.2. Battery Electric Vehicle
- 12.2. Market Analysis, Insights and Forecast - by Vehicle Type
- 12.2.1. Two Wheeler Taxi
- 12.2.2. Four Wheeler Taxi
- 12.1. Market Analysis, Insights and Forecast - by Type
- 13. Rest of Europe EV Taxi Industry Analysis, Insights and Forecast, 2020-2032
- 13.1. Market Analysis, Insights and Forecast - by Type
- 13.1.1. Hybrid Electric Vehicle
- 13.1.2. Battery Electric Vehicle
- 13.2. Market Analysis, Insights and Forecast - by Vehicle Type
- 13.2.1. Two Wheeler Taxi
- 13.2.2. Four Wheeler Taxi
- 13.1. Market Analysis, Insights and Forecast - by Type
- 14. China EV Taxi Industry Analysis, Insights and Forecast, 2020-2032
- 14.1. Market Analysis, Insights and Forecast - by Type
- 14.1.1. Hybrid Electric Vehicle
- 14.1.2. Battery Electric Vehicle
- 14.2. Market Analysis, Insights and Forecast - by Vehicle Type
- 14.2.1. Two Wheeler Taxi
- 14.2.2. Four Wheeler Taxi
- 14.1. Market Analysis, Insights and Forecast - by Type
- 15. India EV Taxi Industry Analysis, Insights and Forecast, 2020-2032
- 15.1. Market Analysis, Insights and Forecast - by Type
- 15.1.1. Hybrid Electric Vehicle
- 15.1.2. Battery Electric Vehicle
- 15.2. Market Analysis, Insights and Forecast - by Vehicle Type
- 15.2.1. Two Wheeler Taxi
- 15.2.2. Four Wheeler Taxi
- 15.1. Market Analysis, Insights and Forecast - by Type
- 16. Japan EV Taxi Industry Analysis, Insights and Forecast, 2020-2032
- 16.1. Market Analysis, Insights and Forecast - by Type
- 16.1.1. Hybrid Electric Vehicle
- 16.1.2. Battery Electric Vehicle
- 16.2. Market Analysis, Insights and Forecast - by Vehicle Type
- 16.2.1. Two Wheeler Taxi
- 16.2.2. Four Wheeler Taxi
- 16.1. Market Analysis, Insights and Forecast - by Type
- 17. South Korea EV Taxi Industry Analysis, Insights and Forecast, 2020-2032
- 17.1. Market Analysis, Insights and Forecast - by Type
- 17.1.1. Hybrid Electric Vehicle
- 17.1.2. Battery Electric Vehicle
- 17.2. Market Analysis, Insights and Forecast - by Vehicle Type
- 17.2.1. Two Wheeler Taxi
- 17.2.2. Four Wheeler Taxi
- 17.1. Market Analysis, Insights and Forecast - by Type
- 18. Rest of Asia Pacific EV Taxi Industry Analysis, Insights and Forecast, 2020-2032
- 18.1. Market Analysis, Insights and Forecast - by Type
- 18.1.1. Hybrid Electric Vehicle
- 18.1.2. Battery Electric Vehicle
- 18.2. Market Analysis, Insights and Forecast - by Vehicle Type
- 18.2.1. Two Wheeler Taxi
- 18.2.2. Four Wheeler Taxi
- 18.1. Market Analysis, Insights and Forecast - by Type
- 19. Mexico EV Taxi Industry Analysis, Insights and Forecast, 2020-2032
- 19.1. Market Analysis, Insights and Forecast - by Type
- 19.1.1. Hybrid Electric Vehicle
- 19.1.2. Battery Electric Vehicle
- 19.2. Market Analysis, Insights and Forecast - by Vehicle Type
- 19.2.1. Two Wheeler Taxi
- 19.2.2. Four Wheeler Taxi
- 19.1. Market Analysis, Insights and Forecast - by Type
- 20. Brazil EV Taxi Industry Analysis, Insights and Forecast, 2020-2032
- 20.1. Market Analysis, Insights and Forecast - by Type
- 20.1.1. Hybrid Electric Vehicle
- 20.1.2. Battery Electric Vehicle
- 20.2. Market Analysis, Insights and Forecast - by Vehicle Type
- 20.2.1. Two Wheeler Taxi
- 20.2.2. Four Wheeler Taxi
- 20.1. Market Analysis, Insights and Forecast - by Type
- 21. United Arab Emirates EV Taxi Industry Analysis, Insights and Forecast, 2020-2032
- 21.1. Market Analysis, Insights and Forecast - by Type
- 21.1.1. Hybrid Electric Vehicle
- 21.1.2. Battery Electric Vehicle
- 21.2. Market Analysis, Insights and Forecast - by Vehicle Type
- 21.2.1. Two Wheeler Taxi
- 21.2.2. Four Wheeler Taxi
- 21.1. Market Analysis, Insights and Forecast - by Type
- 22. Other Countries EV Taxi Industry Analysis, Insights and Forecast, 2020-2032
- 22.1. Market Analysis, Insights and Forecast - by Type
- 22.1.1. Hybrid Electric Vehicle
- 22.1.2. Battery Electric Vehicle
- 22.2. Market Analysis, Insights and Forecast - by Vehicle Type
- 22.2.1. Two Wheeler Taxi
- 22.2.2. Four Wheeler Taxi
- 22.1. Market Analysis, Insights and Forecast - by Type
- 23. Competitive Analysis
- 23.1. Global Market Share Analysis 2025
- 23.2. Company Profiles
- 23.2.1 Blu Smart Mobility
- 23.2.1.1. Overview
- 23.2.1.2. Products
- 23.2.1.3. SWOT Analysis
- 23.2.1.4. Recent Developments
- 23.2.1.5. Financials (Based on Availability)
- 23.2.2 Taxi Electric
- 23.2.2.1. Overview
- 23.2.2.2. Products
- 23.2.2.3. SWOT Analysis
- 23.2.2.4. Recent Developments
- 23.2.2.5. Financials (Based on Availability)
- 23.2.3 Say Taxi
- 23.2.3.1. Overview
- 23.2.3.2. Products
- 23.2.3.3. SWOT Analysis
- 23.2.3.4. Recent Developments
- 23.2.3.5. Financials (Based on Availability)
- 23.2.4 Ola Cabs
- 23.2.4.1. Overview
- 23.2.4.2. Products
- 23.2.4.3. SWOT Analysis
- 23.2.4.4. Recent Developments
- 23.2.4.5. Financials (Based on Availability)
- 23.2.5 eee-Taxi
- 23.2.5.1. Overview
- 23.2.5.2. Products
- 23.2.5.3. SWOT Analysis
- 23.2.5.4. Recent Developments
- 23.2.5.5. Financials (Based on Availability)
- 23.2.6 Connexxion
- 23.2.6.1. Overview
- 23.2.6.2. Products
- 23.2.6.3. SWOT Analysis
- 23.2.6.4. Recent Developments
- 23.2.6.5. Financials (Based on Availability)
- 23.2.7 Uber
- 23.2.7.1. Overview
- 23.2.7.2. Products
- 23.2.7.3. SWOT Analysis
- 23.2.7.4. Recent Developments
- 23.2.7.5. Financials (Based on Availability)
- 23.2.8 Prakrit
- 23.2.8.1. Overview
- 23.2.8.2. Products
- 23.2.8.3. SWOT Analysis
- 23.2.8.4. Recent Developments
- 23.2.8.5. Financials (Based on Availability)
- 23.2.1 Blu Smart Mobility
List of Figures
- Figure 1: Global EV Taxi Industry Revenue Breakdown (billion, %) by Region 2025 & 2033
- Figure 2: United States EV Taxi Industry Revenue (billion), by Type 2025 & 2033
- Figure 3: United States EV Taxi Industry Revenue Share (%), by Type 2025 & 2033
- Figure 4: United States EV Taxi Industry Revenue (billion), by Vehicle Type 2025 & 2033
- Figure 5: United States EV Taxi Industry Revenue Share (%), by Vehicle Type 2025 & 2033
- Figure 6: United States EV Taxi Industry Revenue (billion), by Country 2025 & 2033
- Figure 7: United States EV Taxi Industry Revenue Share (%), by Country 2025 & 2033
- Figure 8: Canada EV Taxi Industry Revenue (billion), by Type 2025 & 2033
- Figure 9: Canada EV Taxi Industry Revenue Share (%), by Type 2025 & 2033
- Figure 10: Canada EV Taxi Industry Revenue (billion), by Vehicle Type 2025 & 2033
- Figure 11: Canada EV Taxi Industry Revenue Share (%), by Vehicle Type 2025 & 2033
- Figure 12: Canada EV Taxi Industry Revenue (billion), by Country 2025 & 2033
- Figure 13: Canada EV Taxi Industry Revenue Share (%), by Country 2025 & 2033
- Figure 14: Rest of North America EV Taxi Industry Revenue (billion), by Type 2025 & 2033
- Figure 15: Rest of North America EV Taxi Industry Revenue Share (%), by Type 2025 & 2033
- Figure 16: Rest of North America EV Taxi Industry Revenue (billion), by Vehicle Type 2025 & 2033
- Figure 17: Rest of North America EV Taxi Industry Revenue Share (%), by Vehicle Type 2025 & 2033
- Figure 18: Rest of North America EV Taxi Industry Revenue (billion), by Country 2025 & 2033
- Figure 19: Rest of North America EV Taxi Industry Revenue Share (%), by Country 2025 & 2033
- Figure 20: Germany EV Taxi Industry Revenue (billion), by Type 2025 & 2033
- Figure 21: Germany EV Taxi Industry Revenue Share (%), by Type 2025 & 2033
- Figure 22: Germany EV Taxi Industry Revenue (billion), by Vehicle Type 2025 & 2033
- Figure 23: Germany EV Taxi Industry Revenue Share (%), by Vehicle Type 2025 & 2033
- Figure 24: Germany EV Taxi Industry Revenue (billion), by Country 2025 & 2033
- Figure 25: Germany EV Taxi Industry Revenue Share (%), by Country 2025 & 2033
- Figure 26: United Kingdom EV Taxi Industry Revenue (billion), by Type 2025 & 2033
- Figure 27: United Kingdom EV Taxi Industry Revenue Share (%), by Type 2025 & 2033
- Figure 28: United Kingdom EV Taxi Industry Revenue (billion), by Vehicle Type 2025 & 2033
- Figure 29: United Kingdom EV Taxi Industry Revenue Share (%), by Vehicle Type 2025 & 2033
- Figure 30: United Kingdom EV Taxi Industry Revenue (billion), by Country 2025 & 2033
- Figure 31: United Kingdom EV Taxi Industry Revenue Share (%), by Country 2025 & 2033
- Figure 32: France EV Taxi Industry Revenue (billion), by Type 2025 & 2033
- Figure 33: France EV Taxi Industry Revenue Share (%), by Type 2025 & 2033
- Figure 34: France EV Taxi Industry Revenue (billion), by Vehicle Type 2025 & 2033
- Figure 35: France EV Taxi Industry Revenue Share (%), by Vehicle Type 2025 & 2033
- Figure 36: France EV Taxi Industry Revenue (billion), by Country 2025 & 2033
- Figure 37: France EV Taxi Industry Revenue Share (%), by Country 2025 & 2033
- Figure 38: Italy EV Taxi Industry Revenue (billion), by Type 2025 & 2033
- Figure 39: Italy EV Taxi Industry Revenue Share (%), by Type 2025 & 2033
- Figure 40: Italy EV Taxi Industry Revenue (billion), by Vehicle Type 2025 & 2033
- Figure 41: Italy EV Taxi Industry Revenue Share (%), by Vehicle Type 2025 & 2033
- Figure 42: Italy EV Taxi Industry Revenue (billion), by Country 2025 & 2033
- Figure 43: Italy EV Taxi Industry Revenue Share (%), by Country 2025 & 2033
- Figure 44: Rest of Europe EV Taxi Industry Revenue (billion), by Type 2025 & 2033
- Figure 45: Rest of Europe EV Taxi Industry Revenue Share (%), by Type 2025 & 2033
- Figure 46: Rest of Europe EV Taxi Industry Revenue (billion), by Vehicle Type 2025 & 2033
- Figure 47: Rest of Europe EV Taxi Industry Revenue Share (%), by Vehicle Type 2025 & 2033
- Figure 48: Rest of Europe EV Taxi Industry Revenue (billion), by Country 2025 & 2033
- Figure 49: Rest of Europe EV Taxi Industry Revenue Share (%), by Country 2025 & 2033
- Figure 50: China EV Taxi Industry Revenue (billion), by Type 2025 & 2033
- Figure 51: China EV Taxi Industry Revenue Share (%), by Type 2025 & 2033
- Figure 52: China EV Taxi Industry Revenue (billion), by Vehicle Type 2025 & 2033
- Figure 53: China EV Taxi Industry Revenue Share (%), by Vehicle Type 2025 & 2033
- Figure 54: China EV Taxi Industry Revenue (billion), by Country 2025 & 2033
- Figure 55: China EV Taxi Industry Revenue Share (%), by Country 2025 & 2033
- Figure 56: India EV Taxi Industry Revenue (billion), by Type 2025 & 2033
- Figure 57: India EV Taxi Industry Revenue Share (%), by Type 2025 & 2033
- Figure 58: India EV Taxi Industry Revenue (billion), by Vehicle Type 2025 & 2033
- Figure 59: India EV Taxi Industry Revenue Share (%), by Vehicle Type 2025 & 2033
- Figure 60: India EV Taxi Industry Revenue (billion), by Country 2025 & 2033
- Figure 61: India EV Taxi Industry Revenue Share (%), by Country 2025 & 2033
- Figure 62: Japan EV Taxi Industry Revenue (billion), by Type 2025 & 2033
- Figure 63: Japan EV Taxi Industry Revenue Share (%), by Type 2025 & 2033
- Figure 64: Japan EV Taxi Industry Revenue (billion), by Vehicle Type 2025 & 2033
- Figure 65: Japan EV Taxi Industry Revenue Share (%), by Vehicle Type 2025 & 2033
- Figure 66: Japan EV Taxi Industry Revenue (billion), by Country 2025 & 2033
- Figure 67: Japan EV Taxi Industry Revenue Share (%), by Country 2025 & 2033
- Figure 68: South Korea EV Taxi Industry Revenue (billion), by Type 2025 & 2033
- Figure 69: South Korea EV Taxi Industry Revenue Share (%), by Type 2025 & 2033
- Figure 70: South Korea EV Taxi Industry Revenue (billion), by Vehicle Type 2025 & 2033
- Figure 71: South Korea EV Taxi Industry Revenue Share (%), by Vehicle Type 2025 & 2033
- Figure 72: South Korea EV Taxi Industry Revenue (billion), by Country 2025 & 2033
- Figure 73: South Korea EV Taxi Industry Revenue Share (%), by Country 2025 & 2033
- Figure 74: Rest of Asia Pacific EV Taxi Industry Revenue (billion), by Type 2025 & 2033
- Figure 75: Rest of Asia Pacific EV Taxi Industry Revenue Share (%), by Type 2025 & 2033
- Figure 76: Rest of Asia Pacific EV Taxi Industry Revenue (billion), by Vehicle Type 2025 & 2033
- Figure 77: Rest of Asia Pacific EV Taxi Industry Revenue Share (%), by Vehicle Type 2025 & 2033
- Figure 78: Rest of Asia Pacific EV Taxi Industry Revenue (billion), by Country 2025 & 2033
- Figure 79: Rest of Asia Pacific EV Taxi Industry Revenue Share (%), by Country 2025 & 2033
- Figure 80: Mexico EV Taxi Industry Revenue (billion), by Type 2025 & 2033
- Figure 81: Mexico EV Taxi Industry Revenue Share (%), by Type 2025 & 2033
- Figure 82: Mexico EV Taxi Industry Revenue (billion), by Vehicle Type 2025 & 2033
- Figure 83: Mexico EV Taxi Industry Revenue Share (%), by Vehicle Type 2025 & 2033
- Figure 84: Mexico EV Taxi Industry Revenue (billion), by Country 2025 & 2033
- Figure 85: Mexico EV Taxi Industry Revenue Share (%), by Country 2025 & 2033
- Figure 86: Brazil EV Taxi Industry Revenue (billion), by Type 2025 & 2033
- Figure 87: Brazil EV Taxi Industry Revenue Share (%), by Type 2025 & 2033
- Figure 88: Brazil EV Taxi Industry Revenue (billion), by Vehicle Type 2025 & 2033
- Figure 89: Brazil EV Taxi Industry Revenue Share (%), by Vehicle Type 2025 & 2033
- Figure 90: Brazil EV Taxi Industry Revenue (billion), by Country 2025 & 2033
- Figure 91: Brazil EV Taxi Industry Revenue Share (%), by Country 2025 & 2033
- Figure 92: United Arab Emirates EV Taxi Industry Revenue (billion), by Type 2025 & 2033
- Figure 93: United Arab Emirates EV Taxi Industry Revenue Share (%), by Type 2025 & 2033
- Figure 94: United Arab Emirates EV Taxi Industry Revenue (billion), by Vehicle Type 2025 & 2033
- Figure 95: United Arab Emirates EV Taxi Industry Revenue Share (%), by Vehicle Type 2025 & 2033
- Figure 96: United Arab Emirates EV Taxi Industry Revenue (billion), by Country 2025 & 2033
- Figure 97: United Arab Emirates EV Taxi Industry Revenue Share (%), by Country 2025 & 2033
- Figure 98: Other Countries EV Taxi Industry Revenue (billion), by Type 2025 & 2033
- Figure 99: Other Countries EV Taxi Industry Revenue Share (%), by Type 2025 & 2033
- Figure 100: Other Countries EV Taxi Industry Revenue (billion), by Vehicle Type 2025 & 2033
- Figure 101: Other Countries EV Taxi Industry Revenue Share (%), by Vehicle Type 2025 & 2033
- Figure 102: Other Countries EV Taxi Industry Revenue (billion), by Country 2025 & 2033
- Figure 103: Other Countries EV Taxi Industry Revenue Share (%), by Country 2025 & 2033
List of Tables
- Table 1: Global EV Taxi Industry Revenue billion Forecast, by Type 2020 & 2033
- Table 2: Global EV Taxi Industry Revenue billion Forecast, by Vehicle Type 2020 & 2033
- Table 3: Global EV Taxi Industry Revenue billion Forecast, by Region 2020 & 2033
- Table 4: Global EV Taxi Industry Revenue billion Forecast, by Type 2020 & 2033
- Table 5: Global EV Taxi Industry Revenue billion Forecast, by Vehicle Type 2020 & 2033
- Table 6: Global EV Taxi Industry Revenue billion Forecast, by Country 2020 & 2033
- Table 7: Global EV Taxi Industry Revenue billion Forecast, by Type 2020 & 2033
- Table 8: Global EV Taxi Industry Revenue billion Forecast, by Vehicle Type 2020 & 2033
- Table 9: Global EV Taxi Industry Revenue billion Forecast, by Country 2020 & 2033
- Table 10: Global EV Taxi Industry Revenue billion Forecast, by Type 2020 & 2033
- Table 11: Global EV Taxi Industry Revenue billion Forecast, by Vehicle Type 2020 & 2033
- Table 12: Global EV Taxi Industry Revenue billion Forecast, by Country 2020 & 2033
- Table 13: Global EV Taxi Industry Revenue billion Forecast, by Type 2020 & 2033
- Table 14: Global EV Taxi Industry Revenue billion Forecast, by Vehicle Type 2020 & 2033
- Table 15: Global EV Taxi Industry Revenue billion Forecast, by Country 2020 & 2033
- Table 16: Global EV Taxi Industry Revenue billion Forecast, by Type 2020 & 2033
- Table 17: Global EV Taxi Industry Revenue billion Forecast, by Vehicle Type 2020 & 2033
- Table 18: Global EV Taxi Industry Revenue billion Forecast, by Country 2020 & 2033
- Table 19: Global EV Taxi Industry Revenue billion Forecast, by Type 2020 & 2033
- Table 20: Global EV Taxi Industry Revenue billion Forecast, by Vehicle Type 2020 & 2033
- Table 21: Global EV Taxi Industry Revenue billion Forecast, by Country 2020 & 2033
- Table 22: Global EV Taxi Industry Revenue billion Forecast, by Type 2020 & 2033
- Table 23: Global EV Taxi Industry Revenue billion Forecast, by Vehicle Type 2020 & 2033
- Table 24: Global EV Taxi Industry Revenue billion Forecast, by Country 2020 & 2033
- Table 25: Global EV Taxi Industry Revenue billion Forecast, by Type 2020 & 2033
- Table 26: Global EV Taxi Industry Revenue billion Forecast, by Vehicle Type 2020 & 2033
- Table 27: Global EV Taxi Industry Revenue billion Forecast, by Country 2020 & 2033
- Table 28: Global EV Taxi Industry Revenue billion Forecast, by Type 2020 & 2033
- Table 29: Global EV Taxi Industry Revenue billion Forecast, by Vehicle Type 2020 & 2033
- Table 30: Global EV Taxi Industry Revenue billion Forecast, by Country 2020 & 2033
- Table 31: Global EV Taxi Industry Revenue billion Forecast, by Type 2020 & 2033
- Table 32: Global EV Taxi Industry Revenue billion Forecast, by Vehicle Type 2020 & 2033
- Table 33: Global EV Taxi Industry Revenue billion Forecast, by Country 2020 & 2033
- Table 34: Global EV Taxi Industry Revenue billion Forecast, by Type 2020 & 2033
- Table 35: Global EV Taxi Industry Revenue billion Forecast, by Vehicle Type 2020 & 2033
- Table 36: Global EV Taxi Industry Revenue billion Forecast, by Country 2020 & 2033
- Table 37: Global EV Taxi Industry Revenue billion Forecast, by Type 2020 & 2033
- Table 38: Global EV Taxi Industry Revenue billion Forecast, by Vehicle Type 2020 & 2033
- Table 39: Global EV Taxi Industry Revenue billion Forecast, by Country 2020 & 2033
- Table 40: Global EV Taxi Industry Revenue billion Forecast, by Type 2020 & 2033
- Table 41: Global EV Taxi Industry Revenue billion Forecast, by Vehicle Type 2020 & 2033
- Table 42: Global EV Taxi Industry Revenue billion Forecast, by Country 2020 & 2033
- Table 43: Global EV Taxi Industry Revenue billion Forecast, by Type 2020 & 2033
- Table 44: Global EV Taxi Industry Revenue billion Forecast, by Vehicle Type 2020 & 2033
- Table 45: Global EV Taxi Industry Revenue billion Forecast, by Country 2020 & 2033
- Table 46: Global EV Taxi Industry Revenue billion Forecast, by Type 2020 & 2033
- Table 47: Global EV Taxi Industry Revenue billion Forecast, by Vehicle Type 2020 & 2033
- Table 48: Global EV Taxi Industry Revenue billion Forecast, by Country 2020 & 2033
- Table 49: Global EV Taxi Industry Revenue billion Forecast, by Type 2020 & 2033
- Table 50: Global EV Taxi Industry Revenue billion Forecast, by Vehicle Type 2020 & 2033
- Table 51: Global EV Taxi Industry Revenue billion Forecast, by Country 2020 & 2033
- Table 52: Global EV Taxi Industry Revenue billion Forecast, by Type 2020 & 2033
- Table 53: Global EV Taxi Industry Revenue billion Forecast, by Vehicle Type 2020 & 2033
- Table 54: Global EV Taxi Industry Revenue billion Forecast, by Country 2020 & 2033
Frequently Asked Questions
1. What is the projected Compound Annual Growth Rate (CAGR) of the EV Taxi Industry?
The projected CAGR is approximately 25.56%.
2. Which companies are prominent players in the EV Taxi Industry?
Key companies in the market include Blu Smart Mobility, Taxi Electric, Say Taxi, Ola Cabs, eee-Taxi, Connexxion, Uber, Prakrit.
3. What are the main segments of the EV Taxi Industry?
The market segments include Type, Vehicle Type.
4. Can you provide details about the market size?
The market size is estimated to be USD 29.54 billion as of 2022.
5. What are some drivers contributing to market growth?
Government Policies to promote electric Vehicles Sales.
6. What are the notable trends driving market growth?
Government Initiatives and Investment is Boosting the Demand.
7. Are there any restraints impacting market growth?
High Cost of Capital Expenditure for Electric Vehicle Infrastructure.
8. Can you provide examples of recent developments in the market?
N/A
9. What pricing options are available for accessing the report?
Pricing options include single-user, multi-user, and enterprise licenses priced at USD 4750, USD 5250, and USD 8750 respectively.
10. Is the market size provided in terms of value or volume?
The market size is provided in terms of value, measured in billion.
11. Are there any specific market keywords associated with the report?
Yes, the market keyword associated with the report is "EV Taxi Industry," which aids in identifying and referencing the specific market segment covered.
12. How do I determine which pricing option suits my needs best?
The pricing options vary based on user requirements and access needs. Individual users may opt for single-user licenses, while businesses requiring broader access may choose multi-user or enterprise licenses for cost-effective access to the report.
13. Are there any additional resources or data provided in the EV Taxi Industry report?
While the report offers comprehensive insights, it's advisable to review the specific contents or supplementary materials provided to ascertain if additional resources or data are available.
14. How can I stay updated on further developments or reports in the EV Taxi Industry?
To stay informed about further developments, trends, and reports in the EV Taxi Industry, consider subscribing to industry newsletters, following relevant companies and organizations, or regularly checking reputable industry news sources and publications.
Methodology
Step 1 - Identification of Relevant Samples Size from Population Database


Step 2 - Approaches for Defining Global Market Size (Value, Volume* & Price*)

Note*: In applicable scenarios
Step 3 - Data Sources
Primary Research
- Web Analytics
- Survey Reports
- Research Institute
- Latest Research Reports
- Opinion Leaders
Secondary Research
- Annual Reports
- White Paper
- Latest Press Release
- Industry Association
- Paid Database
- Investor Presentations

Step 4 - Data Triangulation
Involves using different sources of information in order to increase the validity of a study
These sources are likely to be stakeholders in a program - participants, other researchers, program staff, other community members, and so on.
Then we put all data in single framework & apply various statistical tools to find out the dynamic on the market.
During the analysis stage, feedback from the stakeholder groups would be compared to determine areas of agreement as well as areas of divergence