

Key Insights
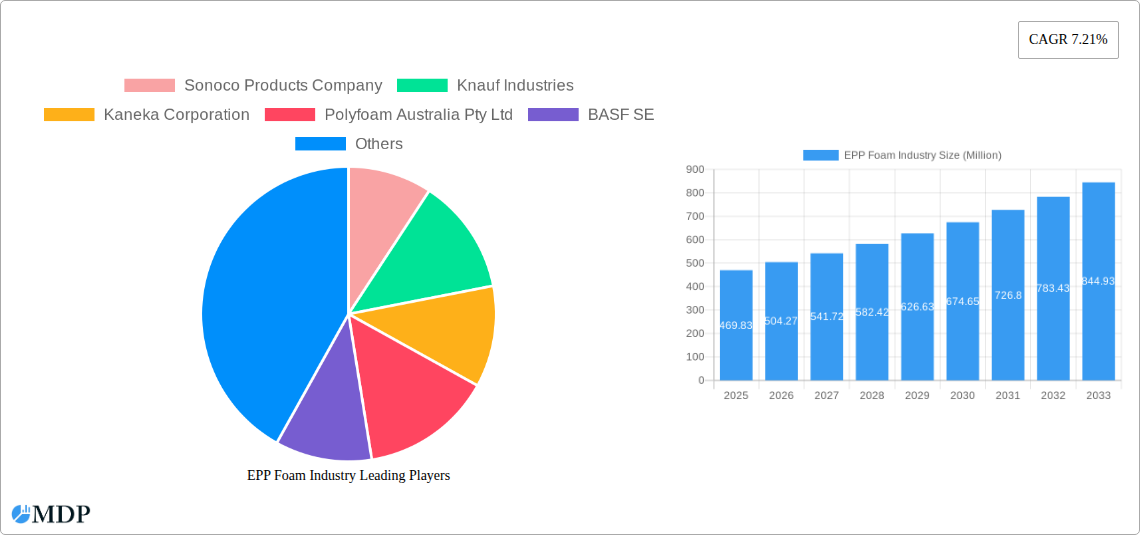
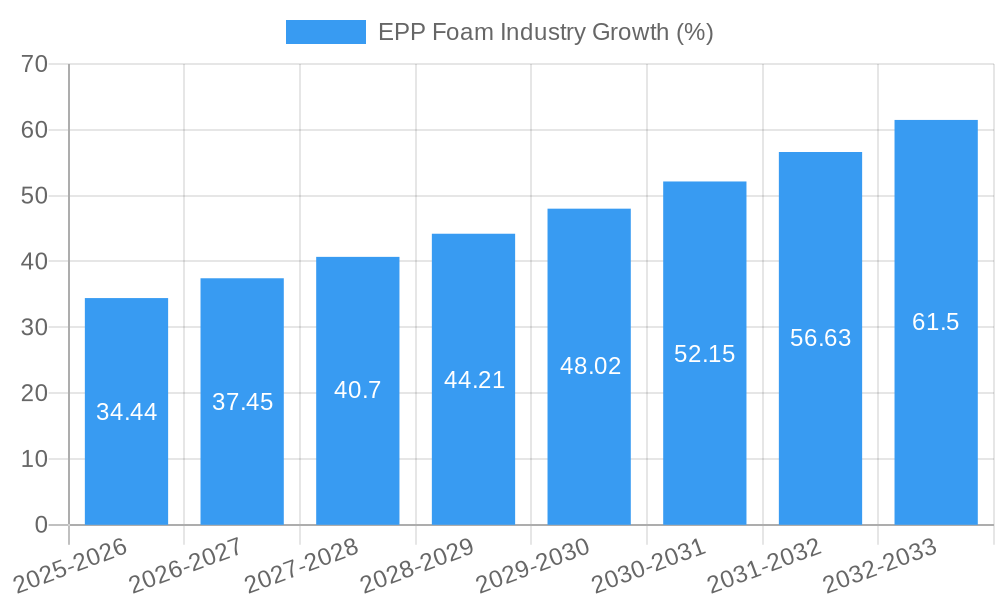
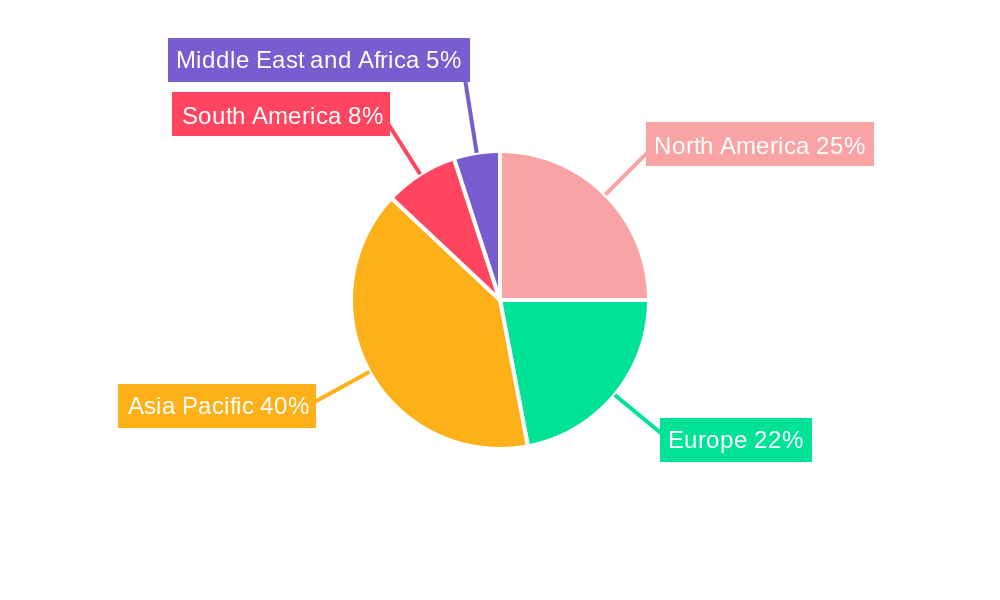
The Expanded Polypropylene (EPP) foam market, valued at $469.83 million in 2025, is projected to experience robust growth, driven by increasing demand across diverse sectors. The 7.21% CAGR indicates a significant expansion over the forecast period (2025-2033). Key drivers include the material's lightweight yet high-impact resistance properties, making it ideal for automotive parts (bumpers, dashboards), packaging (especially for fragile electronics and food), and sporting goods. The rise of e-commerce fuels demand for protective packaging, further boosting market growth. Sustainability concerns are also influencing the market, with bio-based polypropylene gaining traction as a more environmentally friendly alternative to synthetic options. While the availability of substitute materials presents a restraint, the inherent advantages of EPP foam, coupled with ongoing innovations in manufacturing processes and applications, are expected to mitigate this challenge. Segmentation analysis reveals that molded EPP foam currently holds a dominant share in the foam segment, reflecting its versatility in diverse applications. Geographically, the Asia-Pacific region, particularly China and India, is expected to lead market growth, driven by increasing automotive production and rising disposable incomes. North America and Europe also represent substantial markets, with sustained demand across automotive, packaging, and furniture sectors.
The competitive landscape is marked by a mix of global and regional players, each leveraging their expertise in manufacturing, distribution, and application-specific solutions. Major players like Sonoco Products Company, BASF SE, and BEWi (IZOBLOK) are investing in R&D to enhance material properties and explore novel applications. The forecast period will likely see increased mergers and acquisitions, as companies strive to consolidate their market share and expand their product portfolios. Further market growth will be shaped by technological advancements in EPP foam production, focusing on improved energy efficiency and reduced environmental impact. This includes exploring advanced recycling techniques to promote a circular economy and reduce reliance on virgin materials. The overall outlook for the EPP foam market remains positive, with significant growth potential driven by technological innovation, sustainability concerns, and robust demand across various end-use industries.
EPP Foam Industry Report: 2019-2033
This comprehensive report provides an in-depth analysis of the global EPP foam industry, offering invaluable insights for stakeholders, investors, and industry professionals. Covering the period from 2019 to 2033, with a focus on 2025, this report analyzes market dynamics, key players, and future trends to help you navigate the evolving landscape of this multi-billion dollar market.
EPP Foam Industry Market Dynamics & Concentration
The global EPP foam market, valued at xx Million in 2024, is expected to reach xx Million by 2033, exhibiting a CAGR of xx% during the forecast period (2025-2033). Market concentration is moderate, with several key players holding significant market share. Innovation in material science, particularly in bio-based polypropylene, is a key driver. Stringent environmental regulations are shaping product development and manufacturing processes. Product substitutes, such as other lightweight foams, pose a competitive challenge. End-user trends towards lightweighting and sustainability are boosting demand, especially in the automotive and packaging sectors. Mergers and acquisitions (M&A) activity is moderately high, reflecting industry consolidation and expansion efforts.
- Market Share: Top 5 players hold approximately xx% of the global market share.
- M&A Activity: An estimated xx M&A deals occurred between 2019 and 2024.
- Key Innovation Drivers: Bio-based polypropylene development, improved molding techniques, enhanced material properties.
- Regulatory Frameworks: Growing focus on sustainability and recyclability is influencing industry practices.
EPP Foam Industry Industry Trends & Analysis
The EPP foam industry is characterized by steady growth driven by several factors. The increasing demand for lightweight materials in the automotive sector is a major catalyst. Technological advancements, particularly in precision molding techniques and material formulations, are improving product performance and expanding application possibilities. Consumer preference for sustainable and environmentally friendly packaging is driving innovation in bio-based EPP foams. Competitive dynamics are shaped by technological leadership, cost-effectiveness, and market access strategies.
- Market Growth Drivers: Lightweighting in automotive, sustainable packaging demand, expanding applications in sports & leisure, HVAC systems.
- Technological Disruptions: Advancements in molding technologies are leading to more complex and precise EPP parts.
- Consumer Preferences: Growing preference for sustainable and recyclable packaging solutions.
- Competitive Dynamics: Intense competition among major players for market share and technological leadership.
Leading Markets & Segments in EPP Foam Industry
The automotive segment dominates the EPP foam market, accounting for approximately xx% of total consumption. Geographically, Asia-Pacific is the leading region, driven by strong automotive production and increasing demand for lightweight packaging. Within raw materials, Synthetic Polypropylene maintains the largest share, but Bio-based Polypropylene is witnessing substantial growth. Molded EPP represents the dominant foam type due to its versatility and cost-effectiveness.
- Key Drivers in Asia-Pacific: Rapid industrialization, robust automotive production, growing consumer base.
- Key Drivers in Automotive Segment: Stringent fuel efficiency regulations, increased demand for lightweight vehicles.
- Dominance Analysis: Molded EPP enjoys dominance due to its versatility in various applications and cost-effectiveness. Synthetic Polypropylene maintains its market leadership due to established infrastructure and lower cost.
EPP Foam Industry Product Developments
Recent innovations focus on improving the mechanical properties of EPP foam, expanding its application range, and enhancing its recyclability. Developments include the introduction of bio-based polypropylene and the implementation of advanced molding techniques to create more intricate and lightweight components. These advancements enable EPP foam to compete effectively against other lightweight materials in various high-growth sectors.
Key Drivers of EPP Foam Industry Growth
Several factors are fueling the growth of the EPP foam industry. Technological advancements in material science and manufacturing processes are improving the performance and application range of EPP foams. The rising demand for lightweight materials in the automotive sector and other industries is driving increased adoption. Government regulations promoting sustainability are further boosting the demand for eco-friendly materials such as bio-based EPP foams.
Challenges in the EPP Foam Industry Market
The industry faces challenges including volatility in raw material prices, competition from alternative lightweight materials, and the need for robust recycling infrastructure to support sustainability goals. The cost of bio-based polypropylene remains relatively high compared to synthetic alternatives, which can limit its adoption.
Emerging Opportunities in EPP Foam Industry
Strategic partnerships focusing on research and development in bio-based materials are driving opportunities for sustainable growth. Expansion into new applications, especially in renewable energy and advanced medical devices, are unlocking significant market potential. Technological breakthroughs in recycling technologies are paving the way for greater circularity.
Leading Players in the EPP Foam Industry Sector
- Sonoco Products Company
- Knauf Industries
- Kaneka Corporation
- Polyfoam Australia Pty Ltd
- BASF SE
- BEWi (IZOBLOK)
- K K Nag Pvt Ltd
- Clark Foam Products Corporation
- Woodbridge
- Signode Industrial Group Llc
- JSP
- Hanwha Solutions
Key Milestones in EPP Foam Industry Industry
- March 2022: Hanwha Solutions announced the sale of a stake in its advanced materials business for USD 491 million, signaling investment in expansion and R&D.
- February 2022: BEWI acquired a controlling stake (63.83%) in Izoblok, consolidating its position in the EPP foam market.
Strategic Outlook for EPP Foam Industry Market
The EPP foam industry is poised for continued growth, driven by technological advancements, increasing demand for sustainable materials, and expansion into new application areas. Strategic partnerships and investments in R&D will be crucial for companies to maintain a competitive edge and capture market share in this dynamic sector. The focus on sustainability will increasingly shape the industry's trajectory, requiring companies to adopt eco-friendly manufacturing processes and promote the recyclability of EPP products.
EPP Foam Industry Segmentation
-
1. Raw Material
- 1.1. Synthetic Polypropylene
- 1.2. Bio-based Polypropylene
-
2. Foam
- 2.1. Fabricated EPP
- 2.2. Molded EPP
- 2.3. Other Foams
-
3. Application
- 3.1. Automotive
- 3.2. Dunnage
- 3.3. Furniture
- 3.4. Food Packaging
- 3.5. HVAC
- 3.6. Sports and Leisure
- 3.7. Other Applications
EPP Foam Industry Segmentation By Geography
-
1. Asia Pacific
- 1.1. China
- 1.2. India
- 1.3. Japan
- 1.4. South Korea
- 1.5. Rest of Asia Pacific
-
2. North America
- 2.1. United States
- 2.2. Canada
- 2.3. Mexico
-
3. Europe
- 3.1. Germany
- 3.2. United Kingdom
- 3.3. France
- 3.4. Italy
- 3.5. Rest of Europe
-
4. South America
- 4.1. Brazil
- 4.2. Argentina
- 4.3. Rest of South America
-
5. Middle East and Africa
- 5.1. Saudi Arabia
- 5.2. South Africa
- 5.3. Rest of Middle East and Africa
EPP Foam Industry REPORT HIGHLIGHTS
| Aspects | Details |
|---|---|
| Study Period | 2019-2033 |
| Base Year | 2024 |
| Estimated Year | 2025 |
| Forecast Period | 2025-2033 |
| Historical Period | 2019-2024 |
| Growth Rate | CAGR of 7.21% from 2019-2033 |
| Segmentation |
|
Table of Contents
- 1. Introduction
- 1.1. Research Scope
- 1.2. Market Segmentation
- 1.3. Research Methodology
- 1.4. Definitions and Assumptions
- 2. Executive Summary
- 2.1. Introduction
- 3. Market Dynamics
- 3.1. Introduction
- 3.2. Market Drivers
- 3.2.1. Non-toxic and Recyclable Nature of the Material; Rising Demand from the Packaging Industry
- 3.3. Market Restrains
- 3.3.1. Declining Automobile Industry Through Previous Years; Higher Price Among Other Structural Foams
- 3.4. Market Trends
- 3.4.1. Increasing Usage in the Automotive Industry
- 4. Market Factor Analysis
- 4.1. Porters Five Forces
- 4.2. Supply/Value Chain
- 4.3. PESTEL analysis
- 4.4. Market Entropy
- 4.5. Patent/Trademark Analysis
- 5. Global EPP Foam Industry Analysis, Insights and Forecast, 2019-2031
- 5.1. Market Analysis, Insights and Forecast - by Raw Material
- 5.1.1. Synthetic Polypropylene
- 5.1.2. Bio-based Polypropylene
- 5.2. Market Analysis, Insights and Forecast - by Foam
- 5.2.1. Fabricated EPP
- 5.2.2. Molded EPP
- 5.2.3. Other Foams
- 5.3. Market Analysis, Insights and Forecast - by Application
- 5.3.1. Automotive
- 5.3.2. Dunnage
- 5.3.3. Furniture
- 5.3.4. Food Packaging
- 5.3.5. HVAC
- 5.3.6. Sports and Leisure
- 5.3.7. Other Applications
- 5.4. Market Analysis, Insights and Forecast - by Region
- 5.4.1. Asia Pacific
- 5.4.2. North America
- 5.4.3. Europe
- 5.4.4. South America
- 5.4.5. Middle East and Africa
- 5.1. Market Analysis, Insights and Forecast - by Raw Material
- 6. Asia Pacific EPP Foam Industry Analysis, Insights and Forecast, 2019-2031
- 6.1. Market Analysis, Insights and Forecast - by Raw Material
- 6.1.1. Synthetic Polypropylene
- 6.1.2. Bio-based Polypropylene
- 6.2. Market Analysis, Insights and Forecast - by Foam
- 6.2.1. Fabricated EPP
- 6.2.2. Molded EPP
- 6.2.3. Other Foams
- 6.3. Market Analysis, Insights and Forecast - by Application
- 6.3.1. Automotive
- 6.3.2. Dunnage
- 6.3.3. Furniture
- 6.3.4. Food Packaging
- 6.3.5. HVAC
- 6.3.6. Sports and Leisure
- 6.3.7. Other Applications
- 6.1. Market Analysis, Insights and Forecast - by Raw Material
- 7. North America EPP Foam Industry Analysis, Insights and Forecast, 2019-2031
- 7.1. Market Analysis, Insights and Forecast - by Raw Material
- 7.1.1. Synthetic Polypropylene
- 7.1.2. Bio-based Polypropylene
- 7.2. Market Analysis, Insights and Forecast - by Foam
- 7.2.1. Fabricated EPP
- 7.2.2. Molded EPP
- 7.2.3. Other Foams
- 7.3. Market Analysis, Insights and Forecast - by Application
- 7.3.1. Automotive
- 7.3.2. Dunnage
- 7.3.3. Furniture
- 7.3.4. Food Packaging
- 7.3.5. HVAC
- 7.3.6. Sports and Leisure
- 7.3.7. Other Applications
- 7.1. Market Analysis, Insights and Forecast - by Raw Material
- 8. Europe EPP Foam Industry Analysis, Insights and Forecast, 2019-2031
- 8.1. Market Analysis, Insights and Forecast - by Raw Material
- 8.1.1. Synthetic Polypropylene
- 8.1.2. Bio-based Polypropylene
- 8.2. Market Analysis, Insights and Forecast - by Foam
- 8.2.1. Fabricated EPP
- 8.2.2. Molded EPP
- 8.2.3. Other Foams
- 8.3. Market Analysis, Insights and Forecast - by Application
- 8.3.1. Automotive
- 8.3.2. Dunnage
- 8.3.3. Furniture
- 8.3.4. Food Packaging
- 8.3.5. HVAC
- 8.3.6. Sports and Leisure
- 8.3.7. Other Applications
- 8.1. Market Analysis, Insights and Forecast - by Raw Material
- 9. South America EPP Foam Industry Analysis, Insights and Forecast, 2019-2031
- 9.1. Market Analysis, Insights and Forecast - by Raw Material
- 9.1.1. Synthetic Polypropylene
- 9.1.2. Bio-based Polypropylene
- 9.2. Market Analysis, Insights and Forecast - by Foam
- 9.2.1. Fabricated EPP
- 9.2.2. Molded EPP
- 9.2.3. Other Foams
- 9.3. Market Analysis, Insights and Forecast - by Application
- 9.3.1. Automotive
- 9.3.2. Dunnage
- 9.3.3. Furniture
- 9.3.4. Food Packaging
- 9.3.5. HVAC
- 9.3.6. Sports and Leisure
- 9.3.7. Other Applications
- 9.1. Market Analysis, Insights and Forecast - by Raw Material
- 10. Middle East and Africa EPP Foam Industry Analysis, Insights and Forecast, 2019-2031
- 10.1. Market Analysis, Insights and Forecast - by Raw Material
- 10.1.1. Synthetic Polypropylene
- 10.1.2. Bio-based Polypropylene
- 10.2. Market Analysis, Insights and Forecast - by Foam
- 10.2.1. Fabricated EPP
- 10.2.2. Molded EPP
- 10.2.3. Other Foams
- 10.3. Market Analysis, Insights and Forecast - by Application
- 10.3.1. Automotive
- 10.3.2. Dunnage
- 10.3.3. Furniture
- 10.3.4. Food Packaging
- 10.3.5. HVAC
- 10.3.6. Sports and Leisure
- 10.3.7. Other Applications
- 10.1. Market Analysis, Insights and Forecast - by Raw Material
- 11. Asia Pacific EPP Foam Industry Analysis, Insights and Forecast, 2019-2031
- 11.1. Market Analysis, Insights and Forecast - By Country/Sub-region
- 11.1.1 China
- 11.1.2 India
- 11.1.3 Japan
- 11.1.4 South Korea
- 11.1.5 Rest of Asia Pacific
- 12. North America EPP Foam Industry Analysis, Insights and Forecast, 2019-2031
- 12.1. Market Analysis, Insights and Forecast - By Country/Sub-region
- 12.1.1 United States
- 12.1.2 Canada
- 12.1.3 Mexico
- 13. Europe EPP Foam Industry Analysis, Insights and Forecast, 2019-2031
- 13.1. Market Analysis, Insights and Forecast - By Country/Sub-region
- 13.1.1 Germany
- 13.1.2 United Kingdom
- 13.1.3 France
- 13.1.4 Italy
- 13.1.5 Rest of Europe
- 14. South America EPP Foam Industry Analysis, Insights and Forecast, 2019-2031
- 14.1. Market Analysis, Insights and Forecast - By Country/Sub-region
- 14.1.1 Brazil
- 14.1.2 Argentina
- 14.1.3 Rest of South America
- 15. Middle East and Africa EPP Foam Industry Analysis, Insights and Forecast, 2019-2031
- 15.1. Market Analysis, Insights and Forecast - By Country/Sub-region
- 15.1.1 Saudi Arabia
- 15.1.2 South Africa
- 15.1.3 Rest of Middle East and Africa
- 16. Competitive Analysis
- 16.1. Global Market Share Analysis 2024
- 16.2. Company Profiles
- 16.2.1 Sonoco Products Company
- 16.2.1.1. Overview
- 16.2.1.2. Products
- 16.2.1.3. SWOT Analysis
- 16.2.1.4. Recent Developments
- 16.2.1.5. Financials (Based on Availability)
- 16.2.2 Knauf Industries
- 16.2.2.1. Overview
- 16.2.2.2. Products
- 16.2.2.3. SWOT Analysis
- 16.2.2.4. Recent Developments
- 16.2.2.5. Financials (Based on Availability)
- 16.2.3 Kaneka Corporation
- 16.2.3.1. Overview
- 16.2.3.2. Products
- 16.2.3.3. SWOT Analysis
- 16.2.3.4. Recent Developments
- 16.2.3.5. Financials (Based on Availability)
- 16.2.4 Polyfoam Australia Pty Ltd
- 16.2.4.1. Overview
- 16.2.4.2. Products
- 16.2.4.3. SWOT Analysis
- 16.2.4.4. Recent Developments
- 16.2.4.5. Financials (Based on Availability)
- 16.2.5 BASF SE
- 16.2.5.1. Overview
- 16.2.5.2. Products
- 16.2.5.3. SWOT Analysis
- 16.2.5.4. Recent Developments
- 16.2.5.5. Financials (Based on Availability)
- 16.2.6 BEWi (IZOBLOK)
- 16.2.6.1. Overview
- 16.2.6.2. Products
- 16.2.6.3. SWOT Analysis
- 16.2.6.4. Recent Developments
- 16.2.6.5. Financials (Based on Availability)
- 16.2.7 K K Nag Pvt Ltd
- 16.2.7.1. Overview
- 16.2.7.2. Products
- 16.2.7.3. SWOT Analysis
- 16.2.7.4. Recent Developments
- 16.2.7.5. Financials (Based on Availability)
- 16.2.8 Clark Foam Products Corporation
- 16.2.8.1. Overview
- 16.2.8.2. Products
- 16.2.8.3. SWOT Analysis
- 16.2.8.4. Recent Developments
- 16.2.8.5. Financials (Based on Availability)
- 16.2.9 Woodbridge*List Not Exhaustive
- 16.2.9.1. Overview
- 16.2.9.2. Products
- 16.2.9.3. SWOT Analysis
- 16.2.9.4. Recent Developments
- 16.2.9.5. Financials (Based on Availability)
- 16.2.10 Signode Industrial Group Llc
- 16.2.10.1. Overview
- 16.2.10.2. Products
- 16.2.10.3. SWOT Analysis
- 16.2.10.4. Recent Developments
- 16.2.10.5. Financials (Based on Availability)
- 16.2.11 JSP
- 16.2.11.1. Overview
- 16.2.11.2. Products
- 16.2.11.3. SWOT Analysis
- 16.2.11.4. Recent Developments
- 16.2.11.5. Financials (Based on Availability)
- 16.2.12 Hanwha Solutions
- 16.2.12.1. Overview
- 16.2.12.2. Products
- 16.2.12.3. SWOT Analysis
- 16.2.12.4. Recent Developments
- 16.2.12.5. Financials (Based on Availability)
- 16.2.1 Sonoco Products Company
List of Figures
- Figure 1: Global EPP Foam Industry Revenue Breakdown (Million, %) by Region 2024 & 2032
- Figure 2: Asia Pacific EPP Foam Industry Revenue (Million), by Country 2024 & 2032
- Figure 3: Asia Pacific EPP Foam Industry Revenue Share (%), by Country 2024 & 2032
- Figure 4: North America EPP Foam Industry Revenue (Million), by Country 2024 & 2032
- Figure 5: North America EPP Foam Industry Revenue Share (%), by Country 2024 & 2032
- Figure 6: Europe EPP Foam Industry Revenue (Million), by Country 2024 & 2032
- Figure 7: Europe EPP Foam Industry Revenue Share (%), by Country 2024 & 2032
- Figure 8: South America EPP Foam Industry Revenue (Million), by Country 2024 & 2032
- Figure 9: South America EPP Foam Industry Revenue Share (%), by Country 2024 & 2032
- Figure 10: Middle East and Africa EPP Foam Industry Revenue (Million), by Country 2024 & 2032
- Figure 11: Middle East and Africa EPP Foam Industry Revenue Share (%), by Country 2024 & 2032
- Figure 12: Asia Pacific EPP Foam Industry Revenue (Million), by Raw Material 2024 & 2032
- Figure 13: Asia Pacific EPP Foam Industry Revenue Share (%), by Raw Material 2024 & 2032
- Figure 14: Asia Pacific EPP Foam Industry Revenue (Million), by Foam 2024 & 2032
- Figure 15: Asia Pacific EPP Foam Industry Revenue Share (%), by Foam 2024 & 2032
- Figure 16: Asia Pacific EPP Foam Industry Revenue (Million), by Application 2024 & 2032
- Figure 17: Asia Pacific EPP Foam Industry Revenue Share (%), by Application 2024 & 2032
- Figure 18: Asia Pacific EPP Foam Industry Revenue (Million), by Country 2024 & 2032
- Figure 19: Asia Pacific EPP Foam Industry Revenue Share (%), by Country 2024 & 2032
- Figure 20: North America EPP Foam Industry Revenue (Million), by Raw Material 2024 & 2032
- Figure 21: North America EPP Foam Industry Revenue Share (%), by Raw Material 2024 & 2032
- Figure 22: North America EPP Foam Industry Revenue (Million), by Foam 2024 & 2032
- Figure 23: North America EPP Foam Industry Revenue Share (%), by Foam 2024 & 2032
- Figure 24: North America EPP Foam Industry Revenue (Million), by Application 2024 & 2032
- Figure 25: North America EPP Foam Industry Revenue Share (%), by Application 2024 & 2032
- Figure 26: North America EPP Foam Industry Revenue (Million), by Country 2024 & 2032
- Figure 27: North America EPP Foam Industry Revenue Share (%), by Country 2024 & 2032
- Figure 28: Europe EPP Foam Industry Revenue (Million), by Raw Material 2024 & 2032
- Figure 29: Europe EPP Foam Industry Revenue Share (%), by Raw Material 2024 & 2032
- Figure 30: Europe EPP Foam Industry Revenue (Million), by Foam 2024 & 2032
- Figure 31: Europe EPP Foam Industry Revenue Share (%), by Foam 2024 & 2032
- Figure 32: Europe EPP Foam Industry Revenue (Million), by Application 2024 & 2032
- Figure 33: Europe EPP Foam Industry Revenue Share (%), by Application 2024 & 2032
- Figure 34: Europe EPP Foam Industry Revenue (Million), by Country 2024 & 2032
- Figure 35: Europe EPP Foam Industry Revenue Share (%), by Country 2024 & 2032
- Figure 36: South America EPP Foam Industry Revenue (Million), by Raw Material 2024 & 2032
- Figure 37: South America EPP Foam Industry Revenue Share (%), by Raw Material 2024 & 2032
- Figure 38: South America EPP Foam Industry Revenue (Million), by Foam 2024 & 2032
- Figure 39: South America EPP Foam Industry Revenue Share (%), by Foam 2024 & 2032
- Figure 40: South America EPP Foam Industry Revenue (Million), by Application 2024 & 2032
- Figure 41: South America EPP Foam Industry Revenue Share (%), by Application 2024 & 2032
- Figure 42: South America EPP Foam Industry Revenue (Million), by Country 2024 & 2032
- Figure 43: South America EPP Foam Industry Revenue Share (%), by Country 2024 & 2032
- Figure 44: Middle East and Africa EPP Foam Industry Revenue (Million), by Raw Material 2024 & 2032
- Figure 45: Middle East and Africa EPP Foam Industry Revenue Share (%), by Raw Material 2024 & 2032
- Figure 46: Middle East and Africa EPP Foam Industry Revenue (Million), by Foam 2024 & 2032
- Figure 47: Middle East and Africa EPP Foam Industry Revenue Share (%), by Foam 2024 & 2032
- Figure 48: Middle East and Africa EPP Foam Industry Revenue (Million), by Application 2024 & 2032
- Figure 49: Middle East and Africa EPP Foam Industry Revenue Share (%), by Application 2024 & 2032
- Figure 50: Middle East and Africa EPP Foam Industry Revenue (Million), by Country 2024 & 2032
- Figure 51: Middle East and Africa EPP Foam Industry Revenue Share (%), by Country 2024 & 2032
List of Tables
- Table 1: Global EPP Foam Industry Revenue Million Forecast, by Region 2019 & 2032
- Table 2: Global EPP Foam Industry Revenue Million Forecast, by Raw Material 2019 & 2032
- Table 3: Global EPP Foam Industry Revenue Million Forecast, by Foam 2019 & 2032
- Table 4: Global EPP Foam Industry Revenue Million Forecast, by Application 2019 & 2032
- Table 5: Global EPP Foam Industry Revenue Million Forecast, by Region 2019 & 2032
- Table 6: Global EPP Foam Industry Revenue Million Forecast, by Country 2019 & 2032
- Table 7: China EPP Foam Industry Revenue (Million) Forecast, by Application 2019 & 2032
- Table 8: India EPP Foam Industry Revenue (Million) Forecast, by Application 2019 & 2032
- Table 9: Japan EPP Foam Industry Revenue (Million) Forecast, by Application 2019 & 2032
- Table 10: South Korea EPP Foam Industry Revenue (Million) Forecast, by Application 2019 & 2032
- Table 11: Rest of Asia Pacific EPP Foam Industry Revenue (Million) Forecast, by Application 2019 & 2032
- Table 12: Global EPP Foam Industry Revenue Million Forecast, by Country 2019 & 2032
- Table 13: United States EPP Foam Industry Revenue (Million) Forecast, by Application 2019 & 2032
- Table 14: Canada EPP Foam Industry Revenue (Million) Forecast, by Application 2019 & 2032
- Table 15: Mexico EPP Foam Industry Revenue (Million) Forecast, by Application 2019 & 2032
- Table 16: Global EPP Foam Industry Revenue Million Forecast, by Country 2019 & 2032
- Table 17: Germany EPP Foam Industry Revenue (Million) Forecast, by Application 2019 & 2032
- Table 18: United Kingdom EPP Foam Industry Revenue (Million) Forecast, by Application 2019 & 2032
- Table 19: France EPP Foam Industry Revenue (Million) Forecast, by Application 2019 & 2032
- Table 20: Italy EPP Foam Industry Revenue (Million) Forecast, by Application 2019 & 2032
- Table 21: Rest of Europe EPP Foam Industry Revenue (Million) Forecast, by Application 2019 & 2032
- Table 22: Global EPP Foam Industry Revenue Million Forecast, by Country 2019 & 2032
- Table 23: Brazil EPP Foam Industry Revenue (Million) Forecast, by Application 2019 & 2032
- Table 24: Argentina EPP Foam Industry Revenue (Million) Forecast, by Application 2019 & 2032
- Table 25: Rest of South America EPP Foam Industry Revenue (Million) Forecast, by Application 2019 & 2032
- Table 26: Global EPP Foam Industry Revenue Million Forecast, by Country 2019 & 2032
- Table 27: Saudi Arabia EPP Foam Industry Revenue (Million) Forecast, by Application 2019 & 2032
- Table 28: South Africa EPP Foam Industry Revenue (Million) Forecast, by Application 2019 & 2032
- Table 29: Rest of Middle East and Africa EPP Foam Industry Revenue (Million) Forecast, by Application 2019 & 2032
- Table 30: Global EPP Foam Industry Revenue Million Forecast, by Raw Material 2019 & 2032
- Table 31: Global EPP Foam Industry Revenue Million Forecast, by Foam 2019 & 2032
- Table 32: Global EPP Foam Industry Revenue Million Forecast, by Application 2019 & 2032
- Table 33: Global EPP Foam Industry Revenue Million Forecast, by Country 2019 & 2032
- Table 34: China EPP Foam Industry Revenue (Million) Forecast, by Application 2019 & 2032
- Table 35: India EPP Foam Industry Revenue (Million) Forecast, by Application 2019 & 2032
- Table 36: Japan EPP Foam Industry Revenue (Million) Forecast, by Application 2019 & 2032
- Table 37: South Korea EPP Foam Industry Revenue (Million) Forecast, by Application 2019 & 2032
- Table 38: Rest of Asia Pacific EPP Foam Industry Revenue (Million) Forecast, by Application 2019 & 2032
- Table 39: Global EPP Foam Industry Revenue Million Forecast, by Raw Material 2019 & 2032
- Table 40: Global EPP Foam Industry Revenue Million Forecast, by Foam 2019 & 2032
- Table 41: Global EPP Foam Industry Revenue Million Forecast, by Application 2019 & 2032
- Table 42: Global EPP Foam Industry Revenue Million Forecast, by Country 2019 & 2032
- Table 43: United States EPP Foam Industry Revenue (Million) Forecast, by Application 2019 & 2032
- Table 44: Canada EPP Foam Industry Revenue (Million) Forecast, by Application 2019 & 2032
- Table 45: Mexico EPP Foam Industry Revenue (Million) Forecast, by Application 2019 & 2032
- Table 46: Global EPP Foam Industry Revenue Million Forecast, by Raw Material 2019 & 2032
- Table 47: Global EPP Foam Industry Revenue Million Forecast, by Foam 2019 & 2032
- Table 48: Global EPP Foam Industry Revenue Million Forecast, by Application 2019 & 2032
- Table 49: Global EPP Foam Industry Revenue Million Forecast, by Country 2019 & 2032
- Table 50: Germany EPP Foam Industry Revenue (Million) Forecast, by Application 2019 & 2032
- Table 51: United Kingdom EPP Foam Industry Revenue (Million) Forecast, by Application 2019 & 2032
- Table 52: France EPP Foam Industry Revenue (Million) Forecast, by Application 2019 & 2032
- Table 53: Italy EPP Foam Industry Revenue (Million) Forecast, by Application 2019 & 2032
- Table 54: Rest of Europe EPP Foam Industry Revenue (Million) Forecast, by Application 2019 & 2032
- Table 55: Global EPP Foam Industry Revenue Million Forecast, by Raw Material 2019 & 2032
- Table 56: Global EPP Foam Industry Revenue Million Forecast, by Foam 2019 & 2032
- Table 57: Global EPP Foam Industry Revenue Million Forecast, by Application 2019 & 2032
- Table 58: Global EPP Foam Industry Revenue Million Forecast, by Country 2019 & 2032
- Table 59: Brazil EPP Foam Industry Revenue (Million) Forecast, by Application 2019 & 2032
- Table 60: Argentina EPP Foam Industry Revenue (Million) Forecast, by Application 2019 & 2032
- Table 61: Rest of South America EPP Foam Industry Revenue (Million) Forecast, by Application 2019 & 2032
- Table 62: Global EPP Foam Industry Revenue Million Forecast, by Raw Material 2019 & 2032
- Table 63: Global EPP Foam Industry Revenue Million Forecast, by Foam 2019 & 2032
- Table 64: Global EPP Foam Industry Revenue Million Forecast, by Application 2019 & 2032
- Table 65: Global EPP Foam Industry Revenue Million Forecast, by Country 2019 & 2032
- Table 66: Saudi Arabia EPP Foam Industry Revenue (Million) Forecast, by Application 2019 & 2032
- Table 67: South Africa EPP Foam Industry Revenue (Million) Forecast, by Application 2019 & 2032
- Table 68: Rest of Middle East and Africa EPP Foam Industry Revenue (Million) Forecast, by Application 2019 & 2032
Frequently Asked Questions
1. What is the projected Compound Annual Growth Rate (CAGR) of the EPP Foam Industry?
The projected CAGR is approximately 7.21%.
2. Which companies are prominent players in the EPP Foam Industry?
Key companies in the market include Sonoco Products Company, Knauf Industries, Kaneka Corporation, Polyfoam Australia Pty Ltd, BASF SE, BEWi (IZOBLOK), K K Nag Pvt Ltd, Clark Foam Products Corporation, Woodbridge*List Not Exhaustive, Signode Industrial Group Llc, JSP, Hanwha Solutions.
3. What are the main segments of the EPP Foam Industry?
The market segments include Raw Material, Foam, Application.
4. Can you provide details about the market size?
The market size is estimated to be USD 469.83 Million as of 2022.
5. What are some drivers contributing to market growth?
Non-toxic and Recyclable Nature of the Material; Rising Demand from the Packaging Industry.
6. What are the notable trends driving market growth?
Increasing Usage in the Automotive Industry.
7. Are there any restraints impacting market growth?
Declining Automobile Industry Through Previous Years; Higher Price Among Other Structural Foams.
8. Can you provide examples of recent developments in the market?
March 2022: Hanwha Solutions has announced that the company is set to split off its advanced materials business and sell a stake in the unit to raise USD 491 million for investments at home and abroad. The sell-off was considered first in November 2021. Private equity firm Glenwood PE has planned to buy a 49% stake in the division for KRW 600 billion (USD 491.4 million), becoming its second-largest shareholder after Hanwha.
9. What pricing options are available for accessing the report?
Pricing options include single-user, multi-user, and enterprise licenses priced at USD 4750, USD 5250, and USD 8750 respectively.
10. Is the market size provided in terms of value or volume?
The market size is provided in terms of value, measured in Million.
11. Are there any specific market keywords associated with the report?
Yes, the market keyword associated with the report is "EPP Foam Industry," which aids in identifying and referencing the specific market segment covered.
12. How do I determine which pricing option suits my needs best?
The pricing options vary based on user requirements and access needs. Individual users may opt for single-user licenses, while businesses requiring broader access may choose multi-user or enterprise licenses for cost-effective access to the report.
13. Are there any additional resources or data provided in the EPP Foam Industry report?
While the report offers comprehensive insights, it's advisable to review the specific contents or supplementary materials provided to ascertain if additional resources or data are available.
14. How can I stay updated on further developments or reports in the EPP Foam Industry?
To stay informed about further developments, trends, and reports in the EPP Foam Industry, consider subscribing to industry newsletters, following relevant companies and organizations, or regularly checking reputable industry news sources and publications.
Methodology
Step 1 - Identification of Relevant Samples Size from Population Database


Step 2 - Approaches for Defining Global Market Size (Value, Volume* & Price*)

Note*: In applicable scenarios
Step 3 - Data Sources
Primary Research
- Web Analytics
- Survey Reports
- Research Institute
- Latest Research Reports
- Opinion Leaders
Secondary Research
- Annual Reports
- White Paper
- Latest Press Release
- Industry Association
- Paid Database
- Investor Presentations

Step 4 - Data Triangulation
Involves using different sources of information in order to increase the validity of a study
These sources are likely to be stakeholders in a program - participants, other researchers, program staff, other community members, and so on.
Then we put all data in single framework & apply various statistical tools to find out the dynamic on the market.
During the analysis stage, feedback from the stakeholder groups would be compared to determine areas of agreement as well as areas of divergence
