

Key Insights
The ENT (Ear, Nose, and Throat) devices market is experiencing robust growth, driven by a rising prevalence of ENT disorders globally, technological advancements in diagnostic and surgical procedures, and an aging population increasingly susceptible to hearing loss and other ENT conditions. The market's Compound Annual Growth Rate (CAGR) of 6.40% from 2019-2024 indicates a healthy expansion trajectory, projected to continue into the forecast period (2025-2033). Key growth drivers include the increasing adoption of minimally invasive surgical techniques, the development of sophisticated image-guided surgery systems enhancing precision and reducing recovery times, and the rising demand for advanced hearing aids incorporating cutting-edge technologies like artificial intelligence for improved sound processing and personalization. The market is segmented by product type (diagnostic devices, surgical devices, hearing aids, image-guided surgery systems, and others) and end-user (hospitals, ENT clinics, and other end-users). Hospitals currently represent a major segment, owing to their extensive infrastructure and specialized medical personnel. However, the growth of private ENT clinics and ambulatory surgical centers is expected to fuel market expansion across these segments. Geographic regions like North America and Europe currently hold significant market shares due to high healthcare expenditure and technological advancements, but the Asia-Pacific region is expected to witness substantial growth in the coming years, driven by rising disposable incomes and improving healthcare infrastructure, particularly in countries like China and India. Market restraints include high device costs, stringent regulatory approvals, and the need for skilled professionals for the effective use and maintenance of advanced equipment.
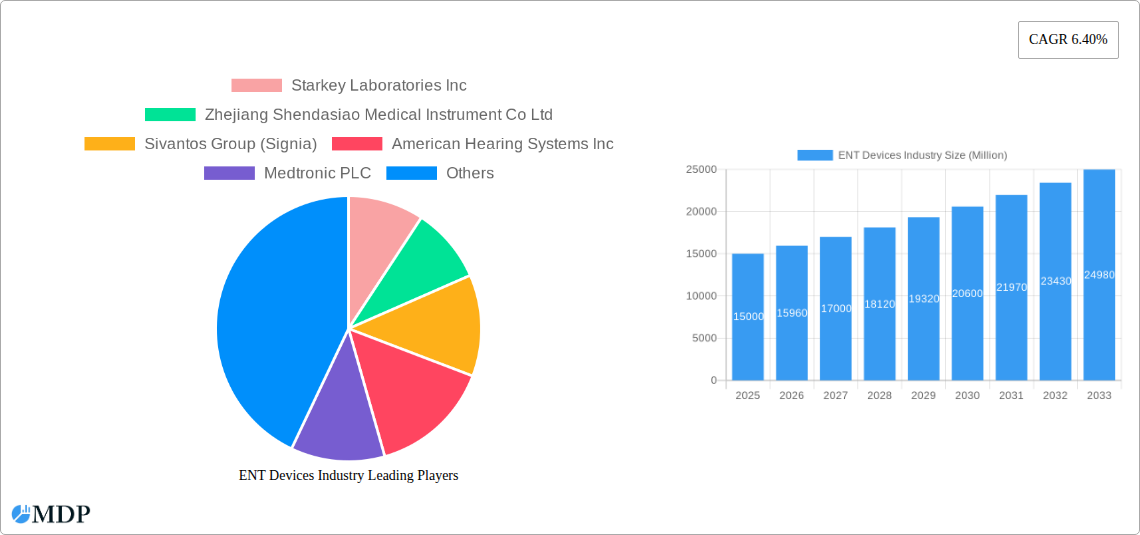
The competitive landscape is characterized by a mix of established multinational corporations and specialized regional players. Key companies such as Starkey Laboratories, Medtronic, and Cochlear Ltd. are at the forefront of innovation and market leadership, consistently investing in research and development to enhance their product portfolios. Strategic partnerships, mergers, and acquisitions are likely to shape the competitive dynamics in the coming years. Future market growth will largely depend on continued technological innovation, expansion into emerging markets, and the successful integration of artificial intelligence and machine learning into diagnostic and therapeutic solutions for ENT disorders. Furthermore, a focus on improving patient access to advanced care and reducing the overall cost of treatment will significantly influence the market's trajectory. The forecast period (2025-2033) is expected to see a continued rise in market value, driven by factors discussed above, though the exact figures will be influenced by economic factors and technological breakthroughs.
ENT Devices Industry: A Comprehensive Market Report (2019-2033)
This comprehensive report provides an in-depth analysis of the ENT Devices industry, offering invaluable insights for stakeholders across the value chain. Covering the period 2019-2033, with a focus on 2025, this report unveils market dynamics, leading players, and future growth opportunities. The global ENT devices market is projected to reach xx Million by 2033, exhibiting a CAGR of xx% during the forecast period (2025-2033).
ENT Devices Industry Market Dynamics & Concentration
The ENT devices market is characterized by a moderately concentrated landscape with a few key players holding significant market share. While exact figures are proprietary to the full report, Starkey Laboratories Inc, Medtronic PLC, and Cochlear Ltd are among the leading companies, collectively controlling an estimated xx% of the market in 2024. Market concentration is influenced by factors such as stringent regulatory approvals (FDA, CE marking), high R&D investments needed for innovation, and the significant capital expenditure required for manufacturing and distribution. Innovation is a key driver, with companies continuously developing advanced diagnostic tools, minimally invasive surgical devices, and sophisticated hearing aids. Recent mergers and acquisitions (M&A) activity, though not at a breakneck pace, indicates a consolidation trend, with an estimated xx M&A deals occurring within the last 5 years. These deals are predominantly focused on enhancing product portfolios, expanding geographic reach, and acquiring innovative technologies. The market also sees competition from substitute products, such as conservative treatments, impacting the overall market growth. End-user trends show a growing preference for minimally invasive procedures and improved patient outcomes, favoring the adoption of technologically advanced devices.
ENT Devices Industry Industry Trends & Analysis
The ENT devices market is experiencing robust growth, driven by several key factors. The aging global population, coupled with rising prevalence of ENT disorders like hearing loss, tinnitus, and nasal polyps, fuels significant demand. Technological advancements, particularly in areas like AI-powered surgical planning, image-guided surgery systems, and miniaturized implantable devices, are significantly impacting market growth. The market witnesses a strong preference towards advanced features and improved patient comfort, which is driving adoption of premium products and systems. The competitive landscape is highly dynamic, characterized by intense rivalry amongst established players and the emergence of innovative entrants. This results in continuous product development, strategic partnerships, and pricing strategies influencing the overall market growth. The historical period (2019-2024) showed a CAGR of xx%, with market penetration of xx% in key segments. The forecast period (2025-2033) is expected to witness an even faster expansion rate driven by factors mentioned above.
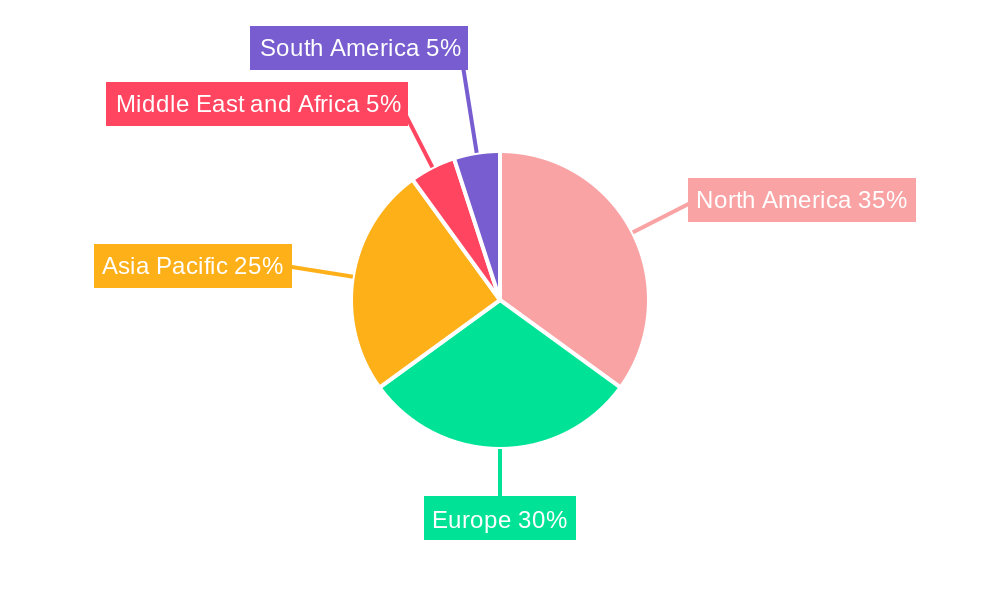
Leading Markets & Segments in ENT Devices Industry
The North American market holds a dominant position in the global ENT devices market, accounting for an estimated xx% of the market share in 2024, followed by Europe and Asia-Pacific. This dominance is attributed to several factors:
- North America: Strong healthcare infrastructure, high healthcare expenditure, and early adoption of advanced technologies.
- Europe: Significant regulatory support, a sizable aging population and advanced medical infrastructure across several countries.
- Asia-Pacific: Rapidly rising healthcare expenditure, growing awareness of ENT disorders, and increasing adoption of minimally invasive surgical techniques.
Within the product segments, surgical devices currently represent the largest market share (xx% in 2024), followed by hearing aids and diagnostic devices. The high market share of surgical devices is driven by increasing prevalence of ear, nose, and throat surgeries. Within the end-user segment, hospitals constitute the major portion of the market due to high volume of ENT procedures performed. The "Other End Users" segment is growing rapidly, encompassing home healthcare settings and specialized ambulatory surgical centers.
ENT Devices Industry Product Developments
Recent years have witnessed significant advancements in ENT devices. The integration of AI and machine learning into surgical planning and execution is streamlining procedures and improving precision. Miniaturization of devices enhances patient comfort and reduces recovery time. There's a growing focus on developing less invasive techniques, including improved endoscopes, and smaller, more precise surgical instruments. These innovations are driving market growth by improving treatment efficacy and patient experience.
Key Drivers of ENT Devices Industry Growth
Several factors are propelling the growth of the ENT devices market:
- Technological advancements: AI integration, miniaturization, and improved imaging technologies are revolutionizing diagnostic and surgical procedures.
- Rising prevalence of ENT disorders: An aging population and increasing awareness contribute to growing demand.
- Favorable regulatory environment: Approvals for innovative devices drive market penetration.
- Increased healthcare spending: Growing disposable incomes and government initiatives boost investments in healthcare infrastructure.
Challenges in the ENT Devices Industry Market
The industry faces challenges including:
- Stringent regulatory approvals: Lengthy and complex approval processes can hinder the market entry of new devices.
- High R&D costs: Developing advanced technologies requires substantial financial investments.
- Competition from established and emerging players: Maintaining market share in a competitive landscape demands continuous innovation.
- Supply chain disruptions: Geopolitical events and pandemics can disrupt the availability of raw materials and components.
Emerging Opportunities in ENT Devices Industry
The ENT devices market holds significant potential for future growth through:
- Telemedicine and remote patient monitoring: Expanding access to care in underserved areas.
- Strategic partnerships and collaborations: Facilitating innovation and expanding market reach.
- Expansion into emerging markets: Reaching new patient populations in developing countries.
- Development of personalized treatment approaches: Tailoring treatment to individual patient needs through advanced diagnostic tools.
Leading Players in the ENT Devices Industry Sector
- Starkey Laboratories Inc
- Zhejiang Shendasiao Medical Instrument Co Ltd
- Sivantos Group (Signia)
- American Hearing Systems Inc
- Medtronic PLC
- Fujifilm Corporation
- InHealth Technologies
- Welch Allyn
- Atos Medical
- Richard Wolf GmbH
- Cochlear Ltd
- Stryker Corporation
- Olympus Corporation
- Nurotron Biotechnology Co Ltd
Key Milestones in ENT Devices Industry Industry
- February 2022: Medtronic launched its NuVent Eustachian tube dilation balloon, expanding outpatient treatment options.
- January 2022: Acclarent Inc. (Johnson & Johnson) launched AI-powered ENT technology, improving surgical planning and precision.
Strategic Outlook for ENT Devices Industry Market
The ENT devices market is poised for substantial growth, driven by technological advancements, increasing prevalence of ENT disorders, and favorable regulatory environments. Strategic partnerships, expansion into new markets, and focus on personalized medicine will be key growth accelerators. The market presents significant opportunities for companies that can effectively leverage technological innovations, enhance product offerings, and build strong distribution networks.
ENT Devices Industry Segmentation
-
1. Product
- 1.1. Diagnostic Devices
- 1.2. Surgical Devices
- 1.3. Hearing Aids
- 1.4. Image-guided Surgery Systems
- 1.5. Other Products
-
2. End User
- 2.1. Hospitals
- 2.2. ENT Clinics
- 2.3. Other End Users
ENT Devices Industry Segmentation By Geography
-
1. North America
- 1.1. United States
- 1.2. Canada
- 1.3. Mexico
-
2. Europe
- 2.1. Germany
- 2.2. United Kingdom
- 2.3. France
- 2.4. Italy
- 2.5. Spain
- 2.6. Rest of Europe
-
3. Asia Pacific
- 3.1. China
- 3.2. Japan
- 3.3. India
- 3.4. Australia
- 3.5. South Korea
- 3.6. Rest of Asia Pacific
-
4. Middle East and Africa
- 4.1. GCC
- 4.2. South Africa
- 4.3. Rest of Middle East and Africa
-
5. South America
- 5.1. Brazil
- 5.2. Argentina
- 5.3. Rest of South America
ENT Devices Industry REPORT HIGHLIGHTS
| Aspects | Details |
|---|---|
| Study Period | 2019-2033 |
| Base Year | 2024 |
| Estimated Year | 2025 |
| Forecast Period | 2025-2033 |
| Historical Period | 2019-2024 |
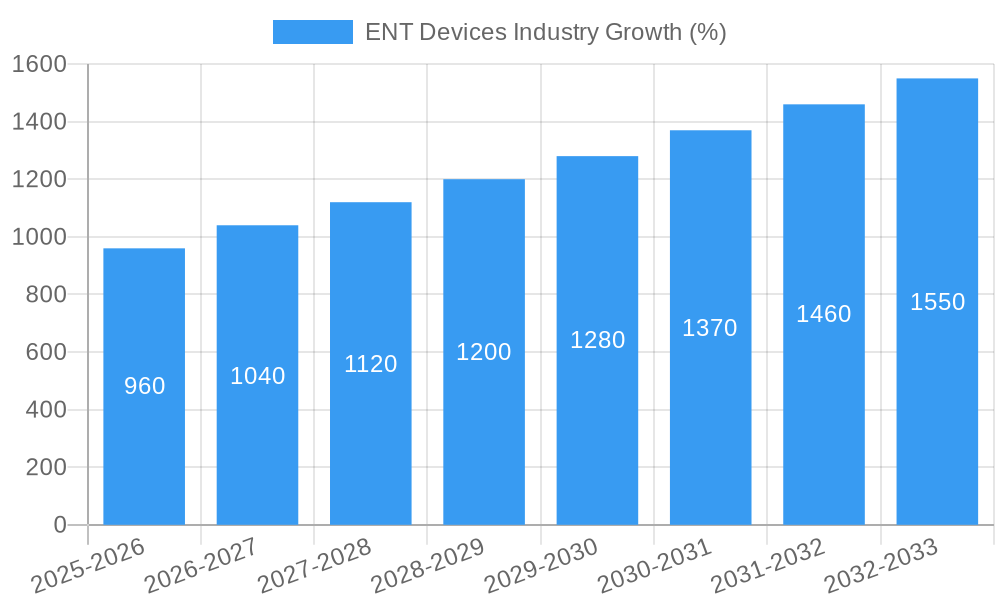
| Growth Rate | CAGR of 6.40% from 2019-2033 |
| Segmentation |
|
Table of Contents
- 1. Introduction
- 1.1. Research Scope
- 1.2. Market Segmentation
- 1.3. Research Methodology
- 1.4. Definitions and Assumptions
- 2. Executive Summary
- 2.1. Introduction
- 3. Market Dynamics
- 3.1. Introduction
- 3.2. Market Drivers
- 3.2.1 Increasing Prevalence of Ear
- 3.2.2 Nose
- 3.2.3 and Throat Related Disorders; Rising Adoption of Minimally Invasive ENT Procedures; Technological Advancements
- 3.3. Market Restrains
- 3.3.1. High Procedure and Instruments Cost; Social Stigma
- 3.4. Market Trends
- 3.4.1. Hearing Aids Segment is Expected to Account for Fastest Growth Rate during the Forecast Period
- 4. Market Factor Analysis
- 4.1. Porters Five Forces
- 4.2. Supply/Value Chain
- 4.3. PESTEL analysis
- 4.4. Market Entropy
- 4.5. Patent/Trademark Analysis
- 5. Global ENT Devices Industry Analysis, Insights and Forecast, 2019-2031
- 5.1. Market Analysis, Insights and Forecast - by Product
- 5.1.1. Diagnostic Devices
- 5.1.2. Surgical Devices
- 5.1.3. Hearing Aids
- 5.1.4. Image-guided Surgery Systems
- 5.1.5. Other Products
- 5.2. Market Analysis, Insights and Forecast - by End User
- 5.2.1. Hospitals
- 5.2.2. ENT Clinics
- 5.2.3. Other End Users
- 5.3. Market Analysis, Insights and Forecast - by Region
- 5.3.1. North America
- 5.3.2. Europe
- 5.3.3. Asia Pacific
- 5.3.4. Middle East and Africa
- 5.3.5. South America
- 5.1. Market Analysis, Insights and Forecast - by Product
- 6. North America ENT Devices Industry Analysis, Insights and Forecast, 2019-2031
- 6.1. Market Analysis, Insights and Forecast - by Product
- 6.1.1. Diagnostic Devices
- 6.1.2. Surgical Devices
- 6.1.3. Hearing Aids
- 6.1.4. Image-guided Surgery Systems
- 6.1.5. Other Products
- 6.2. Market Analysis, Insights and Forecast - by End User
- 6.2.1. Hospitals
- 6.2.2. ENT Clinics
- 6.2.3. Other End Users
- 6.1. Market Analysis, Insights and Forecast - by Product
- 7. Europe ENT Devices Industry Analysis, Insights and Forecast, 2019-2031
- 7.1. Market Analysis, Insights and Forecast - by Product
- 7.1.1. Diagnostic Devices
- 7.1.2. Surgical Devices
- 7.1.3. Hearing Aids
- 7.1.4. Image-guided Surgery Systems
- 7.1.5. Other Products
- 7.2. Market Analysis, Insights and Forecast - by End User
- 7.2.1. Hospitals
- 7.2.2. ENT Clinics
- 7.2.3. Other End Users
- 7.1. Market Analysis, Insights and Forecast - by Product
- 8. Asia Pacific ENT Devices Industry Analysis, Insights and Forecast, 2019-2031
- 8.1. Market Analysis, Insights and Forecast - by Product
- 8.1.1. Diagnostic Devices
- 8.1.2. Surgical Devices
- 8.1.3. Hearing Aids
- 8.1.4. Image-guided Surgery Systems
- 8.1.5. Other Products
- 8.2. Market Analysis, Insights and Forecast - by End User
- 8.2.1. Hospitals
- 8.2.2. ENT Clinics
- 8.2.3. Other End Users
- 8.1. Market Analysis, Insights and Forecast - by Product
- 9. Middle East and Africa ENT Devices Industry Analysis, Insights and Forecast, 2019-2031
- 9.1. Market Analysis, Insights and Forecast - by Product
- 9.1.1. Diagnostic Devices
- 9.1.2. Surgical Devices
- 9.1.3. Hearing Aids
- 9.1.4. Image-guided Surgery Systems
- 9.1.5. Other Products
- 9.2. Market Analysis, Insights and Forecast - by End User
- 9.2.1. Hospitals
- 9.2.2. ENT Clinics
- 9.2.3. Other End Users
- 9.1. Market Analysis, Insights and Forecast - by Product
- 10. South America ENT Devices Industry Analysis, Insights and Forecast, 2019-2031
- 10.1. Market Analysis, Insights and Forecast - by Product
- 10.1.1. Diagnostic Devices
- 10.1.2. Surgical Devices
- 10.1.3. Hearing Aids
- 10.1.4. Image-guided Surgery Systems
- 10.1.5. Other Products
- 10.2. Market Analysis, Insights and Forecast - by End User
- 10.2.1. Hospitals
- 10.2.2. ENT Clinics
- 10.2.3. Other End Users
- 10.1. Market Analysis, Insights and Forecast - by Product
- 11. North America ENT Devices Industry Analysis, Insights and Forecast, 2019-2031
- 11.1. Market Analysis, Insights and Forecast - By Country/Sub-region
- 11.1.1 United States
- 11.1.2 Canada
- 11.1.3 Mexico
- 12. Europe ENT Devices Industry Analysis, Insights and Forecast, 2019-2031
- 12.1. Market Analysis, Insights and Forecast - By Country/Sub-region
- 12.1.1 Germany
- 12.1.2 United Kingdom
- 12.1.3 France
- 12.1.4 Italy
- 12.1.5 Spain
- 12.1.6 Rest of Europe
- 13. Asia Pacific ENT Devices Industry Analysis, Insights and Forecast, 2019-2031
- 13.1. Market Analysis, Insights and Forecast - By Country/Sub-region
- 13.1.1 China
- 13.1.2 Japan
- 13.1.3 India
- 13.1.4 Australia
- 13.1.5 South Korea
- 13.1.6 Rest of Asia Pacific
- 14. Middle East and Africa ENT Devices Industry Analysis, Insights and Forecast, 2019-2031
- 14.1. Market Analysis, Insights and Forecast - By Country/Sub-region
- 14.1.1 GCC
- 14.1.2 South Africa
- 14.1.3 Rest of Middle East and Africa
- 15. South America ENT Devices Industry Analysis, Insights and Forecast, 2019-2031
- 15.1. Market Analysis, Insights and Forecast - By Country/Sub-region
- 15.1.1 Brazil
- 15.1.2 Argentina
- 15.1.3 Rest of South America
- 16. Competitive Analysis
- 16.1. Global Market Share Analysis 2024
- 16.2. Company Profiles
- 16.2.1 Starkey Laboratories Inc
- 16.2.1.1. Overview
- 16.2.1.2. Products
- 16.2.1.3. SWOT Analysis
- 16.2.1.4. Recent Developments
- 16.2.1.5. Financials (Based on Availability)
- 16.2.2 Zhejiang Shendasiao Medical Instrument Co Ltd
- 16.2.2.1. Overview
- 16.2.2.2. Products
- 16.2.2.3. SWOT Analysis
- 16.2.2.4. Recent Developments
- 16.2.2.5. Financials (Based on Availability)
- 16.2.3 Sivantos Group (Signia)
- 16.2.3.1. Overview
- 16.2.3.2. Products
- 16.2.3.3. SWOT Analysis
- 16.2.3.4. Recent Developments
- 16.2.3.5. Financials (Based on Availability)
- 16.2.4 American Hearing Systems Inc
- 16.2.4.1. Overview
- 16.2.4.2. Products
- 16.2.4.3. SWOT Analysis
- 16.2.4.4. Recent Developments
- 16.2.4.5. Financials (Based on Availability)
- 16.2.5 Medtronic PLC
- 16.2.5.1. Overview
- 16.2.5.2. Products
- 16.2.5.3. SWOT Analysis
- 16.2.5.4. Recent Developments
- 16.2.5.5. Financials (Based on Availability)
- 16.2.6 Fujifilm Corporation
- 16.2.6.1. Overview
- 16.2.6.2. Products
- 16.2.6.3. SWOT Analysis
- 16.2.6.4. Recent Developments
- 16.2.6.5. Financials (Based on Availability)
- 16.2.7 InHealth Technologies
- 16.2.7.1. Overview
- 16.2.7.2. Products
- 16.2.7.3. SWOT Analysis
- 16.2.7.4. Recent Developments
- 16.2.7.5. Financials (Based on Availability)
- 16.2.8 Welch Allyn
- 16.2.8.1. Overview
- 16.2.8.2. Products
- 16.2.8.3. SWOT Analysis
- 16.2.8.4. Recent Developments
- 16.2.8.5. Financials (Based on Availability)
- 16.2.9 Atos Medical
- 16.2.9.1. Overview
- 16.2.9.2. Products
- 16.2.9.3. SWOT Analysis
- 16.2.9.4. Recent Developments
- 16.2.9.5. Financials (Based on Availability)
- 16.2.10 Richard Wolf GmbH
- 16.2.10.1. Overview
- 16.2.10.2. Products
- 16.2.10.3. SWOT Analysis
- 16.2.10.4. Recent Developments
- 16.2.10.5. Financials (Based on Availability)
- 16.2.11 Cochlear Ltd
- 16.2.11.1. Overview
- 16.2.11.2. Products
- 16.2.11.3. SWOT Analysis
- 16.2.11.4. Recent Developments
- 16.2.11.5. Financials (Based on Availability)
- 16.2.12 Stryker Corporation
- 16.2.12.1. Overview
- 16.2.12.2. Products
- 16.2.12.3. SWOT Analysis
- 16.2.12.4. Recent Developments
- 16.2.12.5. Financials (Based on Availability)
- 16.2.13 Olympus Corporation
- 16.2.13.1. Overview
- 16.2.13.2. Products
- 16.2.13.3. SWOT Analysis
- 16.2.13.4. Recent Developments
- 16.2.13.5. Financials (Based on Availability)
- 16.2.14 Nurotron Biotechnology Co Ltd
- 16.2.14.1. Overview
- 16.2.14.2. Products
- 16.2.14.3. SWOT Analysis
- 16.2.14.4. Recent Developments
- 16.2.14.5. Financials (Based on Availability)
- 16.2.1 Starkey Laboratories Inc
List of Figures
- Figure 1: Global ENT Devices Industry Revenue Breakdown (Million, %) by Region 2024 & 2032
- Figure 2: Global ENT Devices Industry Volume Breakdown (K Unit, %) by Region 2024 & 2032
- Figure 3: North America ENT Devices Industry Revenue (Million), by Country 2024 & 2032
- Figure 4: North America ENT Devices Industry Volume (K Unit), by Country 2024 & 2032
- Figure 5: North America ENT Devices Industry Revenue Share (%), by Country 2024 & 2032
- Figure 6: North America ENT Devices Industry Volume Share (%), by Country 2024 & 2032
- Figure 7: Europe ENT Devices Industry Revenue (Million), by Country 2024 & 2032
- Figure 8: Europe ENT Devices Industry Volume (K Unit), by Country 2024 & 2032
- Figure 9: Europe ENT Devices Industry Revenue Share (%), by Country 2024 & 2032
- Figure 10: Europe ENT Devices Industry Volume Share (%), by Country 2024 & 2032
- Figure 11: Asia Pacific ENT Devices Industry Revenue (Million), by Country 2024 & 2032
- Figure 12: Asia Pacific ENT Devices Industry Volume (K Unit), by Country 2024 & 2032
- Figure 13: Asia Pacific ENT Devices Industry Revenue Share (%), by Country 2024 & 2032
- Figure 14: Asia Pacific ENT Devices Industry Volume Share (%), by Country 2024 & 2032
- Figure 15: Middle East and Africa ENT Devices Industry Revenue (Million), by Country 2024 & 2032
- Figure 16: Middle East and Africa ENT Devices Industry Volume (K Unit), by Country 2024 & 2032
- Figure 17: Middle East and Africa ENT Devices Industry Revenue Share (%), by Country 2024 & 2032
- Figure 18: Middle East and Africa ENT Devices Industry Volume Share (%), by Country 2024 & 2032
- Figure 19: South America ENT Devices Industry Revenue (Million), by Country 2024 & 2032
- Figure 20: South America ENT Devices Industry Volume (K Unit), by Country 2024 & 2032
- Figure 21: South America ENT Devices Industry Revenue Share (%), by Country 2024 & 2032
- Figure 22: South America ENT Devices Industry Volume Share (%), by Country 2024 & 2032
- Figure 23: North America ENT Devices Industry Revenue (Million), by Product 2024 & 2032
- Figure 24: North America ENT Devices Industry Volume (K Unit), by Product 2024 & 2032
- Figure 25: North America ENT Devices Industry Revenue Share (%), by Product 2024 & 2032
- Figure 26: North America ENT Devices Industry Volume Share (%), by Product 2024 & 2032
- Figure 27: North America ENT Devices Industry Revenue (Million), by End User 2024 & 2032
- Figure 28: North America ENT Devices Industry Volume (K Unit), by End User 2024 & 2032
- Figure 29: North America ENT Devices Industry Revenue Share (%), by End User 2024 & 2032
- Figure 30: North America ENT Devices Industry Volume Share (%), by End User 2024 & 2032
- Figure 31: North America ENT Devices Industry Revenue (Million), by Country 2024 & 2032
- Figure 32: North America ENT Devices Industry Volume (K Unit), by Country 2024 & 2032
- Figure 33: North America ENT Devices Industry Revenue Share (%), by Country 2024 & 2032
- Figure 34: North America ENT Devices Industry Volume Share (%), by Country 2024 & 2032
- Figure 35: Europe ENT Devices Industry Revenue (Million), by Product 2024 & 2032
- Figure 36: Europe ENT Devices Industry Volume (K Unit), by Product 2024 & 2032
- Figure 37: Europe ENT Devices Industry Revenue Share (%), by Product 2024 & 2032
- Figure 38: Europe ENT Devices Industry Volume Share (%), by Product 2024 & 2032
- Figure 39: Europe ENT Devices Industry Revenue (Million), by End User 2024 & 2032
- Figure 40: Europe ENT Devices Industry Volume (K Unit), by End User 2024 & 2032
- Figure 41: Europe ENT Devices Industry Revenue Share (%), by End User 2024 & 2032
- Figure 42: Europe ENT Devices Industry Volume Share (%), by End User 2024 & 2032
- Figure 43: Europe ENT Devices Industry Revenue (Million), by Country 2024 & 2032
- Figure 44: Europe ENT Devices Industry Volume (K Unit), by Country 2024 & 2032
- Figure 45: Europe ENT Devices Industry Revenue Share (%), by Country 2024 & 2032
- Figure 46: Europe ENT Devices Industry Volume Share (%), by Country 2024 & 2032
- Figure 47: Asia Pacific ENT Devices Industry Revenue (Million), by Product 2024 & 2032
- Figure 48: Asia Pacific ENT Devices Industry Volume (K Unit), by Product 2024 & 2032
- Figure 49: Asia Pacific ENT Devices Industry Revenue Share (%), by Product 2024 & 2032
- Figure 50: Asia Pacific ENT Devices Industry Volume Share (%), by Product 2024 & 2032
- Figure 51: Asia Pacific ENT Devices Industry Revenue (Million), by End User 2024 & 2032
- Figure 52: Asia Pacific ENT Devices Industry Volume (K Unit), by End User 2024 & 2032
- Figure 53: Asia Pacific ENT Devices Industry Revenue Share (%), by End User 2024 & 2032
- Figure 54: Asia Pacific ENT Devices Industry Volume Share (%), by End User 2024 & 2032
- Figure 55: Asia Pacific ENT Devices Industry Revenue (Million), by Country 2024 & 2032
- Figure 56: Asia Pacific ENT Devices Industry Volume (K Unit), by Country 2024 & 2032
- Figure 57: Asia Pacific ENT Devices Industry Revenue Share (%), by Country 2024 & 2032
- Figure 58: Asia Pacific ENT Devices Industry Volume Share (%), by Country 2024 & 2032
- Figure 59: Middle East and Africa ENT Devices Industry Revenue (Million), by Product 2024 & 2032
- Figure 60: Middle East and Africa ENT Devices Industry Volume (K Unit), by Product 2024 & 2032
- Figure 61: Middle East and Africa ENT Devices Industry Revenue Share (%), by Product 2024 & 2032
- Figure 62: Middle East and Africa ENT Devices Industry Volume Share (%), by Product 2024 & 2032
- Figure 63: Middle East and Africa ENT Devices Industry Revenue (Million), by End User 2024 & 2032
- Figure 64: Middle East and Africa ENT Devices Industry Volume (K Unit), by End User 2024 & 2032
- Figure 65: Middle East and Africa ENT Devices Industry Revenue Share (%), by End User 2024 & 2032
- Figure 66: Middle East and Africa ENT Devices Industry Volume Share (%), by End User 2024 & 2032
- Figure 67: Middle East and Africa ENT Devices Industry Revenue (Million), by Country 2024 & 2032
- Figure 68: Middle East and Africa ENT Devices Industry Volume (K Unit), by Country 2024 & 2032
- Figure 69: Middle East and Africa ENT Devices Industry Revenue Share (%), by Country 2024 & 2032
- Figure 70: Middle East and Africa ENT Devices Industry Volume Share (%), by Country 2024 & 2032
- Figure 71: South America ENT Devices Industry Revenue (Million), by Product 2024 & 2032
- Figure 72: South America ENT Devices Industry Volume (K Unit), by Product 2024 & 2032
- Figure 73: South America ENT Devices Industry Revenue Share (%), by Product 2024 & 2032
- Figure 74: South America ENT Devices Industry Volume Share (%), by Product 2024 & 2032
- Figure 75: South America ENT Devices Industry Revenue (Million), by End User 2024 & 2032
- Figure 76: South America ENT Devices Industry Volume (K Unit), by End User 2024 & 2032
- Figure 77: South America ENT Devices Industry Revenue Share (%), by End User 2024 & 2032
- Figure 78: South America ENT Devices Industry Volume Share (%), by End User 2024 & 2032
- Figure 79: South America ENT Devices Industry Revenue (Million), by Country 2024 & 2032
- Figure 80: South America ENT Devices Industry Volume (K Unit), by Country 2024 & 2032
- Figure 81: South America ENT Devices Industry Revenue Share (%), by Country 2024 & 2032
- Figure 82: South America ENT Devices Industry Volume Share (%), by Country 2024 & 2032
List of Tables
- Table 1: Global ENT Devices Industry Revenue Million Forecast, by Region 2019 & 2032
- Table 2: Global ENT Devices Industry Volume K Unit Forecast, by Region 2019 & 2032
- Table 3: Global ENT Devices Industry Revenue Million Forecast, by Product 2019 & 2032
- Table 4: Global ENT Devices Industry Volume K Unit Forecast, by Product 2019 & 2032
- Table 5: Global ENT Devices Industry Revenue Million Forecast, by End User 2019 & 2032
- Table 6: Global ENT Devices Industry Volume K Unit Forecast, by End User 2019 & 2032
- Table 7: Global ENT Devices Industry Revenue Million Forecast, by Region 2019 & 2032
- Table 8: Global ENT Devices Industry Volume K Unit Forecast, by Region 2019 & 2032
- Table 9: Global ENT Devices Industry Revenue Million Forecast, by Country 2019 & 2032
- Table 10: Global ENT Devices Industry Volume K Unit Forecast, by Country 2019 & 2032
- Table 11: United States ENT Devices Industry Revenue (Million) Forecast, by Application 2019 & 2032
- Table 12: United States ENT Devices Industry Volume (K Unit) Forecast, by Application 2019 & 2032
- Table 13: Canada ENT Devices Industry Revenue (Million) Forecast, by Application 2019 & 2032
- Table 14: Canada ENT Devices Industry Volume (K Unit) Forecast, by Application 2019 & 2032
- Table 15: Mexico ENT Devices Industry Revenue (Million) Forecast, by Application 2019 & 2032
- Table 16: Mexico ENT Devices Industry Volume (K Unit) Forecast, by Application 2019 & 2032
- Table 17: Global ENT Devices Industry Revenue Million Forecast, by Country 2019 & 2032
- Table 18: Global ENT Devices Industry Volume K Unit Forecast, by Country 2019 & 2032
- Table 19: Germany ENT Devices Industry Revenue (Million) Forecast, by Application 2019 & 2032
- Table 20: Germany ENT Devices Industry Volume (K Unit) Forecast, by Application 2019 & 2032
- Table 21: United Kingdom ENT Devices Industry Revenue (Million) Forecast, by Application 2019 & 2032
- Table 22: United Kingdom ENT Devices Industry Volume (K Unit) Forecast, by Application 2019 & 2032
- Table 23: France ENT Devices Industry Revenue (Million) Forecast, by Application 2019 & 2032
- Table 24: France ENT Devices Industry Volume (K Unit) Forecast, by Application 2019 & 2032
- Table 25: Italy ENT Devices Industry Revenue (Million) Forecast, by Application 2019 & 2032
- Table 26: Italy ENT Devices Industry Volume (K Unit) Forecast, by Application 2019 & 2032
- Table 27: Spain ENT Devices Industry Revenue (Million) Forecast, by Application 2019 & 2032
- Table 28: Spain ENT Devices Industry Volume (K Unit) Forecast, by Application 2019 & 2032
- Table 29: Rest of Europe ENT Devices Industry Revenue (Million) Forecast, by Application 2019 & 2032
- Table 30: Rest of Europe ENT Devices Industry Volume (K Unit) Forecast, by Application 2019 & 2032
- Table 31: Global ENT Devices Industry Revenue Million Forecast, by Country 2019 & 2032
- Table 32: Global ENT Devices Industry Volume K Unit Forecast, by Country 2019 & 2032
- Table 33: China ENT Devices Industry Revenue (Million) Forecast, by Application 2019 & 2032
- Table 34: China ENT Devices Industry Volume (K Unit) Forecast, by Application 2019 & 2032
- Table 35: Japan ENT Devices Industry Revenue (Million) Forecast, by Application 2019 & 2032
- Table 36: Japan ENT Devices Industry Volume (K Unit) Forecast, by Application 2019 & 2032
- Table 37: India ENT Devices Industry Revenue (Million) Forecast, by Application 2019 & 2032
- Table 38: India ENT Devices Industry Volume (K Unit) Forecast, by Application 2019 & 2032
- Table 39: Australia ENT Devices Industry Revenue (Million) Forecast, by Application 2019 & 2032
- Table 40: Australia ENT Devices Industry Volume (K Unit) Forecast, by Application 2019 & 2032
- Table 41: South Korea ENT Devices Industry Revenue (Million) Forecast, by Application 2019 & 2032
- Table 42: South Korea ENT Devices Industry Volume (K Unit) Forecast, by Application 2019 & 2032
- Table 43: Rest of Asia Pacific ENT Devices Industry Revenue (Million) Forecast, by Application 2019 & 2032
- Table 44: Rest of Asia Pacific ENT Devices Industry Volume (K Unit) Forecast, by Application 2019 & 2032
- Table 45: Global ENT Devices Industry Revenue Million Forecast, by Country 2019 & 2032
- Table 46: Global ENT Devices Industry Volume K Unit Forecast, by Country 2019 & 2032
- Table 47: GCC ENT Devices Industry Revenue (Million) Forecast, by Application 2019 & 2032
- Table 48: GCC ENT Devices Industry Volume (K Unit) Forecast, by Application 2019 & 2032
- Table 49: South Africa ENT Devices Industry Revenue (Million) Forecast, by Application 2019 & 2032
- Table 50: South Africa ENT Devices Industry Volume (K Unit) Forecast, by Application 2019 & 2032
- Table 51: Rest of Middle East and Africa ENT Devices Industry Revenue (Million) Forecast, by Application 2019 & 2032
- Table 52: Rest of Middle East and Africa ENT Devices Industry Volume (K Unit) Forecast, by Application 2019 & 2032
- Table 53: Global ENT Devices Industry Revenue Million Forecast, by Country 2019 & 2032
- Table 54: Global ENT Devices Industry Volume K Unit Forecast, by Country 2019 & 2032
- Table 55: Brazil ENT Devices Industry Revenue (Million) Forecast, by Application 2019 & 2032
- Table 56: Brazil ENT Devices Industry Volume (K Unit) Forecast, by Application 2019 & 2032
- Table 57: Argentina ENT Devices Industry Revenue (Million) Forecast, by Application 2019 & 2032
- Table 58: Argentina ENT Devices Industry Volume (K Unit) Forecast, by Application 2019 & 2032
- Table 59: Rest of South America ENT Devices Industry Revenue (Million) Forecast, by Application 2019 & 2032
- Table 60: Rest of South America ENT Devices Industry Volume (K Unit) Forecast, by Application 2019 & 2032
- Table 61: Global ENT Devices Industry Revenue Million Forecast, by Product 2019 & 2032
- Table 62: Global ENT Devices Industry Volume K Unit Forecast, by Product 2019 & 2032
- Table 63: Global ENT Devices Industry Revenue Million Forecast, by End User 2019 & 2032
- Table 64: Global ENT Devices Industry Volume K Unit Forecast, by End User 2019 & 2032
- Table 65: Global ENT Devices Industry Revenue Million Forecast, by Country 2019 & 2032
- Table 66: Global ENT Devices Industry Volume K Unit Forecast, by Country 2019 & 2032
- Table 67: United States ENT Devices Industry Revenue (Million) Forecast, by Application 2019 & 2032
- Table 68: United States ENT Devices Industry Volume (K Unit) Forecast, by Application 2019 & 2032
- Table 69: Canada ENT Devices Industry Revenue (Million) Forecast, by Application 2019 & 2032
- Table 70: Canada ENT Devices Industry Volume (K Unit) Forecast, by Application 2019 & 2032
- Table 71: Mexico ENT Devices Industry Revenue (Million) Forecast, by Application 2019 & 2032
- Table 72: Mexico ENT Devices Industry Volume (K Unit) Forecast, by Application 2019 & 2032
- Table 73: Global ENT Devices Industry Revenue Million Forecast, by Product 2019 & 2032
- Table 74: Global ENT Devices Industry Volume K Unit Forecast, by Product 2019 & 2032
- Table 75: Global ENT Devices Industry Revenue Million Forecast, by End User 2019 & 2032
- Table 76: Global ENT Devices Industry Volume K Unit Forecast, by End User 2019 & 2032
- Table 77: Global ENT Devices Industry Revenue Million Forecast, by Country 2019 & 2032
- Table 78: Global ENT Devices Industry Volume K Unit Forecast, by Country 2019 & 2032
- Table 79: Germany ENT Devices Industry Revenue (Million) Forecast, by Application 2019 & 2032
- Table 80: Germany ENT Devices Industry Volume (K Unit) Forecast, by Application 2019 & 2032
- Table 81: United Kingdom ENT Devices Industry Revenue (Million) Forecast, by Application 2019 & 2032
- Table 82: United Kingdom ENT Devices Industry Volume (K Unit) Forecast, by Application 2019 & 2032
- Table 83: France ENT Devices Industry Revenue (Million) Forecast, by Application 2019 & 2032
- Table 84: France ENT Devices Industry Volume (K Unit) Forecast, by Application 2019 & 2032
- Table 85: Italy ENT Devices Industry Revenue (Million) Forecast, by Application 2019 & 2032
- Table 86: Italy ENT Devices Industry Volume (K Unit) Forecast, by Application 2019 & 2032
- Table 87: Spain ENT Devices Industry Revenue (Million) Forecast, by Application 2019 & 2032
- Table 88: Spain ENT Devices Industry Volume (K Unit) Forecast, by Application 2019 & 2032
- Table 89: Rest of Europe ENT Devices Industry Revenue (Million) Forecast, by Application 2019 & 2032
- Table 90: Rest of Europe ENT Devices Industry Volume (K Unit) Forecast, by Application 2019 & 2032
- Table 91: Global ENT Devices Industry Revenue Million Forecast, by Product 2019 & 2032
- Table 92: Global ENT Devices Industry Volume K Unit Forecast, by Product 2019 & 2032
- Table 93: Global ENT Devices Industry Revenue Million Forecast, by End User 2019 & 2032
- Table 94: Global ENT Devices Industry Volume K Unit Forecast, by End User 2019 & 2032
- Table 95: Global ENT Devices Industry Revenue Million Forecast, by Country 2019 & 2032
- Table 96: Global ENT Devices Industry Volume K Unit Forecast, by Country 2019 & 2032
- Table 97: China ENT Devices Industry Revenue (Million) Forecast, by Application 2019 & 2032
- Table 98: China ENT Devices Industry Volume (K Unit) Forecast, by Application 2019 & 2032
- Table 99: Japan ENT Devices Industry Revenue (Million) Forecast, by Application 2019 & 2032
- Table 100: Japan ENT Devices Industry Volume (K Unit) Forecast, by Application 2019 & 2032
- Table 101: India ENT Devices Industry Revenue (Million) Forecast, by Application 2019 & 2032
- Table 102: India ENT Devices Industry Volume (K Unit) Forecast, by Application 2019 & 2032
- Table 103: Australia ENT Devices Industry Revenue (Million) Forecast, by Application 2019 & 2032
- Table 104: Australia ENT Devices Industry Volume (K Unit) Forecast, by Application 2019 & 2032
- Table 105: South Korea ENT Devices Industry Revenue (Million) Forecast, by Application 2019 & 2032
- Table 106: South Korea ENT Devices Industry Volume (K Unit) Forecast, by Application 2019 & 2032
- Table 107: Rest of Asia Pacific ENT Devices Industry Revenue (Million) Forecast, by Application 2019 & 2032
- Table 108: Rest of Asia Pacific ENT Devices Industry Volume (K Unit) Forecast, by Application 2019 & 2032
- Table 109: Global ENT Devices Industry Revenue Million Forecast, by Product 2019 & 2032
- Table 110: Global ENT Devices Industry Volume K Unit Forecast, by Product 2019 & 2032
- Table 111: Global ENT Devices Industry Revenue Million Forecast, by End User 2019 & 2032
- Table 112: Global ENT Devices Industry Volume K Unit Forecast, by End User 2019 & 2032
- Table 113: Global ENT Devices Industry Revenue Million Forecast, by Country 2019 & 2032
- Table 114: Global ENT Devices Industry Volume K Unit Forecast, by Country 2019 & 2032
- Table 115: GCC ENT Devices Industry Revenue (Million) Forecast, by Application 2019 & 2032
- Table 116: GCC ENT Devices Industry Volume (K Unit) Forecast, by Application 2019 & 2032
- Table 117: South Africa ENT Devices Industry Revenue (Million) Forecast, by Application 2019 & 2032
- Table 118: South Africa ENT Devices Industry Volume (K Unit) Forecast, by Application 2019 & 2032
- Table 119: Rest of Middle East and Africa ENT Devices Industry Revenue (Million) Forecast, by Application 2019 & 2032
- Table 120: Rest of Middle East and Africa ENT Devices Industry Volume (K Unit) Forecast, by Application 2019 & 2032
- Table 121: Global ENT Devices Industry Revenue Million Forecast, by Product 2019 & 2032
- Table 122: Global ENT Devices Industry Volume K Unit Forecast, by Product 2019 & 2032
- Table 123: Global ENT Devices Industry Revenue Million Forecast, by End User 2019 & 2032
- Table 124: Global ENT Devices Industry Volume K Unit Forecast, by End User 2019 & 2032
- Table 125: Global ENT Devices Industry Revenue Million Forecast, by Country 2019 & 2032
- Table 126: Global ENT Devices Industry Volume K Unit Forecast, by Country 2019 & 2032
- Table 127: Brazil ENT Devices Industry Revenue (Million) Forecast, by Application 2019 & 2032
- Table 128: Brazil ENT Devices Industry Volume (K Unit) Forecast, by Application 2019 & 2032
- Table 129: Argentina ENT Devices Industry Revenue (Million) Forecast, by Application 2019 & 2032
- Table 130: Argentina ENT Devices Industry Volume (K Unit) Forecast, by Application 2019 & 2032
- Table 131: Rest of South America ENT Devices Industry Revenue (Million) Forecast, by Application 2019 & 2032
- Table 132: Rest of South America ENT Devices Industry Volume (K Unit) Forecast, by Application 2019 & 2032
Frequently Asked Questions
1. What is the projected Compound Annual Growth Rate (CAGR) of the ENT Devices Industry?
The projected CAGR is approximately 6.40%.
2. Which companies are prominent players in the ENT Devices Industry?
Key companies in the market include Starkey Laboratories Inc, Zhejiang Shendasiao Medical Instrument Co Ltd, Sivantos Group (Signia), American Hearing Systems Inc, Medtronic PLC, Fujifilm Corporation, InHealth Technologies, Welch Allyn, Atos Medical, Richard Wolf GmbH, Cochlear Ltd, Stryker Corporation, Olympus Corporation, Nurotron Biotechnology Co Ltd.
3. What are the main segments of the ENT Devices Industry?
The market segments include Product, End User.
4. Can you provide details about the market size?
The market size is estimated to be USD XX Million as of 2022.
5. What are some drivers contributing to market growth?
Increasing Prevalence of Ear. Nose. and Throat Related Disorders; Rising Adoption of Minimally Invasive ENT Procedures; Technological Advancements.
6. What are the notable trends driving market growth?
Hearing Aids Segment is Expected to Account for Fastest Growth Rate during the Forecast Period.
7. Are there any restraints impacting market growth?
High Procedure and Instruments Cost; Social Stigma.
8. Can you provide examples of recent developments in the market?
In February 2022, Medtronic launched its NuVent Eustachian tube dilation balloon, which gives surgeons an outpatient option for some ear, nose, and throat conditions.
9. What pricing options are available for accessing the report?
Pricing options include single-user, multi-user, and enterprise licenses priced at USD 4750, USD 5250, and USD 8750 respectively.
10. Is the market size provided in terms of value or volume?
The market size is provided in terms of value, measured in Million and volume, measured in K Unit.
11. Are there any specific market keywords associated with the report?
Yes, the market keyword associated with the report is "ENT Devices Industry," which aids in identifying and referencing the specific market segment covered.
12. How do I determine which pricing option suits my needs best?
The pricing options vary based on user requirements and access needs. Individual users may opt for single-user licenses, while businesses requiring broader access may choose multi-user or enterprise licenses for cost-effective access to the report.
13. Are there any additional resources or data provided in the ENT Devices Industry report?
While the report offers comprehensive insights, it's advisable to review the specific contents or supplementary materials provided to ascertain if additional resources or data are available.
14. How can I stay updated on further developments or reports in the ENT Devices Industry?
To stay informed about further developments, trends, and reports in the ENT Devices Industry, consider subscribing to industry newsletters, following relevant companies and organizations, or regularly checking reputable industry news sources and publications.
Methodology
Step 1 - Identification of Relevant Samples Size from Population Database


Step 2 - Approaches for Defining Global Market Size (Value, Volume* & Price*)

Note*: In applicable scenarios
Step 3 - Data Sources
Primary Research
- Web Analytics
- Survey Reports
- Research Institute
- Latest Research Reports
- Opinion Leaders
Secondary Research
- Annual Reports
- White Paper
- Latest Press Release
- Industry Association
- Paid Database
- Investor Presentations

Step 4 - Data Triangulation
Involves using different sources of information in order to increase the validity of a study
These sources are likely to be stakeholders in a program - participants, other researchers, program staff, other community members, and so on.
Then we put all data in single framework & apply various statistical tools to find out the dynamic on the market.
During the analysis stage, feedback from the stakeholder groups would be compared to determine areas of agreement as well as areas of divergence
