

Key Insights
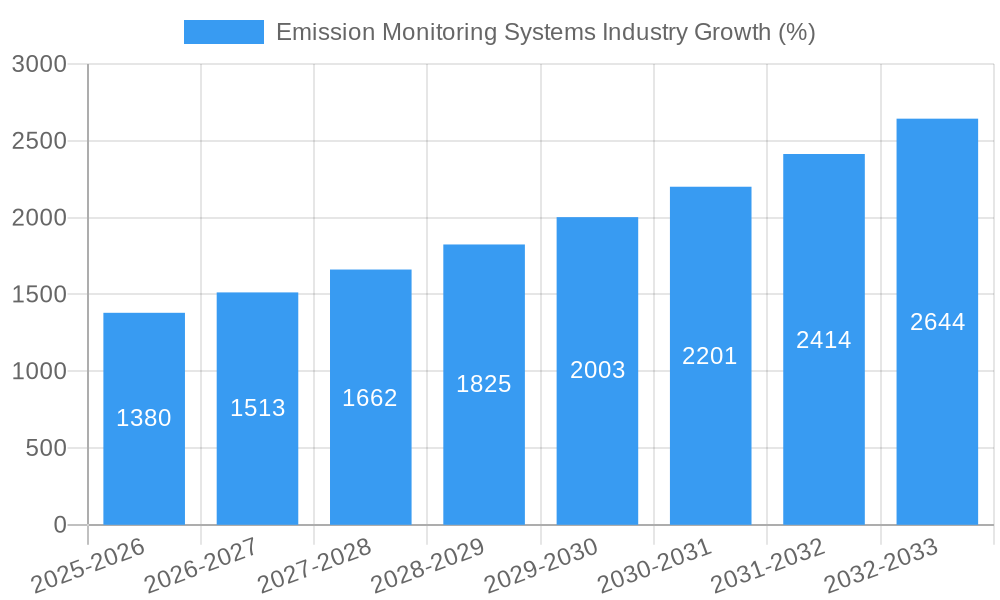
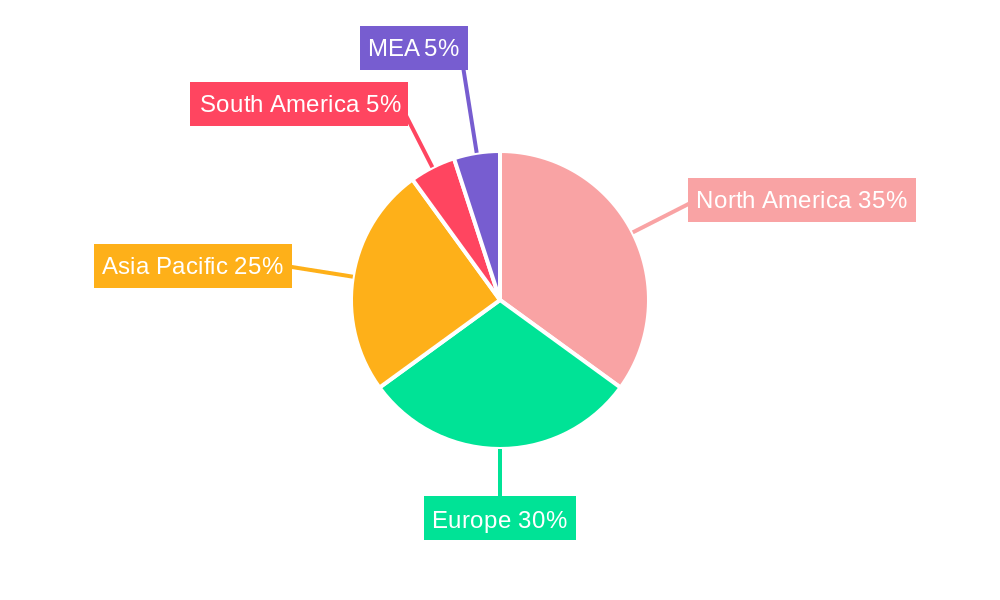
The Emission Monitoring Systems (EMS) market is experiencing robust growth, projected to reach a substantial size, driven by stringent environmental regulations globally and the increasing need for industrial process optimization. A Compound Annual Growth Rate (CAGR) of 9.20% from 2019 to 2024 indicates a significant upward trajectory. This growth is fueled by several key factors. Firstly, the oil & gas, metal and mining, and power generation sectors are major contributors, facing intense pressure to reduce emissions and enhance operational efficiency. The increasing adoption of advanced technologies like AI-powered analytics and the Internet of Things (IoT) is further accelerating market expansion, enabling real-time monitoring and predictive maintenance. Furthermore, governmental initiatives promoting cleaner energy sources and stricter emission standards are creating a compelling demand for sophisticated EMS solutions. The market is segmented by end-user (oil & gas, metal & mining, pharmaceutical, power generation, chemicals, and others) and component (hardware, software, services), with hardware currently dominating but software and service segments showing rapid growth potential. Geographically, North America and Europe currently hold significant market share, but the Asia-Pacific region is poised for rapid expansion driven by industrialization and increasing environmental awareness. While some challenges exist, such as high initial investment costs and the complexity of integrating EMS into existing infrastructure, the long-term benefits of reduced emissions, improved operational efficiency, and compliance with regulations will continue to drive market growth.
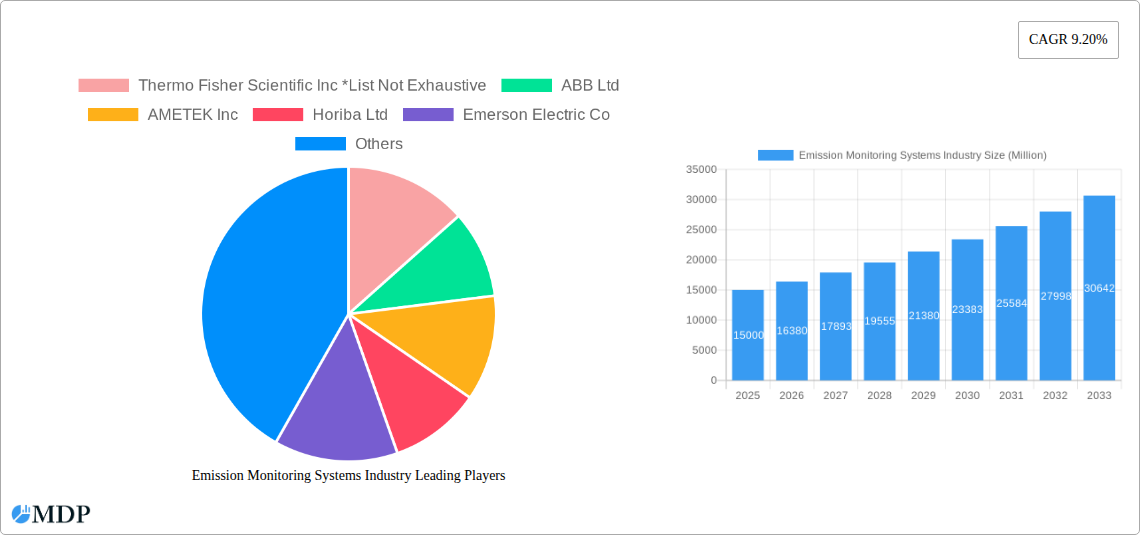
The competitive landscape is characterized by established players like Thermo Fisher Scientific, ABB, AMETEK, Horiba, Emerson Electric, Siemens, Sick AG, Rockwell Automation, General Electric, and Teledyne Technologies. These companies are actively engaging in research and development, strategic partnerships, and acquisitions to enhance their market position and expand their product offerings. The future of the EMS market looks promising, with continued technological advancements, evolving regulatory frameworks, and the growing awareness of environmental sustainability bolstering demand for comprehensive and efficient emission monitoring solutions. The market is expected to see further diversification in terms of both technology and applications, creating lucrative opportunities for both existing and emerging players.
Emission Monitoring Systems Industry Market Report: 2019-2033
This comprehensive report provides an in-depth analysis of the Emission Monitoring Systems industry, projecting robust growth from 2025 to 2033. The report covers market dynamics, leading players, technological advancements, and key growth opportunities, offering invaluable insights for industry stakeholders. With a detailed study period spanning 2019-2033, a base year of 2025, and an estimated year of 2025, this report is essential for strategic planning and informed decision-making. The market is expected to reach xx Million by 2033, showcasing significant potential for investors and businesses.
Emission Monitoring Systems Industry Market Dynamics & Concentration
The Emission Monitoring Systems market is characterized by a moderately consolidated landscape, with key players like Thermo Fisher Scientific Inc, ABB Ltd, AMETEK Inc, Horiba Ltd, Emerson Electric Co, Siemens AG, Sick AG, Rockwell Automation Inc, General Electric Company, and Teledyne Technologies Inc holding significant market share. Market concentration is expected to remain relatively stable throughout the forecast period, although strategic mergers and acquisitions (M&A) are anticipated to continue shaping the competitive landscape. In the historical period (2019-2024), the industry witnessed approximately xx M&A deals, with an average deal value of xx Million. Innovation drivers include stringent environmental regulations, the increasing adoption of Industry 4.0 technologies, and the growing demand for real-time emission data. Product substitutes, such as manual monitoring methods, are gradually being replaced due to their inherent limitations in accuracy and efficiency. End-user trends indicate a strong focus on reducing operational costs and improving environmental performance across various sectors.
- Market Share: Thermo Fisher Scientific Inc holds approximately xx% of the market share (2024 estimate). Other leading players hold shares ranging from xx% to xx%.
- M&A Activity: A total of xx M&A deals were observed from 2019-2024, indicating a trend of consolidation within the industry.
- Regulatory Frameworks: Stringent emission standards and compliance requirements are major drivers of market growth.
- Innovation Drivers: Advancements in sensor technology, data analytics, and cloud computing are transforming the industry.
Emission Monitoring Systems Industry Industry Trends & Analysis
The Emission Monitoring Systems market is experiencing robust growth, driven primarily by increasing environmental concerns, stricter emission regulations, and the growing adoption of advanced monitoring technologies. The market registered a CAGR of xx% during the historical period (2019-2024) and is projected to maintain a healthy CAGR of xx% during the forecast period (2025-2033). Technological disruptions, such as the integration of artificial intelligence (AI) and machine learning (ML) for predictive maintenance and data analysis, are significantly enhancing the capabilities of emission monitoring systems. Consumer preferences are shifting towards solutions offering enhanced accuracy, reliability, and ease of integration with existing infrastructure. Competitive dynamics are characterized by intense competition among established players and the emergence of innovative start-ups. Market penetration is highest in developed regions, but growth is expected to accelerate in emerging economies due to rising industrialization and government initiatives promoting environmental sustainability. The global market size was valued at xx Million in 2024 and is projected to reach xx Million by 2033.
Leading Markets & Segments in Emission Monitoring Systems Industry
The Oil & Gas sector represents the largest end-user segment, accounting for approximately xx% of the total market revenue in 2024. This is due to stringent regulations and the high emission intensity of oil and gas operations. The Power Generation segment is another significant market, driven by the growing need to comply with emission limits from power plants. Geographically, North America and Europe are currently leading the market, benefiting from mature industrial infrastructure and robust regulatory frameworks. However, Asia-Pacific is expected to exhibit the fastest growth rate due to rapid industrialization and investments in renewable energy infrastructure.
- By End User:
- Oil & Gas: Driven by stringent emission regulations and the need for accurate emission monitoring.
- Power Generation: Growing adoption of emission monitoring systems to comply with increasingly stringent emission standards.
- Metal and Mining: High emission intensity of mining operations drives demand for emission monitoring solutions.
- Chemicals: Strict environmental regulations in the chemical industry fuels the demand for advanced emission monitoring technologies.
- By Component:
- Hardware: Continuous advancements in sensor technology and data acquisition systems fuel growth in this segment.
- Software: Increased demand for data analytics and reporting capabilities drive demand in the software segment.
- Service: Growing need for maintenance, calibration, and data interpretation services supports the service sector.
- Key Drivers:
- Stringent environmental regulations: Governments worldwide are enacting stricter emission standards, driving demand for emission monitoring systems.
- Technological advancements: Innovations in sensor technology, data analytics, and cloud computing improve accuracy and efficiency.
- Economic growth: Increasing industrialization and economic growth in emerging economies are expanding the market.
Emission Monitoring Systems Industry Product Developments
Recent product innovations focus on improving accuracy, reliability, and ease of use. Manufacturers are integrating advanced technologies like AI and ML to enhance data analytics and predictive maintenance capabilities. Miniaturization of sensors and the development of wireless communication technologies are enabling more efficient and cost-effective monitoring solutions. The market is witnessing a shift towards cloud-based platforms for data management and analysis, offering enhanced scalability and accessibility. This is improving market fit and creating competitive advantages by providing clients with real-time insights and improved data visualization.
Key Drivers of Emission Monitoring Systems Industry Growth
The Emission Monitoring Systems market is propelled by several key drivers: stringent environmental regulations globally are mandating emission monitoring, leading to increased demand. Technological advancements, particularly in sensor technology and data analytics, are improving the accuracy, efficiency, and affordability of monitoring systems. Furthermore, the growing awareness of environmental sustainability among businesses is driving adoption, along with government incentives and subsidies for clean technologies.
Challenges in the Emission Monitoring Systems Industry Market
The industry faces challenges such as high initial investment costs for advanced systems, complex regulatory compliance requirements, and the need for skilled personnel for installation and maintenance. Supply chain disruptions can also impact the availability and pricing of components. Intense competition among established players and the emergence of new entrants present further challenges. These factors can lead to reduced profit margins and slower market penetration in certain regions. The cost of these systems may also deter some smaller companies, limiting the total addressable market.
Emerging Opportunities in Emission Monitoring Systems Industry
Long-term growth is fueled by emerging opportunities in developing economies, where industrialization is rapidly expanding, creating significant demand for emission monitoring solutions. The integration of IoT and AI technologies opens avenues for advanced analytics, predictive maintenance, and real-time emission tracking. Strategic partnerships between emission monitoring system providers and end-users can accelerate market adoption. This can lead to more customized and tailored solutions.
Leading Players in the Emission Monitoring Systems Industry Sector
- Thermo Fisher Scientific Inc
- ABB Ltd
- AMETEK Inc
- Horiba Ltd
- Emerson Electric Co
- Siemens AG
- Sick AG
- Rockwell Automation Inc
- General Electric Company
- Teledyne Technologies Inc
Key Milestones in Emission Monitoring Systems Industry Industry
- April 2022: ClassNK launched 'ClassNK ZETA (Zero Emission Transition Accelerator),' a GHG emissions management tool. This significantly impacted the market by providing a standardized tool for emissions tracking.
- March 2022: Normative, a Google-backed start-up, released a free carbon emissions tracker for small businesses. This broadened market access and increased awareness of emission monitoring tools.
Strategic Outlook for Emission Monitoring Systems Industry Market
The Emission Monitoring Systems market holds significant long-term growth potential, driven by continued technological advancements, tightening environmental regulations, and the growing awareness of climate change. Strategic partnerships and investments in research and development will be crucial for maintaining a competitive edge. Focusing on providing comprehensive solutions that integrate hardware, software, and services will be key to capturing market share. Expansion into emerging markets and the development of customized solutions for specific industry sectors will also play a critical role in future growth.
Emission Monitoring Systems Industry Segmentation
-
1. Component
- 1.1. Hardware
- 1.2. Software
- 1.3. Service
-
2. End User
- 2.1. Oil & Gas
- 2.2. Metal and Mining
- 2.3. Pharmaceutical
- 2.4. Power Generation
- 2.5. Chemicals
- 2.6. Other End Users
Emission Monitoring Systems Industry Segmentation By Geography
- 1. North America
- 2. Europe
- 3. Asia Pacific
- 4. Latin America
- 5. Middle East and Africa
Emission Monitoring Systems Industry REPORT HIGHLIGHTS
| Aspects | Details |
|---|---|
| Study Period | 2019-2033 |
| Base Year | 2024 |
| Estimated Year | 2025 |
| Forecast Period | 2025-2033 |
| Historical Period | 2019-2024 |
| Growth Rate | CAGR of 9.20% from 2019-2033 |
| Segmentation |
|
Table of Contents
- 1. Introduction
- 1.1. Research Scope
- 1.2. Market Segmentation
- 1.3. Research Methodology
- 1.4. Definitions and Assumptions
- 2. Executive Summary
- 2.1. Introduction
- 3. Market Dynamics
- 3.1. Introduction
- 3.2. Market Drivers
- 3.2.1. Stringent Legal and Environmental Regulations; Increasing Health and Safety Issues
- 3.3. Market Restrains
- 3.3.1. High Cost of These Systems for Regular Maintenance
- 3.4. Market Trends
- 3.4.1. Oil & Gas Segment is Expected to Witness Significant Growth
- 4. Market Factor Analysis
- 4.1. Porters Five Forces
- 4.2. Supply/Value Chain
- 4.3. PESTEL analysis
- 4.4. Market Entropy
- 4.5. Patent/Trademark Analysis
- 5. Global Emission Monitoring Systems Industry Analysis, Insights and Forecast, 2019-2031
- 5.1. Market Analysis, Insights and Forecast - by Component
- 5.1.1. Hardware
- 5.1.2. Software
- 5.1.3. Service
- 5.2. Market Analysis, Insights and Forecast - by End User
- 5.2.1. Oil & Gas
- 5.2.2. Metal and Mining
- 5.2.3. Pharmaceutical
- 5.2.4. Power Generation
- 5.2.5. Chemicals
- 5.2.6. Other End Users
- 5.3. Market Analysis, Insights and Forecast - by Region
- 5.3.1. North America
- 5.3.2. Europe
- 5.3.3. Asia Pacific
- 5.3.4. Latin America
- 5.3.5. Middle East and Africa
- 5.1. Market Analysis, Insights and Forecast - by Component
- 6. North America Emission Monitoring Systems Industry Analysis, Insights and Forecast, 2019-2031
- 6.1. Market Analysis, Insights and Forecast - by Component
- 6.1.1. Hardware
- 6.1.2. Software
- 6.1.3. Service
- 6.2. Market Analysis, Insights and Forecast - by End User
- 6.2.1. Oil & Gas
- 6.2.2. Metal and Mining
- 6.2.3. Pharmaceutical
- 6.2.4. Power Generation
- 6.2.5. Chemicals
- 6.2.6. Other End Users
- 6.1. Market Analysis, Insights and Forecast - by Component
- 7. Europe Emission Monitoring Systems Industry Analysis, Insights and Forecast, 2019-2031
- 7.1. Market Analysis, Insights and Forecast - by Component
- 7.1.1. Hardware
- 7.1.2. Software
- 7.1.3. Service
- 7.2. Market Analysis, Insights and Forecast - by End User
- 7.2.1. Oil & Gas
- 7.2.2. Metal and Mining
- 7.2.3. Pharmaceutical
- 7.2.4. Power Generation
- 7.2.5. Chemicals
- 7.2.6. Other End Users
- 7.1. Market Analysis, Insights and Forecast - by Component
- 8. Asia Pacific Emission Monitoring Systems Industry Analysis, Insights and Forecast, 2019-2031
- 8.1. Market Analysis, Insights and Forecast - by Component
- 8.1.1. Hardware
- 8.1.2. Software
- 8.1.3. Service
- 8.2. Market Analysis, Insights and Forecast - by End User
- 8.2.1. Oil & Gas
- 8.2.2. Metal and Mining
- 8.2.3. Pharmaceutical
- 8.2.4. Power Generation
- 8.2.5. Chemicals
- 8.2.6. Other End Users
- 8.1. Market Analysis, Insights and Forecast - by Component
- 9. Latin America Emission Monitoring Systems Industry Analysis, Insights and Forecast, 2019-2031
- 9.1. Market Analysis, Insights and Forecast - by Component
- 9.1.1. Hardware
- 9.1.2. Software
- 9.1.3. Service
- 9.2. Market Analysis, Insights and Forecast - by End User
- 9.2.1. Oil & Gas
- 9.2.2. Metal and Mining
- 9.2.3. Pharmaceutical
- 9.2.4. Power Generation
- 9.2.5. Chemicals
- 9.2.6. Other End Users
- 9.1. Market Analysis, Insights and Forecast - by Component
- 10. Middle East and Africa Emission Monitoring Systems Industry Analysis, Insights and Forecast, 2019-2031
- 10.1. Market Analysis, Insights and Forecast - by Component
- 10.1.1. Hardware
- 10.1.2. Software
- 10.1.3. Service
- 10.2. Market Analysis, Insights and Forecast - by End User
- 10.2.1. Oil & Gas
- 10.2.2. Metal and Mining
- 10.2.3. Pharmaceutical
- 10.2.4. Power Generation
- 10.2.5. Chemicals
- 10.2.6. Other End Users
- 10.1. Market Analysis, Insights and Forecast - by Component
- 11. North America Emission Monitoring Systems Industry Analysis, Insights and Forecast, 2019-2031
- 11.1. Market Analysis, Insights and Forecast - By Country/Sub-region
- 11.1.1 United States
- 11.1.2 Canada
- 11.1.3 Mexico
- 12. Europe Emission Monitoring Systems Industry Analysis, Insights and Forecast, 2019-2031
- 12.1. Market Analysis, Insights and Forecast - By Country/Sub-region
- 12.1.1 Germany
- 12.1.2 United Kingdom
- 12.1.3 France
- 12.1.4 Spain
- 12.1.5 Italy
- 12.1.6 Spain
- 12.1.7 Belgium
- 12.1.8 Netherland
- 12.1.9 Nordics
- 12.1.10 Rest of Europe
- 13. Asia Pacific Emission Monitoring Systems Industry Analysis, Insights and Forecast, 2019-2031
- 13.1. Market Analysis, Insights and Forecast - By Country/Sub-region
- 13.1.1 China
- 13.1.2 Japan
- 13.1.3 India
- 13.1.4 South Korea
- 13.1.5 Southeast Asia
- 13.1.6 Australia
- 13.1.7 Indonesia
- 13.1.8 Phillipes
- 13.1.9 Singapore
- 13.1.10 Thailandc
- 13.1.11 Rest of Asia Pacific
- 14. South America Emission Monitoring Systems Industry Analysis, Insights and Forecast, 2019-2031
- 14.1. Market Analysis, Insights and Forecast - By Country/Sub-region
- 14.1.1 Brazil
- 14.1.2 Argentina
- 14.1.3 Peru
- 14.1.4 Chile
- 14.1.5 Colombia
- 14.1.6 Ecuador
- 14.1.7 Venezuela
- 14.1.8 Rest of South America
- 15. North America Emission Monitoring Systems Industry Analysis, Insights and Forecast, 2019-2031
- 15.1. Market Analysis, Insights and Forecast - By Country/Sub-region
- 15.1.1 United States
- 15.1.2 Canada
- 15.1.3 Mexico
- 16. MEA Emission Monitoring Systems Industry Analysis, Insights and Forecast, 2019-2031
- 16.1. Market Analysis, Insights and Forecast - By Country/Sub-region
- 16.1.1 United Arab Emirates
- 16.1.2 Saudi Arabia
- 16.1.3 South Africa
- 16.1.4 Rest of Middle East and Africa
- 17. Competitive Analysis
- 17.1. Global Market Share Analysis 2024
- 17.2. Company Profiles
- 17.2.1 Thermo Fisher Scientific Inc *List Not Exhaustive
- 17.2.1.1. Overview
- 17.2.1.2. Products
- 17.2.1.3. SWOT Analysis
- 17.2.1.4. Recent Developments
- 17.2.1.5. Financials (Based on Availability)
- 17.2.2 ABB Ltd
- 17.2.2.1. Overview
- 17.2.2.2. Products
- 17.2.2.3. SWOT Analysis
- 17.2.2.4. Recent Developments
- 17.2.2.5. Financials (Based on Availability)
- 17.2.3 AMETEK Inc
- 17.2.3.1. Overview
- 17.2.3.2. Products
- 17.2.3.3. SWOT Analysis
- 17.2.3.4. Recent Developments
- 17.2.3.5. Financials (Based on Availability)
- 17.2.4 Horiba Ltd
- 17.2.4.1. Overview
- 17.2.4.2. Products
- 17.2.4.3. SWOT Analysis
- 17.2.4.4. Recent Developments
- 17.2.4.5. Financials (Based on Availability)
- 17.2.5 Emerson Electric Co
- 17.2.5.1. Overview
- 17.2.5.2. Products
- 17.2.5.3. SWOT Analysis
- 17.2.5.4. Recent Developments
- 17.2.5.5. Financials (Based on Availability)
- 17.2.6 Siemens AG
- 17.2.6.1. Overview
- 17.2.6.2. Products
- 17.2.6.3. SWOT Analysis
- 17.2.6.4. Recent Developments
- 17.2.6.5. Financials (Based on Availability)
- 17.2.7 Sick AG
- 17.2.7.1. Overview
- 17.2.7.2. Products
- 17.2.7.3. SWOT Analysis
- 17.2.7.4. Recent Developments
- 17.2.7.5. Financials (Based on Availability)
- 17.2.8 Rockwell Automation Inc
- 17.2.8.1. Overview
- 17.2.8.2. Products
- 17.2.8.3. SWOT Analysis
- 17.2.8.4. Recent Developments
- 17.2.8.5. Financials (Based on Availability)
- 17.2.9 General Electric Company
- 17.2.9.1. Overview
- 17.2.9.2. Products
- 17.2.9.3. SWOT Analysis
- 17.2.9.4. Recent Developments
- 17.2.9.5. Financials (Based on Availability)
- 17.2.10 Teledyne Technologies Inc
- 17.2.10.1. Overview
- 17.2.10.2. Products
- 17.2.10.3. SWOT Analysis
- 17.2.10.4. Recent Developments
- 17.2.10.5. Financials (Based on Availability)
- 17.2.1 Thermo Fisher Scientific Inc *List Not Exhaustive
List of Figures
- Figure 1: Global Emission Monitoring Systems Industry Revenue Breakdown (Million, %) by Region 2024 & 2032
- Figure 2: North America Emission Monitoring Systems Industry Revenue (Million), by Country 2024 & 2032
- Figure 3: North America Emission Monitoring Systems Industry Revenue Share (%), by Country 2024 & 2032
- Figure 4: Europe Emission Monitoring Systems Industry Revenue (Million), by Country 2024 & 2032
- Figure 5: Europe Emission Monitoring Systems Industry Revenue Share (%), by Country 2024 & 2032
- Figure 6: Asia Pacific Emission Monitoring Systems Industry Revenue (Million), by Country 2024 & 2032
- Figure 7: Asia Pacific Emission Monitoring Systems Industry Revenue Share (%), by Country 2024 & 2032
- Figure 8: South America Emission Monitoring Systems Industry Revenue (Million), by Country 2024 & 2032
- Figure 9: South America Emission Monitoring Systems Industry Revenue Share (%), by Country 2024 & 2032
- Figure 10: North America Emission Monitoring Systems Industry Revenue (Million), by Country 2024 & 2032
- Figure 11: North America Emission Monitoring Systems Industry Revenue Share (%), by Country 2024 & 2032
- Figure 12: MEA Emission Monitoring Systems Industry Revenue (Million), by Country 2024 & 2032
- Figure 13: MEA Emission Monitoring Systems Industry Revenue Share (%), by Country 2024 & 2032
- Figure 14: North America Emission Monitoring Systems Industry Revenue (Million), by Component 2024 & 2032
- Figure 15: North America Emission Monitoring Systems Industry Revenue Share (%), by Component 2024 & 2032
- Figure 16: North America Emission Monitoring Systems Industry Revenue (Million), by End User 2024 & 2032
- Figure 17: North America Emission Monitoring Systems Industry Revenue Share (%), by End User 2024 & 2032
- Figure 18: North America Emission Monitoring Systems Industry Revenue (Million), by Country 2024 & 2032
- Figure 19: North America Emission Monitoring Systems Industry Revenue Share (%), by Country 2024 & 2032
- Figure 20: Europe Emission Monitoring Systems Industry Revenue (Million), by Component 2024 & 2032
- Figure 21: Europe Emission Monitoring Systems Industry Revenue Share (%), by Component 2024 & 2032
- Figure 22: Europe Emission Monitoring Systems Industry Revenue (Million), by End User 2024 & 2032
- Figure 23: Europe Emission Monitoring Systems Industry Revenue Share (%), by End User 2024 & 2032
- Figure 24: Europe Emission Monitoring Systems Industry Revenue (Million), by Country 2024 & 2032
- Figure 25: Europe Emission Monitoring Systems Industry Revenue Share (%), by Country 2024 & 2032
- Figure 26: Asia Pacific Emission Monitoring Systems Industry Revenue (Million), by Component 2024 & 2032
- Figure 27: Asia Pacific Emission Monitoring Systems Industry Revenue Share (%), by Component 2024 & 2032
- Figure 28: Asia Pacific Emission Monitoring Systems Industry Revenue (Million), by End User 2024 & 2032
- Figure 29: Asia Pacific Emission Monitoring Systems Industry Revenue Share (%), by End User 2024 & 2032
- Figure 30: Asia Pacific Emission Monitoring Systems Industry Revenue (Million), by Country 2024 & 2032
- Figure 31: Asia Pacific Emission Monitoring Systems Industry Revenue Share (%), by Country 2024 & 2032
- Figure 32: Latin America Emission Monitoring Systems Industry Revenue (Million), by Component 2024 & 2032
- Figure 33: Latin America Emission Monitoring Systems Industry Revenue Share (%), by Component 2024 & 2032
- Figure 34: Latin America Emission Monitoring Systems Industry Revenue (Million), by End User 2024 & 2032
- Figure 35: Latin America Emission Monitoring Systems Industry Revenue Share (%), by End User 2024 & 2032
- Figure 36: Latin America Emission Monitoring Systems Industry Revenue (Million), by Country 2024 & 2032
- Figure 37: Latin America Emission Monitoring Systems Industry Revenue Share (%), by Country 2024 & 2032
- Figure 38: Middle East and Africa Emission Monitoring Systems Industry Revenue (Million), by Component 2024 & 2032
- Figure 39: Middle East and Africa Emission Monitoring Systems Industry Revenue Share (%), by Component 2024 & 2032
- Figure 40: Middle East and Africa Emission Monitoring Systems Industry Revenue (Million), by End User 2024 & 2032
- Figure 41: Middle East and Africa Emission Monitoring Systems Industry Revenue Share (%), by End User 2024 & 2032
- Figure 42: Middle East and Africa Emission Monitoring Systems Industry Revenue (Million), by Country 2024 & 2032
- Figure 43: Middle East and Africa Emission Monitoring Systems Industry Revenue Share (%), by Country 2024 & 2032
List of Tables
- Table 1: Global Emission Monitoring Systems Industry Revenue Million Forecast, by Region 2019 & 2032
- Table 2: Global Emission Monitoring Systems Industry Revenue Million Forecast, by Component 2019 & 2032
- Table 3: Global Emission Monitoring Systems Industry Revenue Million Forecast, by End User 2019 & 2032
- Table 4: Global Emission Monitoring Systems Industry Revenue Million Forecast, by Region 2019 & 2032
- Table 5: Global Emission Monitoring Systems Industry Revenue Million Forecast, by Country 2019 & 2032
- Table 6: United States Emission Monitoring Systems Industry Revenue (Million) Forecast, by Application 2019 & 2032
- Table 7: Canada Emission Monitoring Systems Industry Revenue (Million) Forecast, by Application 2019 & 2032
- Table 8: Mexico Emission Monitoring Systems Industry Revenue (Million) Forecast, by Application 2019 & 2032
- Table 9: Global Emission Monitoring Systems Industry Revenue Million Forecast, by Country 2019 & 2032
- Table 10: Germany Emission Monitoring Systems Industry Revenue (Million) Forecast, by Application 2019 & 2032
- Table 11: United Kingdom Emission Monitoring Systems Industry Revenue (Million) Forecast, by Application 2019 & 2032
- Table 12: France Emission Monitoring Systems Industry Revenue (Million) Forecast, by Application 2019 & 2032
- Table 13: Spain Emission Monitoring Systems Industry Revenue (Million) Forecast, by Application 2019 & 2032
- Table 14: Italy Emission Monitoring Systems Industry Revenue (Million) Forecast, by Application 2019 & 2032
- Table 15: Spain Emission Monitoring Systems Industry Revenue (Million) Forecast, by Application 2019 & 2032
- Table 16: Belgium Emission Monitoring Systems Industry Revenue (Million) Forecast, by Application 2019 & 2032
- Table 17: Netherland Emission Monitoring Systems Industry Revenue (Million) Forecast, by Application 2019 & 2032
- Table 18: Nordics Emission Monitoring Systems Industry Revenue (Million) Forecast, by Application 2019 & 2032
- Table 19: Rest of Europe Emission Monitoring Systems Industry Revenue (Million) Forecast, by Application 2019 & 2032
- Table 20: Global Emission Monitoring Systems Industry Revenue Million Forecast, by Country 2019 & 2032
- Table 21: China Emission Monitoring Systems Industry Revenue (Million) Forecast, by Application 2019 & 2032
- Table 22: Japan Emission Monitoring Systems Industry Revenue (Million) Forecast, by Application 2019 & 2032
- Table 23: India Emission Monitoring Systems Industry Revenue (Million) Forecast, by Application 2019 & 2032
- Table 24: South Korea Emission Monitoring Systems Industry Revenue (Million) Forecast, by Application 2019 & 2032
- Table 25: Southeast Asia Emission Monitoring Systems Industry Revenue (Million) Forecast, by Application 2019 & 2032
- Table 26: Australia Emission Monitoring Systems Industry Revenue (Million) Forecast, by Application 2019 & 2032
- Table 27: Indonesia Emission Monitoring Systems Industry Revenue (Million) Forecast, by Application 2019 & 2032
- Table 28: Phillipes Emission Monitoring Systems Industry Revenue (Million) Forecast, by Application 2019 & 2032
- Table 29: Singapore Emission Monitoring Systems Industry Revenue (Million) Forecast, by Application 2019 & 2032
- Table 30: Thailandc Emission Monitoring Systems Industry Revenue (Million) Forecast, by Application 2019 & 2032
- Table 31: Rest of Asia Pacific Emission Monitoring Systems Industry Revenue (Million) Forecast, by Application 2019 & 2032
- Table 32: Global Emission Monitoring Systems Industry Revenue Million Forecast, by Country 2019 & 2032
- Table 33: Brazil Emission Monitoring Systems Industry Revenue (Million) Forecast, by Application 2019 & 2032
- Table 34: Argentina Emission Monitoring Systems Industry Revenue (Million) Forecast, by Application 2019 & 2032
- Table 35: Peru Emission Monitoring Systems Industry Revenue (Million) Forecast, by Application 2019 & 2032
- Table 36: Chile Emission Monitoring Systems Industry Revenue (Million) Forecast, by Application 2019 & 2032
- Table 37: Colombia Emission Monitoring Systems Industry Revenue (Million) Forecast, by Application 2019 & 2032
- Table 38: Ecuador Emission Monitoring Systems Industry Revenue (Million) Forecast, by Application 2019 & 2032
- Table 39: Venezuela Emission Monitoring Systems Industry Revenue (Million) Forecast, by Application 2019 & 2032
- Table 40: Rest of South America Emission Monitoring Systems Industry Revenue (Million) Forecast, by Application 2019 & 2032
- Table 41: Global Emission Monitoring Systems Industry Revenue Million Forecast, by Country 2019 & 2032
- Table 42: United States Emission Monitoring Systems Industry Revenue (Million) Forecast, by Application 2019 & 2032
- Table 43: Canada Emission Monitoring Systems Industry Revenue (Million) Forecast, by Application 2019 & 2032
- Table 44: Mexico Emission Monitoring Systems Industry Revenue (Million) Forecast, by Application 2019 & 2032
- Table 45: Global Emission Monitoring Systems Industry Revenue Million Forecast, by Country 2019 & 2032
- Table 46: United Arab Emirates Emission Monitoring Systems Industry Revenue (Million) Forecast, by Application 2019 & 2032
- Table 47: Saudi Arabia Emission Monitoring Systems Industry Revenue (Million) Forecast, by Application 2019 & 2032
- Table 48: South Africa Emission Monitoring Systems Industry Revenue (Million) Forecast, by Application 2019 & 2032
- Table 49: Rest of Middle East and Africa Emission Monitoring Systems Industry Revenue (Million) Forecast, by Application 2019 & 2032
- Table 50: Global Emission Monitoring Systems Industry Revenue Million Forecast, by Component 2019 & 2032
- Table 51: Global Emission Monitoring Systems Industry Revenue Million Forecast, by End User 2019 & 2032
- Table 52: Global Emission Monitoring Systems Industry Revenue Million Forecast, by Country 2019 & 2032
- Table 53: Global Emission Monitoring Systems Industry Revenue Million Forecast, by Component 2019 & 2032
- Table 54: Global Emission Monitoring Systems Industry Revenue Million Forecast, by End User 2019 & 2032
- Table 55: Global Emission Monitoring Systems Industry Revenue Million Forecast, by Country 2019 & 2032
- Table 56: Global Emission Monitoring Systems Industry Revenue Million Forecast, by Component 2019 & 2032
- Table 57: Global Emission Monitoring Systems Industry Revenue Million Forecast, by End User 2019 & 2032
- Table 58: Global Emission Monitoring Systems Industry Revenue Million Forecast, by Country 2019 & 2032
- Table 59: Global Emission Monitoring Systems Industry Revenue Million Forecast, by Component 2019 & 2032
- Table 60: Global Emission Monitoring Systems Industry Revenue Million Forecast, by End User 2019 & 2032
- Table 61: Global Emission Monitoring Systems Industry Revenue Million Forecast, by Country 2019 & 2032
- Table 62: Global Emission Monitoring Systems Industry Revenue Million Forecast, by Component 2019 & 2032
- Table 63: Global Emission Monitoring Systems Industry Revenue Million Forecast, by End User 2019 & 2032
- Table 64: Global Emission Monitoring Systems Industry Revenue Million Forecast, by Country 2019 & 2032
Frequently Asked Questions
1. What is the projected Compound Annual Growth Rate (CAGR) of the Emission Monitoring Systems Industry?
The projected CAGR is approximately 9.20%.
2. Which companies are prominent players in the Emission Monitoring Systems Industry?
Key companies in the market include Thermo Fisher Scientific Inc *List Not Exhaustive, ABB Ltd, AMETEK Inc, Horiba Ltd, Emerson Electric Co, Siemens AG, Sick AG, Rockwell Automation Inc, General Electric Company, Teledyne Technologies Inc.
3. What are the main segments of the Emission Monitoring Systems Industry?
The market segments include Component, End User.
4. Can you provide details about the market size?
The market size is estimated to be USD XX Million as of 2022.
5. What are some drivers contributing to market growth?
Stringent Legal and Environmental Regulations; Increasing Health and Safety Issues.
6. What are the notable trends driving market growth?
Oil & Gas Segment is Expected to Witness Significant Growth.
7. Are there any restraints impacting market growth?
High Cost of These Systems for Regular Maintenance.
8. Can you provide examples of recent developments in the market?
April 2022 - ClassNK has launched 'ClassNK ZETA (Zero Emission Transition Accelerator),' a GHG emissions management tool that allows users to track accurate CO2 emissions and confirm and simulate CII ratings.
9. What pricing options are available for accessing the report?
Pricing options include single-user, multi-user, and enterprise licenses priced at USD 4750, USD 5250, and USD 8750 respectively.
10. Is the market size provided in terms of value or volume?
The market size is provided in terms of value, measured in Million.
11. Are there any specific market keywords associated with the report?
Yes, the market keyword associated with the report is "Emission Monitoring Systems Industry," which aids in identifying and referencing the specific market segment covered.
12. How do I determine which pricing option suits my needs best?
The pricing options vary based on user requirements and access needs. Individual users may opt for single-user licenses, while businesses requiring broader access may choose multi-user or enterprise licenses for cost-effective access to the report.
13. Are there any additional resources or data provided in the Emission Monitoring Systems Industry report?
While the report offers comprehensive insights, it's advisable to review the specific contents or supplementary materials provided to ascertain if additional resources or data are available.
14. How can I stay updated on further developments or reports in the Emission Monitoring Systems Industry?
To stay informed about further developments, trends, and reports in the Emission Monitoring Systems Industry, consider subscribing to industry newsletters, following relevant companies and organizations, or regularly checking reputable industry news sources and publications.
Methodology
Step 1 - Identification of Relevant Samples Size from Population Database


Step 2 - Approaches for Defining Global Market Size (Value, Volume* & Price*)

Note*: In applicable scenarios
Step 3 - Data Sources
Primary Research
- Web Analytics
- Survey Reports
- Research Institute
- Latest Research Reports
- Opinion Leaders
Secondary Research
- Annual Reports
- White Paper
- Latest Press Release
- Industry Association
- Paid Database
- Investor Presentations

Step 4 - Data Triangulation
Involves using different sources of information in order to increase the validity of a study
These sources are likely to be stakeholders in a program - participants, other researchers, program staff, other community members, and so on.
Then we put all data in single framework & apply various statistical tools to find out the dynamic on the market.
During the analysis stage, feedback from the stakeholder groups would be compared to determine areas of agreement as well as areas of divergence
