

Key Insights
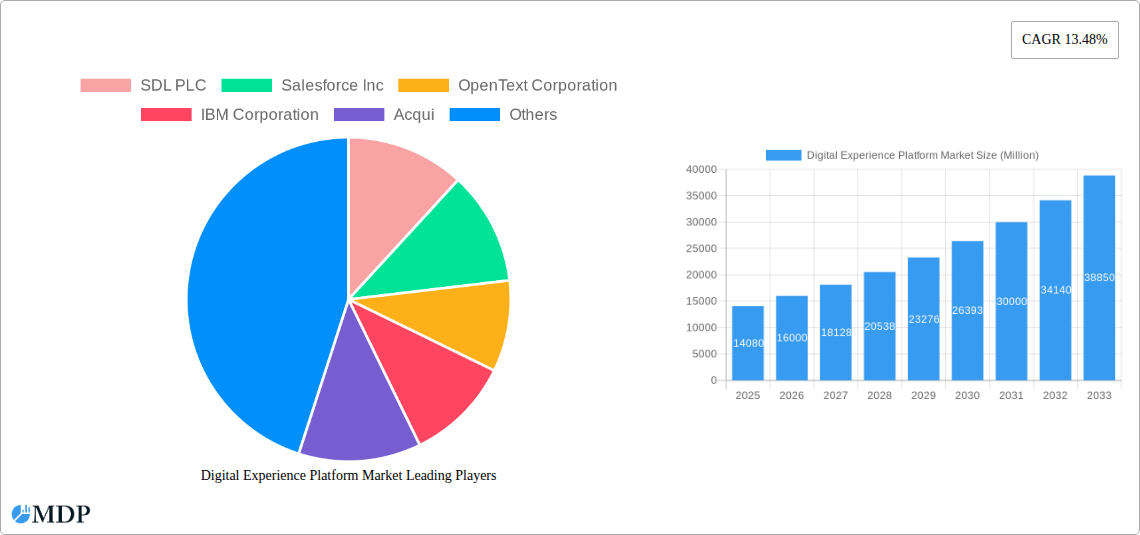
The Digital Experience Platform (DXP) market is experiencing robust growth, projected to reach \$14.08 billion in 2025 and maintain a Compound Annual Growth Rate (CAGR) of 13.48% from 2025 to 2033. This expansion is driven by several key factors. Increasing digital transformation initiatives across diverse sectors, including retail, IT & telecom, BFSI, and healthcare, are fueling demand for integrated platforms that streamline customer interactions and enhance brand experiences. The shift towards cloud-based deployments offers scalability, flexibility, and cost-effectiveness, further accelerating market adoption. Furthermore, the rising adoption of personalized experiences and omnichannel strategies necessitates sophisticated DXPs capable of managing content, data, and interactions across multiple touchpoints. Competition is fierce, with established players like Salesforce, Adobe, IBM, and Oracle competing alongside specialized providers like SDL and Sitecore. This competitive landscape is likely to drive innovation and further refine DXP capabilities, benefiting end-users.
The market segmentation reveals significant opportunities across various components (platform and services), deployment types (on-premise and cloud), and end-user industries. While the cloud segment is expected to dominate due to its inherent advantages, the on-premise segment will retain a presence catering to specific security and compliance needs. North America currently holds a significant market share, driven by early adoption and a robust technology infrastructure. However, rapid growth is anticipated in the Asia-Pacific region, fueled by increasing digitalization and a large consumer base. Market restraints include the complexities of integrating legacy systems and the need for specialized skills to manage and maintain DXPs. Nevertheless, the overall outlook for the DXP market remains highly positive, promising substantial growth in the coming years.
Digital Experience Platform Market Report: 2019-2033
This comprehensive report provides a detailed analysis of the Digital Experience Platform (DXP) market, offering actionable insights for stakeholders across the industry. With a study period spanning 2019-2033, a base year of 2025, and a forecast period of 2025-2033, this report delivers a thorough understanding of current market dynamics and future growth trajectories. The market is segmented by component (Platform, Services), deployment type (On-Premise, Cloud), and end-user (Retail, IT and Telecom, BFSI, Healthcare, Other End Users). Key players analyzed include SDL PLC, Salesforce Inc, OpenText Corporation, IBM Corporation, Acqui, Microsoft Corporation, Adobe Inc, Oracle Corporation, Sitecore, and SAP SE. The report's projected market value is xx Million.
Digital Experience Platform Market Market Dynamics & Concentration
The Digital Experience Platform market is characterized by a dynamic interplay of factors influencing its concentration, innovation, and overall growth. Market concentration is currently [Insert Market Concentration Metric, e.g., moderately high, with the top 5 players holding xx% market share], driven by the presence of established technology giants alongside emerging specialized vendors. Innovation is a key driver, with continuous advancements in areas like AI-powered personalization, headless CMS, and omnichannel integration. Regulatory frameworks, particularly concerning data privacy (e.g., GDPR, CCPA), significantly impact vendor strategies and customer adoption. Product substitutes, such as standalone CRM or CMS systems, present competitive challenges. However, the increasing need for integrated and seamless customer experiences is driving DXP adoption. End-user trends indicate a growing preference for cloud-based DXPs due to scalability and cost-effectiveness. M&A activity has been [Insert level of M&A activity, e.g., moderate] in recent years, with [Insert Number] significant deals reported between [Insert Year] and [Insert Year]. This activity reflects the strategic importance of DXPs and the consolidation within the market.
- Market Share: Top 5 players hold approximately xx% of the market share (2024).
- M&A Activity: An estimated xx M&A deals occurred between 2019 and 2024.
- Innovation Drivers: AI-powered personalization, headless CMS, omnichannel integration.
- Regulatory Impacts: GDPR, CCPA compliance are key considerations.
Digital Experience Platform Market Industry Trends & Analysis
The Digital Experience Platform market is experiencing robust growth, driven by several key factors. The increasing demand for personalized customer experiences across all touchpoints is a major catalyst. Businesses are recognizing the need to deliver seamless, integrated experiences across web, mobile, and other channels to enhance customer engagement and loyalty. Technological advancements, particularly in areas like AI, machine learning, and cloud computing, are enabling the development of more sophisticated and powerful DXPs. The shift towards cloud-based deployments is further accelerating market growth, offering scalability, flexibility, and cost-effectiveness. Consumer preferences are increasingly shifting towards personalized, intuitive, and secure digital experiences, further fueling the adoption of DXPs. Competitive dynamics are intense, with both established players and new entrants vying for market share. This competition fosters innovation and drives down prices, benefiting end-users. The market is expected to witness a Compound Annual Growth Rate (CAGR) of xx% during the forecast period (2025-2033), with market penetration projected to reach xx% by 2033.

Leading Markets & Segments in Digital Experience Platform Market
The [Insert Dominant Region, e.g., North American] market currently dominates the global DXP landscape, driven by high technological adoption rates, strong digital infrastructure, and a significant presence of major DXP vendors. Within this region, [Insert Dominant Country, e.g., the United States] holds the largest market share.
Key Drivers:
- Economic Policies: Government investments in digital infrastructure and initiatives supporting digital transformation.
- Technological Advancement: High penetration of smartphones, broadband internet, and cloud computing.
- High Digital Literacy: A high percentage of the population is digitally literate and comfortable using digital platforms.
Segment Dominance:
- Component: The Platform segment is expected to hold a larger market share due to its core role in enabling DXP functionalities.
- Deployment Type: The Cloud segment is experiencing rapid growth, surpassing On-Premise deployment due to its scalability and cost-effectiveness.
- End-Users: The BFSI and Retail sectors are key adopters, followed by IT and Telecom and Healthcare sectors. These sectors have a higher need for delivering exceptional customer experiences and managing vast amounts of customer data.
Detailed Dominance Analysis: [Insert detailed paragraph discussing specific market factors contributing to regional and segment dominance, including competitive landscape, regulatory environment, and consumer behavior].
Digital Experience Platform Market Product Developments
Recent product innovations in the DXP market have focused on enhancing personalization, improving content management capabilities, and integrating various channels seamlessly. Headless architectures, AI-driven personalization engines, and improved analytics dashboards are becoming standard features. These developments provide businesses with enhanced capabilities to create engaging customer journeys and derive valuable insights from data. The key competitive advantage lies in offering robust, scalable, and secure platforms that meet the evolving needs of businesses in diverse sectors. The integration of AI and machine learning is also transforming the DXP landscape, enabling advanced personalization and automation capabilities.
Key Drivers of Digital Experience Platform Market Growth
Several factors are driving the growth of the Digital Experience Platform market. Technological advancements, particularly in AI and cloud computing, are enabling the creation of more sophisticated and user-friendly DXPs. The increasing demand for personalized customer experiences is pushing businesses to adopt these platforms to improve engagement and loyalty. Furthermore, government initiatives promoting digital transformation in various sectors are creating favorable conditions for market growth. The rising adoption of mobile and other digital channels is also increasing the need for integrated platforms to manage the customer experience effectively. The rising need for secure and scalable platforms to manage data effectively is also pushing market growth.
Challenges in the Digital Experience Platform Market Market
The Digital Experience Platform market faces several challenges. The complexity of integrating various systems and data sources can be a significant hurdle for businesses. The high initial investment costs and ongoing maintenance expenses can deter smaller businesses. Competition is intense, with many vendors offering similar solutions, creating pressure on pricing. Ensuring data security and compliance with data privacy regulations poses a significant challenge for DXP providers and users alike. This complexity can lead to increased implementation time, potential integration issues, and heightened security concerns.
Emerging Opportunities in Digital Experience Platform Market
Significant opportunities exist for growth in the Digital Experience Platform market. The increasing adoption of Internet of Things (IoT) devices will create a demand for platforms that can seamlessly integrate and manage data from various connected devices. The development of advanced analytics capabilities will allow businesses to derive valuable insights from customer data, leading to better personalization and improved business outcomes. Strategic partnerships between DXP vendors and other technology providers will enable the creation of more comprehensive and integrated solutions. Expansion into emerging markets with growing digital adoption rates presents a significant opportunity for market expansion.
Leading Players in the Digital Experience Platform Market Sector
- SDL PLC
- Salesforce Inc
- OpenText Corporation
- IBM Corporation
- Acqui
- Microsoft Corporation
- Adobe Inc
- Oracle Corporation
- Sitecore
- SAP SE
Key Milestones in Digital Experience Platform Market Industry
- September 2022: KeyBank partners with Oracle to modernize its consumer lending process using Oracle Banking Originations, improving efficiency and customer service.
- December 2022: The Bank of Thailand (BOT) selects Oracle Fusion Cloud HCM to enhance employee experience and streamline HR processes.
- December 2022: Oracle launches a new cloud region in Chicago, expanding its global infrastructure and providing improved services to Midwest customers.
Strategic Outlook for Digital Experience Platform Market Market
The Digital Experience Platform market is poised for continued growth, driven by technological innovations, increasing demand for personalized experiences, and expanding adoption across various industries. Strategic opportunities include focusing on AI-driven personalization, expanding cloud-based solutions, and forging strategic partnerships to offer comprehensive solutions. Businesses that can effectively address the challenges related to data security, integration complexity, and cost will be well-positioned to capture significant market share. The future success of DXP vendors will depend on their ability to innovate and adapt to the ever-evolving needs of businesses and customers.
Digital Experience Platform Market Segmentation
-
1. Component
- 1.1. Platform
- 1.2. Services
-
2. Deployment Type
- 2.1. On-Premise
- 2.2. Cloud
-
3. End Users
- 3.1. Retail
- 3.2. IT and Telecom
- 3.3. BFSI
- 3.4. Healthcare
- 3.5. Other End Users
Digital Experience Platform Market Segmentation By Geography
- 1. North America
- 2. Europe
- 3. Asia
- 4. Australia and New Zealand
- 5. Latin America
- 6. Middle East and Africa

Digital Experience Platform Market REPORT HIGHLIGHTS
| Aspects | Details |
|---|---|
| Study Period | 2019-2033 |
| Base Year | 2024 |
| Estimated Year | 2025 |
| Forecast Period | 2025-2033 |
| Historical Period | 2019-2024 |
| Growth Rate | CAGR of 13.48% from 2019-2033 |
| Segmentation |
|
Table of Contents
- 1. Introduction
- 1.1. Research Scope
- 1.2. Market Segmentation
- 1.3. Research Methodology
- 1.4. Definitions and Assumptions
- 2. Executive Summary
- 2.1. Introduction
- 3. Market Dynamics
- 3.1. Introduction
- 3.2. Market Drivers
- 3.2.1. Growing Deployment of Cloud-Based Solutions; Rising Demand for big Data Analytics
- 3.3. Market Restrains
- 3.3.1. Privacy and Data Security Issues
- 3.4. Market Trends
- 3.4.1. On Cloud Deployment to Drive the Market Growth
- 4. Market Factor Analysis
- 4.1. Porters Five Forces
- 4.2. Supply/Value Chain
- 4.3. PESTEL analysis
- 4.4. Market Entropy
- 4.5. Patent/Trademark Analysis
- 5. Global Digital Experience Platform Market Analysis, Insights and Forecast, 2019-2031
- 5.1. Market Analysis, Insights and Forecast - by Component
- 5.1.1. Platform
- 5.1.2. Services
- 5.2. Market Analysis, Insights and Forecast - by Deployment Type
- 5.2.1. On-Premise
- 5.2.2. Cloud
- 5.3. Market Analysis, Insights and Forecast - by End Users
- 5.3.1. Retail
- 5.3.2. IT and Telecom
- 5.3.3. BFSI
- 5.3.4. Healthcare
- 5.3.5. Other End Users
- 5.4. Market Analysis, Insights and Forecast - by Region
- 5.4.1. North America
- 5.4.2. Europe
- 5.4.3. Asia
- 5.4.4. Australia and New Zealand
- 5.4.5. Latin America
- 5.4.6. Middle East and Africa
- 5.1. Market Analysis, Insights and Forecast - by Component
- 6. North America Digital Experience Platform Market Analysis, Insights and Forecast, 2019-2031
- 6.1. Market Analysis, Insights and Forecast - by Component
- 6.1.1. Platform
- 6.1.2. Services
- 6.2. Market Analysis, Insights and Forecast - by Deployment Type
- 6.2.1. On-Premise
- 6.2.2. Cloud
- 6.3. Market Analysis, Insights and Forecast - by End Users
- 6.3.1. Retail
- 6.3.2. IT and Telecom
- 6.3.3. BFSI
- 6.3.4. Healthcare
- 6.3.5. Other End Users
- 6.1. Market Analysis, Insights and Forecast - by Component
- 7. Europe Digital Experience Platform Market Analysis, Insights and Forecast, 2019-2031
- 7.1. Market Analysis, Insights and Forecast - by Component
- 7.1.1. Platform
- 7.1.2. Services
- 7.2. Market Analysis, Insights and Forecast - by Deployment Type
- 7.2.1. On-Premise
- 7.2.2. Cloud
- 7.3. Market Analysis, Insights and Forecast - by End Users
- 7.3.1. Retail
- 7.3.2. IT and Telecom
- 7.3.3. BFSI
- 7.3.4. Healthcare
- 7.3.5. Other End Users
- 7.1. Market Analysis, Insights and Forecast - by Component
- 8. Asia Digital Experience Platform Market Analysis, Insights and Forecast, 2019-2031
- 8.1. Market Analysis, Insights and Forecast - by Component
- 8.1.1. Platform
- 8.1.2. Services
- 8.2. Market Analysis, Insights and Forecast - by Deployment Type
- 8.2.1. On-Premise
- 8.2.2. Cloud
- 8.3. Market Analysis, Insights and Forecast - by End Users
- 8.3.1. Retail
- 8.3.2. IT and Telecom
- 8.3.3. BFSI
- 8.3.4. Healthcare
- 8.3.5. Other End Users
- 8.1. Market Analysis, Insights and Forecast - by Component
- 9. Australia and New Zealand Digital Experience Platform Market Analysis, Insights and Forecast, 2019-2031
- 9.1. Market Analysis, Insights and Forecast - by Component
- 9.1.1. Platform
- 9.1.2. Services
- 9.2. Market Analysis, Insights and Forecast - by Deployment Type
- 9.2.1. On-Premise
- 9.2.2. Cloud
- 9.3. Market Analysis, Insights and Forecast - by End Users
- 9.3.1. Retail
- 9.3.2. IT and Telecom
- 9.3.3. BFSI
- 9.3.4. Healthcare
- 9.3.5. Other End Users
- 9.1. Market Analysis, Insights and Forecast - by Component
- 10. Latin America Digital Experience Platform Market Analysis, Insights and Forecast, 2019-2031
- 10.1. Market Analysis, Insights and Forecast - by Component
- 10.1.1. Platform
- 10.1.2. Services
- 10.2. Market Analysis, Insights and Forecast - by Deployment Type
- 10.2.1. On-Premise
- 10.2.2. Cloud
- 10.3. Market Analysis, Insights and Forecast - by End Users
- 10.3.1. Retail
- 10.3.2. IT and Telecom
- 10.3.3. BFSI
- 10.3.4. Healthcare
- 10.3.5. Other End Users
- 10.1. Market Analysis, Insights and Forecast - by Component
- 11. Middle East and Africa Digital Experience Platform Market Analysis, Insights and Forecast, 2019-2031
- 11.1. Market Analysis, Insights and Forecast - by Component
- 11.1.1. Platform
- 11.1.2. Services
- 11.2. Market Analysis, Insights and Forecast - by Deployment Type
- 11.2.1. On-Premise
- 11.2.2. Cloud
- 11.3. Market Analysis, Insights and Forecast - by End Users
- 11.3.1. Retail
- 11.3.2. IT and Telecom
- 11.3.3. BFSI
- 11.3.4. Healthcare
- 11.3.5. Other End Users
- 11.1. Market Analysis, Insights and Forecast - by Component
- 12. North America Digital Experience Platform Market Analysis, Insights and Forecast, 2019-2031
- 12.1. Market Analysis, Insights and Forecast - By Country/Sub-region
- 12.1.1 United States
- 12.1.2 Canada
- 12.1.3 Mexico
- 13. Europe Digital Experience Platform Market Analysis, Insights and Forecast, 2019-2031
- 13.1. Market Analysis, Insights and Forecast - By Country/Sub-region
- 13.1.1 Germany
- 13.1.2 United Kingdom
- 13.1.3 France
- 13.1.4 Spain
- 13.1.5 Italy
- 13.1.6 Spain
- 13.1.7 Belgium
- 13.1.8 Netherland
- 13.1.9 Nordics
- 13.1.10 Rest of Europe
- 14. Asia Pacific Digital Experience Platform Market Analysis, Insights and Forecast, 2019-2031
- 14.1. Market Analysis, Insights and Forecast - By Country/Sub-region
- 14.1.1 China
- 14.1.2 Japan
- 14.1.3 India
- 14.1.4 South Korea
- 14.1.5 Southeast Asia
- 14.1.6 Australia
- 14.1.7 Indonesia
- 14.1.8 Phillipes
- 14.1.9 Singapore
- 14.1.10 Thailandc
- 14.1.11 Rest of Asia Pacific
- 15. South America Digital Experience Platform Market Analysis, Insights and Forecast, 2019-2031
- 15.1. Market Analysis, Insights and Forecast - By Country/Sub-region
- 15.1.1 Brazil
- 15.1.2 Argentina
- 15.1.3 Peru
- 15.1.4 Chile
- 15.1.5 Colombia
- 15.1.6 Ecuador
- 15.1.7 Venezuela
- 15.1.8 Rest of South America
- 16. North America Digital Experience Platform Market Analysis, Insights and Forecast, 2019-2031
- 16.1. Market Analysis, Insights and Forecast - By Country/Sub-region
- 16.1.1 United States
- 16.1.2 Canada
- 16.1.3 Mexico
- 17. MEA Digital Experience Platform Market Analysis, Insights and Forecast, 2019-2031
- 17.1. Market Analysis, Insights and Forecast - By Country/Sub-region
- 17.1.1 United Arab Emirates
- 17.1.2 Saudi Arabia
- 17.1.3 South Africa
- 17.1.4 Rest of Middle East and Africa
- 18. Competitive Analysis
- 18.1. Global Market Share Analysis 2024
- 18.2. Company Profiles
- 18.2.1 SDL PLC
- 18.2.1.1. Overview
- 18.2.1.2. Products
- 18.2.1.3. SWOT Analysis
- 18.2.1.4. Recent Developments
- 18.2.1.5. Financials (Based on Availability)
- 18.2.2 Salesforce Inc
- 18.2.2.1. Overview
- 18.2.2.2. Products
- 18.2.2.3. SWOT Analysis
- 18.2.2.4. Recent Developments
- 18.2.2.5. Financials (Based on Availability)
- 18.2.3 OpenText Corporation
- 18.2.3.1. Overview
- 18.2.3.2. Products
- 18.2.3.3. SWOT Analysis
- 18.2.3.4. Recent Developments
- 18.2.3.5. Financials (Based on Availability)
- 18.2.4 IBM Corporation
- 18.2.4.1. Overview
- 18.2.4.2. Products
- 18.2.4.3. SWOT Analysis
- 18.2.4.4. Recent Developments
- 18.2.4.5. Financials (Based on Availability)
- 18.2.5 Acqui
- 18.2.5.1. Overview
- 18.2.5.2. Products
- 18.2.5.3. SWOT Analysis
- 18.2.5.4. Recent Developments
- 18.2.5.5. Financials (Based on Availability)
- 18.2.6 Microsoft Corporation
- 18.2.6.1. Overview
- 18.2.6.2. Products
- 18.2.6.3. SWOT Analysis
- 18.2.6.4. Recent Developments
- 18.2.6.5. Financials (Based on Availability)
- 18.2.7 Adobe Inc
- 18.2.7.1. Overview
- 18.2.7.2. Products
- 18.2.7.3. SWOT Analysis
- 18.2.7.4. Recent Developments
- 18.2.7.5. Financials (Based on Availability)
- 18.2.8 Oracle Corporation
- 18.2.8.1. Overview
- 18.2.8.2. Products
- 18.2.8.3. SWOT Analysis
- 18.2.8.4. Recent Developments
- 18.2.8.5. Financials (Based on Availability)
- 18.2.9 Sitecore
- 18.2.9.1. Overview
- 18.2.9.2. Products
- 18.2.9.3. SWOT Analysis
- 18.2.9.4. Recent Developments
- 18.2.9.5. Financials (Based on Availability)
- 18.2.10 SAP SE
- 18.2.10.1. Overview
- 18.2.10.2. Products
- 18.2.10.3. SWOT Analysis
- 18.2.10.4. Recent Developments
- 18.2.10.5. Financials (Based on Availability)
- 18.2.1 SDL PLC
List of Figures
- Figure 1: Global Digital Experience Platform Market Revenue Breakdown (Million, %) by Region 2024 & 2032
- Figure 2: Global Digital Experience Platform Market Volume Breakdown (K Unit, %) by Region 2024 & 2032
- Figure 3: North America Digital Experience Platform Market Revenue (Million), by Country 2024 & 2032
- Figure 4: North America Digital Experience Platform Market Volume (K Unit), by Country 2024 & 2032
- Figure 5: North America Digital Experience Platform Market Revenue Share (%), by Country 2024 & 2032
- Figure 6: North America Digital Experience Platform Market Volume Share (%), by Country 2024 & 2032
- Figure 7: Europe Digital Experience Platform Market Revenue (Million), by Country 2024 & 2032
- Figure 8: Europe Digital Experience Platform Market Volume (K Unit), by Country 2024 & 2032
- Figure 9: Europe Digital Experience Platform Market Revenue Share (%), by Country 2024 & 2032
- Figure 10: Europe Digital Experience Platform Market Volume Share (%), by Country 2024 & 2032
- Figure 11: Asia Pacific Digital Experience Platform Market Revenue (Million), by Country 2024 & 2032
- Figure 12: Asia Pacific Digital Experience Platform Market Volume (K Unit), by Country 2024 & 2032
- Figure 13: Asia Pacific Digital Experience Platform Market Revenue Share (%), by Country 2024 & 2032
- Figure 14: Asia Pacific Digital Experience Platform Market Volume Share (%), by Country 2024 & 2032
- Figure 15: South America Digital Experience Platform Market Revenue (Million), by Country 2024 & 2032
- Figure 16: South America Digital Experience Platform Market Volume (K Unit), by Country 2024 & 2032
- Figure 17: South America Digital Experience Platform Market Revenue Share (%), by Country 2024 & 2032
- Figure 18: South America Digital Experience Platform Market Volume Share (%), by Country 2024 & 2032
- Figure 19: North America Digital Experience Platform Market Revenue (Million), by Country 2024 & 2032
- Figure 20: North America Digital Experience Platform Market Volume (K Unit), by Country 2024 & 2032
- Figure 21: North America Digital Experience Platform Market Revenue Share (%), by Country 2024 & 2032
- Figure 22: North America Digital Experience Platform Market Volume Share (%), by Country 2024 & 2032
- Figure 23: MEA Digital Experience Platform Market Revenue (Million), by Country 2024 & 2032
- Figure 24: MEA Digital Experience Platform Market Volume (K Unit), by Country 2024 & 2032
- Figure 25: MEA Digital Experience Platform Market Revenue Share (%), by Country 2024 & 2032
- Figure 26: MEA Digital Experience Platform Market Volume Share (%), by Country 2024 & 2032
- Figure 27: North America Digital Experience Platform Market Revenue (Million), by Component 2024 & 2032
- Figure 28: North America Digital Experience Platform Market Volume (K Unit), by Component 2024 & 2032
- Figure 29: North America Digital Experience Platform Market Revenue Share (%), by Component 2024 & 2032
- Figure 30: North America Digital Experience Platform Market Volume Share (%), by Component 2024 & 2032
- Figure 31: North America Digital Experience Platform Market Revenue (Million), by Deployment Type 2024 & 2032
- Figure 32: North America Digital Experience Platform Market Volume (K Unit), by Deployment Type 2024 & 2032
- Figure 33: North America Digital Experience Platform Market Revenue Share (%), by Deployment Type 2024 & 2032
- Figure 34: North America Digital Experience Platform Market Volume Share (%), by Deployment Type 2024 & 2032
- Figure 35: North America Digital Experience Platform Market Revenue (Million), by End Users 2024 & 2032
- Figure 36: North America Digital Experience Platform Market Volume (K Unit), by End Users 2024 & 2032
- Figure 37: North America Digital Experience Platform Market Revenue Share (%), by End Users 2024 & 2032
- Figure 38: North America Digital Experience Platform Market Volume Share (%), by End Users 2024 & 2032
- Figure 39: North America Digital Experience Platform Market Revenue (Million), by Country 2024 & 2032
- Figure 40: North America Digital Experience Platform Market Volume (K Unit), by Country 2024 & 2032
- Figure 41: North America Digital Experience Platform Market Revenue Share (%), by Country 2024 & 2032
- Figure 42: North America Digital Experience Platform Market Volume Share (%), by Country 2024 & 2032
- Figure 43: Europe Digital Experience Platform Market Revenue (Million), by Component 2024 & 2032
- Figure 44: Europe Digital Experience Platform Market Volume (K Unit), by Component 2024 & 2032
- Figure 45: Europe Digital Experience Platform Market Revenue Share (%), by Component 2024 & 2032
- Figure 46: Europe Digital Experience Platform Market Volume Share (%), by Component 2024 & 2032
- Figure 47: Europe Digital Experience Platform Market Revenue (Million), by Deployment Type 2024 & 2032
- Figure 48: Europe Digital Experience Platform Market Volume (K Unit), by Deployment Type 2024 & 2032
- Figure 49: Europe Digital Experience Platform Market Revenue Share (%), by Deployment Type 2024 & 2032
- Figure 50: Europe Digital Experience Platform Market Volume Share (%), by Deployment Type 2024 & 2032
- Figure 51: Europe Digital Experience Platform Market Revenue (Million), by End Users 2024 & 2032
- Figure 52: Europe Digital Experience Platform Market Volume (K Unit), by End Users 2024 & 2032
- Figure 53: Europe Digital Experience Platform Market Revenue Share (%), by End Users 2024 & 2032
- Figure 54: Europe Digital Experience Platform Market Volume Share (%), by End Users 2024 & 2032
- Figure 55: Europe Digital Experience Platform Market Revenue (Million), by Country 2024 & 2032
- Figure 56: Europe Digital Experience Platform Market Volume (K Unit), by Country 2024 & 2032
- Figure 57: Europe Digital Experience Platform Market Revenue Share (%), by Country 2024 & 2032
- Figure 58: Europe Digital Experience Platform Market Volume Share (%), by Country 2024 & 2032
- Figure 59: Asia Digital Experience Platform Market Revenue (Million), by Component 2024 & 2032
- Figure 60: Asia Digital Experience Platform Market Volume (K Unit), by Component 2024 & 2032
- Figure 61: Asia Digital Experience Platform Market Revenue Share (%), by Component 2024 & 2032
- Figure 62: Asia Digital Experience Platform Market Volume Share (%), by Component 2024 & 2032
- Figure 63: Asia Digital Experience Platform Market Revenue (Million), by Deployment Type 2024 & 2032
- Figure 64: Asia Digital Experience Platform Market Volume (K Unit), by Deployment Type 2024 & 2032
- Figure 65: Asia Digital Experience Platform Market Revenue Share (%), by Deployment Type 2024 & 2032
- Figure 66: Asia Digital Experience Platform Market Volume Share (%), by Deployment Type 2024 & 2032
- Figure 67: Asia Digital Experience Platform Market Revenue (Million), by End Users 2024 & 2032
- Figure 68: Asia Digital Experience Platform Market Volume (K Unit), by End Users 2024 & 2032
- Figure 69: Asia Digital Experience Platform Market Revenue Share (%), by End Users 2024 & 2032
- Figure 70: Asia Digital Experience Platform Market Volume Share (%), by End Users 2024 & 2032
- Figure 71: Asia Digital Experience Platform Market Revenue (Million), by Country 2024 & 2032
- Figure 72: Asia Digital Experience Platform Market Volume (K Unit), by Country 2024 & 2032
- Figure 73: Asia Digital Experience Platform Market Revenue Share (%), by Country 2024 & 2032
- Figure 74: Asia Digital Experience Platform Market Volume Share (%), by Country 2024 & 2032
- Figure 75: Australia and New Zealand Digital Experience Platform Market Revenue (Million), by Component 2024 & 2032
- Figure 76: Australia and New Zealand Digital Experience Platform Market Volume (K Unit), by Component 2024 & 2032
- Figure 77: Australia and New Zealand Digital Experience Platform Market Revenue Share (%), by Component 2024 & 2032
- Figure 78: Australia and New Zealand Digital Experience Platform Market Volume Share (%), by Component 2024 & 2032
- Figure 79: Australia and New Zealand Digital Experience Platform Market Revenue (Million), by Deployment Type 2024 & 2032
- Figure 80: Australia and New Zealand Digital Experience Platform Market Volume (K Unit), by Deployment Type 2024 & 2032
- Figure 81: Australia and New Zealand Digital Experience Platform Market Revenue Share (%), by Deployment Type 2024 & 2032
- Figure 82: Australia and New Zealand Digital Experience Platform Market Volume Share (%), by Deployment Type 2024 & 2032
- Figure 83: Australia and New Zealand Digital Experience Platform Market Revenue (Million), by End Users 2024 & 2032
- Figure 84: Australia and New Zealand Digital Experience Platform Market Volume (K Unit), by End Users 2024 & 2032
- Figure 85: Australia and New Zealand Digital Experience Platform Market Revenue Share (%), by End Users 2024 & 2032
- Figure 86: Australia and New Zealand Digital Experience Platform Market Volume Share (%), by End Users 2024 & 2032
- Figure 87: Australia and New Zealand Digital Experience Platform Market Revenue (Million), by Country 2024 & 2032
- Figure 88: Australia and New Zealand Digital Experience Platform Market Volume (K Unit), by Country 2024 & 2032
- Figure 89: Australia and New Zealand Digital Experience Platform Market Revenue Share (%), by Country 2024 & 2032
- Figure 90: Australia and New Zealand Digital Experience Platform Market Volume Share (%), by Country 2024 & 2032
- Figure 91: Latin America Digital Experience Platform Market Revenue (Million), by Component 2024 & 2032
- Figure 92: Latin America Digital Experience Platform Market Volume (K Unit), by Component 2024 & 2032
- Figure 93: Latin America Digital Experience Platform Market Revenue Share (%), by Component 2024 & 2032
- Figure 94: Latin America Digital Experience Platform Market Volume Share (%), by Component 2024 & 2032
- Figure 95: Latin America Digital Experience Platform Market Revenue (Million), by Deployment Type 2024 & 2032
- Figure 96: Latin America Digital Experience Platform Market Volume (K Unit), by Deployment Type 2024 & 2032
- Figure 97: Latin America Digital Experience Platform Market Revenue Share (%), by Deployment Type 2024 & 2032
- Figure 98: Latin America Digital Experience Platform Market Volume Share (%), by Deployment Type 2024 & 2032
- Figure 99: Latin America Digital Experience Platform Market Revenue (Million), by End Users 2024 & 2032
- Figure 100: Latin America Digital Experience Platform Market Volume (K Unit), by End Users 2024 & 2032
- Figure 101: Latin America Digital Experience Platform Market Revenue Share (%), by End Users 2024 & 2032
- Figure 102: Latin America Digital Experience Platform Market Volume Share (%), by End Users 2024 & 2032
- Figure 103: Latin America Digital Experience Platform Market Revenue (Million), by Country 2024 & 2032
- Figure 104: Latin America Digital Experience Platform Market Volume (K Unit), by Country 2024 & 2032
- Figure 105: Latin America Digital Experience Platform Market Revenue Share (%), by Country 2024 & 2032
- Figure 106: Latin America Digital Experience Platform Market Volume Share (%), by Country 2024 & 2032
- Figure 107: Middle East and Africa Digital Experience Platform Market Revenue (Million), by Component 2024 & 2032
- Figure 108: Middle East and Africa Digital Experience Platform Market Volume (K Unit), by Component 2024 & 2032
- Figure 109: Middle East and Africa Digital Experience Platform Market Revenue Share (%), by Component 2024 & 2032
- Figure 110: Middle East and Africa Digital Experience Platform Market Volume Share (%), by Component 2024 & 2032
- Figure 111: Middle East and Africa Digital Experience Platform Market Revenue (Million), by Deployment Type 2024 & 2032
- Figure 112: Middle East and Africa Digital Experience Platform Market Volume (K Unit), by Deployment Type 2024 & 2032
- Figure 113: Middle East and Africa Digital Experience Platform Market Revenue Share (%), by Deployment Type 2024 & 2032
- Figure 114: Middle East and Africa Digital Experience Platform Market Volume Share (%), by Deployment Type 2024 & 2032
- Figure 115: Middle East and Africa Digital Experience Platform Market Revenue (Million), by End Users 2024 & 2032
- Figure 116: Middle East and Africa Digital Experience Platform Market Volume (K Unit), by End Users 2024 & 2032
- Figure 117: Middle East and Africa Digital Experience Platform Market Revenue Share (%), by End Users 2024 & 2032
- Figure 118: Middle East and Africa Digital Experience Platform Market Volume Share (%), by End Users 2024 & 2032
- Figure 119: Middle East and Africa Digital Experience Platform Market Revenue (Million), by Country 2024 & 2032
- Figure 120: Middle East and Africa Digital Experience Platform Market Volume (K Unit), by Country 2024 & 2032
- Figure 121: Middle East and Africa Digital Experience Platform Market Revenue Share (%), by Country 2024 & 2032
- Figure 122: Middle East and Africa Digital Experience Platform Market Volume Share (%), by Country 2024 & 2032
List of Tables
- Table 1: Global Digital Experience Platform Market Revenue Million Forecast, by Region 2019 & 2032
- Table 2: Global Digital Experience Platform Market Volume K Unit Forecast, by Region 2019 & 2032
- Table 3: Global Digital Experience Platform Market Revenue Million Forecast, by Component 2019 & 2032
- Table 4: Global Digital Experience Platform Market Volume K Unit Forecast, by Component 2019 & 2032
- Table 5: Global Digital Experience Platform Market Revenue Million Forecast, by Deployment Type 2019 & 2032
- Table 6: Global Digital Experience Platform Market Volume K Unit Forecast, by Deployment Type 2019 & 2032
- Table 7: Global Digital Experience Platform Market Revenue Million Forecast, by End Users 2019 & 2032
- Table 8: Global Digital Experience Platform Market Volume K Unit Forecast, by End Users 2019 & 2032
- Table 9: Global Digital Experience Platform Market Revenue Million Forecast, by Region 2019 & 2032
- Table 10: Global Digital Experience Platform Market Volume K Unit Forecast, by Region 2019 & 2032
- Table 11: Global Digital Experience Platform Market Revenue Million Forecast, by Country 2019 & 2032
- Table 12: Global Digital Experience Platform Market Volume K Unit Forecast, by Country 2019 & 2032
- Table 13: United States Digital Experience Platform Market Revenue (Million) Forecast, by Application 2019 & 2032
- Table 14: United States Digital Experience Platform Market Volume (K Unit) Forecast, by Application 2019 & 2032
- Table 15: Canada Digital Experience Platform Market Revenue (Million) Forecast, by Application 2019 & 2032
- Table 16: Canada Digital Experience Platform Market Volume (K Unit) Forecast, by Application 2019 & 2032
- Table 17: Mexico Digital Experience Platform Market Revenue (Million) Forecast, by Application 2019 & 2032
- Table 18: Mexico Digital Experience Platform Market Volume (K Unit) Forecast, by Application 2019 & 2032
- Table 19: Global Digital Experience Platform Market Revenue Million Forecast, by Country 2019 & 2032
- Table 20: Global Digital Experience Platform Market Volume K Unit Forecast, by Country 2019 & 2032
- Table 21: Germany Digital Experience Platform Market Revenue (Million) Forecast, by Application 2019 & 2032
- Table 22: Germany Digital Experience Platform Market Volume (K Unit) Forecast, by Application 2019 & 2032
- Table 23: United Kingdom Digital Experience Platform Market Revenue (Million) Forecast, by Application 2019 & 2032
- Table 24: United Kingdom Digital Experience Platform Market Volume (K Unit) Forecast, by Application 2019 & 2032
- Table 25: France Digital Experience Platform Market Revenue (Million) Forecast, by Application 2019 & 2032
- Table 26: France Digital Experience Platform Market Volume (K Unit) Forecast, by Application 2019 & 2032
- Table 27: Spain Digital Experience Platform Market Revenue (Million) Forecast, by Application 2019 & 2032
- Table 28: Spain Digital Experience Platform Market Volume (K Unit) Forecast, by Application 2019 & 2032
- Table 29: Italy Digital Experience Platform Market Revenue (Million) Forecast, by Application 2019 & 2032
- Table 30: Italy Digital Experience Platform Market Volume (K Unit) Forecast, by Application 2019 & 2032
- Table 31: Spain Digital Experience Platform Market Revenue (Million) Forecast, by Application 2019 & 2032
- Table 32: Spain Digital Experience Platform Market Volume (K Unit) Forecast, by Application 2019 & 2032
- Table 33: Belgium Digital Experience Platform Market Revenue (Million) Forecast, by Application 2019 & 2032
- Table 34: Belgium Digital Experience Platform Market Volume (K Unit) Forecast, by Application 2019 & 2032
- Table 35: Netherland Digital Experience Platform Market Revenue (Million) Forecast, by Application 2019 & 2032
- Table 36: Netherland Digital Experience Platform Market Volume (K Unit) Forecast, by Application 2019 & 2032
- Table 37: Nordics Digital Experience Platform Market Revenue (Million) Forecast, by Application 2019 & 2032
- Table 38: Nordics Digital Experience Platform Market Volume (K Unit) Forecast, by Application 2019 & 2032
- Table 39: Rest of Europe Digital Experience Platform Market Revenue (Million) Forecast, by Application 2019 & 2032
- Table 40: Rest of Europe Digital Experience Platform Market Volume (K Unit) Forecast, by Application 2019 & 2032
- Table 41: Global Digital Experience Platform Market Revenue Million Forecast, by Country 2019 & 2032
- Table 42: Global Digital Experience Platform Market Volume K Unit Forecast, by Country 2019 & 2032
- Table 43: China Digital Experience Platform Market Revenue (Million) Forecast, by Application 2019 & 2032
- Table 44: China Digital Experience Platform Market Volume (K Unit) Forecast, by Application 2019 & 2032
- Table 45: Japan Digital Experience Platform Market Revenue (Million) Forecast, by Application 2019 & 2032
- Table 46: Japan Digital Experience Platform Market Volume (K Unit) Forecast, by Application 2019 & 2032
- Table 47: India Digital Experience Platform Market Revenue (Million) Forecast, by Application 2019 & 2032
- Table 48: India Digital Experience Platform Market Volume (K Unit) Forecast, by Application 2019 & 2032
- Table 49: South Korea Digital Experience Platform Market Revenue (Million) Forecast, by Application 2019 & 2032
- Table 50: South Korea Digital Experience Platform Market Volume (K Unit) Forecast, by Application 2019 & 2032
- Table 51: Southeast Asia Digital Experience Platform Market Revenue (Million) Forecast, by Application 2019 & 2032
- Table 52: Southeast Asia Digital Experience Platform Market Volume (K Unit) Forecast, by Application 2019 & 2032
- Table 53: Australia Digital Experience Platform Market Revenue (Million) Forecast, by Application 2019 & 2032
- Table 54: Australia Digital Experience Platform Market Volume (K Unit) Forecast, by Application 2019 & 2032
- Table 55: Indonesia Digital Experience Platform Market Revenue (Million) Forecast, by Application 2019 & 2032
- Table 56: Indonesia Digital Experience Platform Market Volume (K Unit) Forecast, by Application 2019 & 2032
- Table 57: Phillipes Digital Experience Platform Market Revenue (Million) Forecast, by Application 2019 & 2032
- Table 58: Phillipes Digital Experience Platform Market Volume (K Unit) Forecast, by Application 2019 & 2032
- Table 59: Singapore Digital Experience Platform Market Revenue (Million) Forecast, by Application 2019 & 2032
- Table 60: Singapore Digital Experience Platform Market Volume (K Unit) Forecast, by Application 2019 & 2032
- Table 61: Thailandc Digital Experience Platform Market Revenue (Million) Forecast, by Application 2019 & 2032
- Table 62: Thailandc Digital Experience Platform Market Volume (K Unit) Forecast, by Application 2019 & 2032
- Table 63: Rest of Asia Pacific Digital Experience Platform Market Revenue (Million) Forecast, by Application 2019 & 2032
- Table 64: Rest of Asia Pacific Digital Experience Platform Market Volume (K Unit) Forecast, by Application 2019 & 2032
- Table 65: Global Digital Experience Platform Market Revenue Million Forecast, by Country 2019 & 2032
- Table 66: Global Digital Experience Platform Market Volume K Unit Forecast, by Country 2019 & 2032
- Table 67: Brazil Digital Experience Platform Market Revenue (Million) Forecast, by Application 2019 & 2032
- Table 68: Brazil Digital Experience Platform Market Volume (K Unit) Forecast, by Application 2019 & 2032
- Table 69: Argentina Digital Experience Platform Market Revenue (Million) Forecast, by Application 2019 & 2032
- Table 70: Argentina Digital Experience Platform Market Volume (K Unit) Forecast, by Application 2019 & 2032
- Table 71: Peru Digital Experience Platform Market Revenue (Million) Forecast, by Application 2019 & 2032
- Table 72: Peru Digital Experience Platform Market Volume (K Unit) Forecast, by Application 2019 & 2032
- Table 73: Chile Digital Experience Platform Market Revenue (Million) Forecast, by Application 2019 & 2032
- Table 74: Chile Digital Experience Platform Market Volume (K Unit) Forecast, by Application 2019 & 2032
- Table 75: Colombia Digital Experience Platform Market Revenue (Million) Forecast, by Application 2019 & 2032
- Table 76: Colombia Digital Experience Platform Market Volume (K Unit) Forecast, by Application 2019 & 2032
- Table 77: Ecuador Digital Experience Platform Market Revenue (Million) Forecast, by Application 2019 & 2032
- Table 78: Ecuador Digital Experience Platform Market Volume (K Unit) Forecast, by Application 2019 & 2032
- Table 79: Venezuela Digital Experience Platform Market Revenue (Million) Forecast, by Application 2019 & 2032
- Table 80: Venezuela Digital Experience Platform Market Volume (K Unit) Forecast, by Application 2019 & 2032
- Table 81: Rest of South America Digital Experience Platform Market Revenue (Million) Forecast, by Application 2019 & 2032
- Table 82: Rest of South America Digital Experience Platform Market Volume (K Unit) Forecast, by Application 2019 & 2032
- Table 83: Global Digital Experience Platform Market Revenue Million Forecast, by Country 2019 & 2032
- Table 84: Global Digital Experience Platform Market Volume K Unit Forecast, by Country 2019 & 2032
- Table 85: United States Digital Experience Platform Market Revenue (Million) Forecast, by Application 2019 & 2032
- Table 86: United States Digital Experience Platform Market Volume (K Unit) Forecast, by Application 2019 & 2032
- Table 87: Canada Digital Experience Platform Market Revenue (Million) Forecast, by Application 2019 & 2032
- Table 88: Canada Digital Experience Platform Market Volume (K Unit) Forecast, by Application 2019 & 2032
- Table 89: Mexico Digital Experience Platform Market Revenue (Million) Forecast, by Application 2019 & 2032
- Table 90: Mexico Digital Experience Platform Market Volume (K Unit) Forecast, by Application 2019 & 2032
- Table 91: Global Digital Experience Platform Market Revenue Million Forecast, by Country 2019 & 2032
- Table 92: Global Digital Experience Platform Market Volume K Unit Forecast, by Country 2019 & 2032
- Table 93: United Arab Emirates Digital Experience Platform Market Revenue (Million) Forecast, by Application 2019 & 2032
- Table 94: United Arab Emirates Digital Experience Platform Market Volume (K Unit) Forecast, by Application 2019 & 2032
- Table 95: Saudi Arabia Digital Experience Platform Market Revenue (Million) Forecast, by Application 2019 & 2032
- Table 96: Saudi Arabia Digital Experience Platform Market Volume (K Unit) Forecast, by Application 2019 & 2032
- Table 97: South Africa Digital Experience Platform Market Revenue (Million) Forecast, by Application 2019 & 2032
- Table 98: South Africa Digital Experience Platform Market Volume (K Unit) Forecast, by Application 2019 & 2032
- Table 99: Rest of Middle East and Africa Digital Experience Platform Market Revenue (Million) Forecast, by Application 2019 & 2032
- Table 100: Rest of Middle East and Africa Digital Experience Platform Market Volume (K Unit) Forecast, by Application 2019 & 2032
- Table 101: Global Digital Experience Platform Market Revenue Million Forecast, by Component 2019 & 2032
- Table 102: Global Digital Experience Platform Market Volume K Unit Forecast, by Component 2019 & 2032
- Table 103: Global Digital Experience Platform Market Revenue Million Forecast, by Deployment Type 2019 & 2032
- Table 104: Global Digital Experience Platform Market Volume K Unit Forecast, by Deployment Type 2019 & 2032
- Table 105: Global Digital Experience Platform Market Revenue Million Forecast, by End Users 2019 & 2032
- Table 106: Global Digital Experience Platform Market Volume K Unit Forecast, by End Users 2019 & 2032
- Table 107: Global Digital Experience Platform Market Revenue Million Forecast, by Country 2019 & 2032
- Table 108: Global Digital Experience Platform Market Volume K Unit Forecast, by Country 2019 & 2032
- Table 109: Global Digital Experience Platform Market Revenue Million Forecast, by Component 2019 & 2032
- Table 110: Global Digital Experience Platform Market Volume K Unit Forecast, by Component 2019 & 2032
- Table 111: Global Digital Experience Platform Market Revenue Million Forecast, by Deployment Type 2019 & 2032
- Table 112: Global Digital Experience Platform Market Volume K Unit Forecast, by Deployment Type 2019 & 2032
- Table 113: Global Digital Experience Platform Market Revenue Million Forecast, by End Users 2019 & 2032
- Table 114: Global Digital Experience Platform Market Volume K Unit Forecast, by End Users 2019 & 2032
- Table 115: Global Digital Experience Platform Market Revenue Million Forecast, by Country 2019 & 2032
- Table 116: Global Digital Experience Platform Market Volume K Unit Forecast, by Country 2019 & 2032
- Table 117: Global Digital Experience Platform Market Revenue Million Forecast, by Component 2019 & 2032
- Table 118: Global Digital Experience Platform Market Volume K Unit Forecast, by Component 2019 & 2032
- Table 119: Global Digital Experience Platform Market Revenue Million Forecast, by Deployment Type 2019 & 2032
- Table 120: Global Digital Experience Platform Market Volume K Unit Forecast, by Deployment Type 2019 & 2032
- Table 121: Global Digital Experience Platform Market Revenue Million Forecast, by End Users 2019 & 2032
- Table 122: Global Digital Experience Platform Market Volume K Unit Forecast, by End Users 2019 & 2032
- Table 123: Global Digital Experience Platform Market Revenue Million Forecast, by Country 2019 & 2032
- Table 124: Global Digital Experience Platform Market Volume K Unit Forecast, by Country 2019 & 2032
- Table 125: Global Digital Experience Platform Market Revenue Million Forecast, by Component 2019 & 2032
- Table 126: Global Digital Experience Platform Market Volume K Unit Forecast, by Component 2019 & 2032
- Table 127: Global Digital Experience Platform Market Revenue Million Forecast, by Deployment Type 2019 & 2032
- Table 128: Global Digital Experience Platform Market Volume K Unit Forecast, by Deployment Type 2019 & 2032
- Table 129: Global Digital Experience Platform Market Revenue Million Forecast, by End Users 2019 & 2032
- Table 130: Global Digital Experience Platform Market Volume K Unit Forecast, by End Users 2019 & 2032
- Table 131: Global Digital Experience Platform Market Revenue Million Forecast, by Country 2019 & 2032
- Table 132: Global Digital Experience Platform Market Volume K Unit Forecast, by Country 2019 & 2032
- Table 133: Global Digital Experience Platform Market Revenue Million Forecast, by Component 2019 & 2032
- Table 134: Global Digital Experience Platform Market Volume K Unit Forecast, by Component 2019 & 2032
- Table 135: Global Digital Experience Platform Market Revenue Million Forecast, by Deployment Type 2019 & 2032
- Table 136: Global Digital Experience Platform Market Volume K Unit Forecast, by Deployment Type 2019 & 2032
- Table 137: Global Digital Experience Platform Market Revenue Million Forecast, by End Users 2019 & 2032
- Table 138: Global Digital Experience Platform Market Volume K Unit Forecast, by End Users 2019 & 2032
- Table 139: Global Digital Experience Platform Market Revenue Million Forecast, by Country 2019 & 2032
- Table 140: Global Digital Experience Platform Market Volume K Unit Forecast, by Country 2019 & 2032
- Table 141: Global Digital Experience Platform Market Revenue Million Forecast, by Component 2019 & 2032
- Table 142: Global Digital Experience Platform Market Volume K Unit Forecast, by Component 2019 & 2032
- Table 143: Global Digital Experience Platform Market Revenue Million Forecast, by Deployment Type 2019 & 2032
- Table 144: Global Digital Experience Platform Market Volume K Unit Forecast, by Deployment Type 2019 & 2032
- Table 145: Global Digital Experience Platform Market Revenue Million Forecast, by End Users 2019 & 2032
- Table 146: Global Digital Experience Platform Market Volume K Unit Forecast, by End Users 2019 & 2032
- Table 147: Global Digital Experience Platform Market Revenue Million Forecast, by Country 2019 & 2032
- Table 148: Global Digital Experience Platform Market Volume K Unit Forecast, by Country 2019 & 2032
Frequently Asked Questions
1. What is the projected Compound Annual Growth Rate (CAGR) of the Digital Experience Platform Market?
The projected CAGR is approximately 13.48%.
2. Which companies are prominent players in the Digital Experience Platform Market?
Key companies in the market include SDL PLC, Salesforce Inc, OpenText Corporation, IBM Corporation, Acqui, Microsoft Corporation, Adobe Inc, Oracle Corporation, Sitecore, SAP SE.
3. What are the main segments of the Digital Experience Platform Market?
The market segments include Component, Deployment Type, End Users.
4. Can you provide details about the market size?
The market size is estimated to be USD 14.08 Million as of 2022.
5. What are some drivers contributing to market growth?
Growing Deployment of Cloud-Based Solutions; Rising Demand for big Data Analytics.
6. What are the notable trends driving market growth?
On Cloud Deployment to Drive the Market Growth.
7. Are there any restraints impacting market growth?
Privacy and Data Security Issues.
8. Can you provide examples of recent developments in the market?
December 2022- The Bank of Thailand (BOT) has chosen Oracle Fusion Cloud Human Capital Management (HCM), a comprehensive HR system, to promote a digital workforce with a better employee experience. The BOT can reduce manual processes and improve workflows with Oracle Cloud HCM.
9. What pricing options are available for accessing the report?
Pricing options include single-user, multi-user, and enterprise licenses priced at USD 4750, USD 5250, and USD 8750 respectively.
10. Is the market size provided in terms of value or volume?
The market size is provided in terms of value, measured in Million and volume, measured in K Unit.
11. Are there any specific market keywords associated with the report?
Yes, the market keyword associated with the report is "Digital Experience Platform Market," which aids in identifying and referencing the specific market segment covered.
12. How do I determine which pricing option suits my needs best?
The pricing options vary based on user requirements and access needs. Individual users may opt for single-user licenses, while businesses requiring broader access may choose multi-user or enterprise licenses for cost-effective access to the report.
13. Are there any additional resources or data provided in the Digital Experience Platform Market report?
While the report offers comprehensive insights, it's advisable to review the specific contents or supplementary materials provided to ascertain if additional resources or data are available.
14. How can I stay updated on further developments or reports in the Digital Experience Platform Market?
To stay informed about further developments, trends, and reports in the Digital Experience Platform Market, consider subscribing to industry newsletters, following relevant companies and organizations, or regularly checking reputable industry news sources and publications.
Methodology
Step 1 - Identification of Relevant Samples Size from Population Database


Step 2 - Approaches for Defining Global Market Size (Value, Volume* & Price*)

Note*: In applicable scenarios
Step 3 - Data Sources
Primary Research
- Web Analytics
- Survey Reports
- Research Institute
- Latest Research Reports
- Opinion Leaders
Secondary Research
- Annual Reports
- White Paper
- Latest Press Release
- Industry Association
- Paid Database
- Investor Presentations

Step 4 - Data Triangulation
Involves using different sources of information in order to increase the validity of a study
These sources are likely to be stakeholders in a program - participants, other researchers, program staff, other community members, and so on.
Then we put all data in single framework & apply various statistical tools to find out the dynamic on the market.
During the analysis stage, feedback from the stakeholder groups would be compared to determine areas of agreement as well as areas of divergence
