

Key Insights
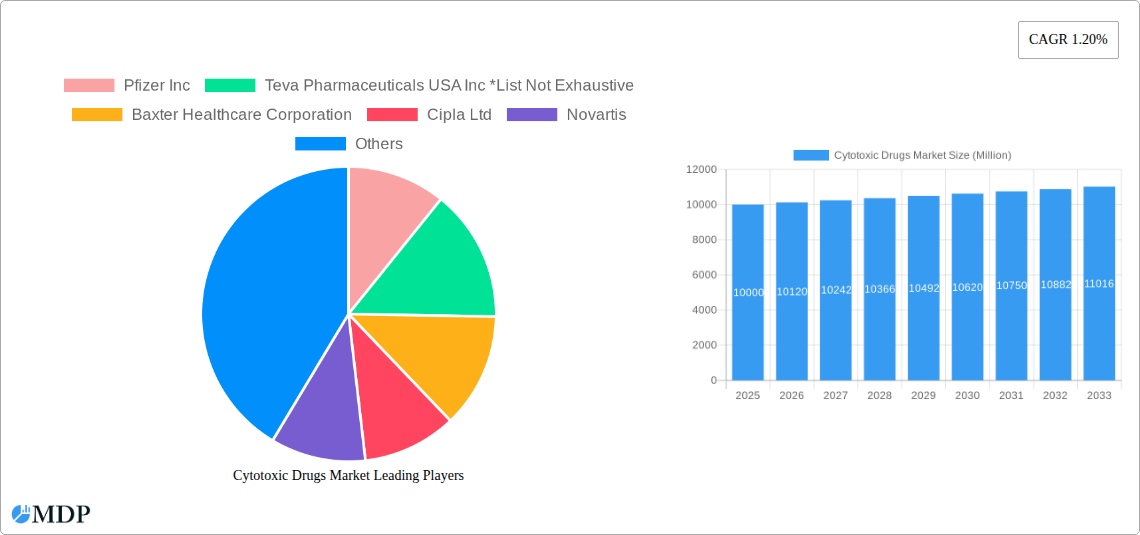
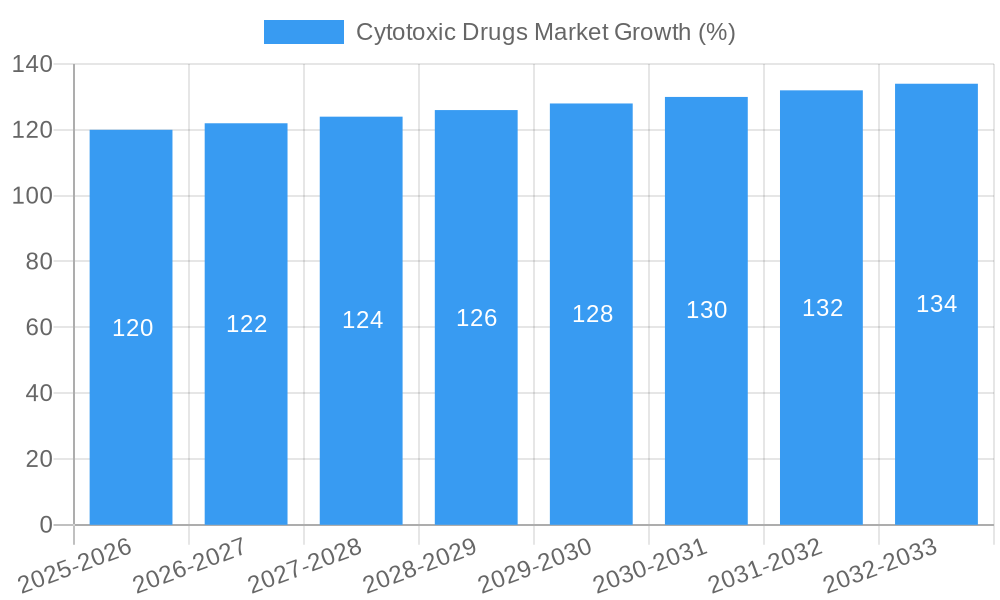
The cytotoxic drugs market, exhibiting a CAGR of 1.20%, is poised for steady growth throughout the forecast period (2025-2033). While the exact market size in 2025 (the base year) is not provided, we can infer a substantial value based on the historical period (2019-2024) and the projected CAGR. The market's expansion is driven by the rising incidence of various cancers, particularly breast, prostate, and lung cancers, globally. Advances in drug development, leading to more targeted and effective cytotoxic agents with reduced side effects, further fuel market growth. Increasing geriatric populations in developed regions like North America and Europe contribute significantly to the demand for cytotoxic drugs. However, the market faces certain restraints, including the high cost of treatment, stringent regulatory approvals, and the potential for severe side effects associated with cytotoxic therapies. Market segmentation reveals a preference for parenteral administration routes due to their efficacy, and alkylating agents and antimetabolites dominate the drug type segment, reflecting their established roles in cancer treatment. The competitive landscape is dominated by major pharmaceutical companies like Pfizer, Novartis, and Johnson & Johnson, among others, each actively engaged in research and development to enhance existing treatments and introduce novel therapies.
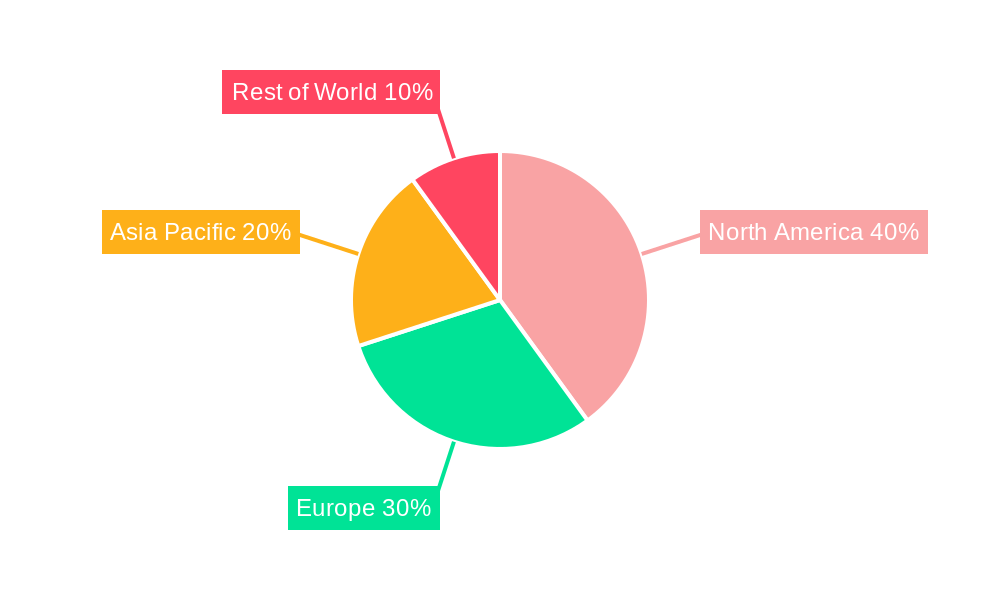
The regional distribution of the cytotoxic drugs market reflects the disparity in healthcare infrastructure and cancer prevalence across the globe. North America and Europe currently hold the largest market share due to factors such as higher disposable incomes, robust healthcare systems, and higher cancer incidence rates. However, the Asia Pacific region is predicted to witness significant growth in the coming years due to rising awareness, improving healthcare infrastructure, and a growing population susceptible to various cancers. The increasing adoption of advanced treatment modalities and expanding access to healthcare in developing economies are likely to further propel the market's expansion in these regions. Competitive dynamics will continue to be influenced by factors such as new drug approvals, strategic partnerships, and mergers and acquisitions. The market's future trajectory hinges on successful clinical trials, the introduction of innovative therapies, and the ongoing efforts to mitigate the challenges associated with cytotoxic drug use.
Cytotoxic Drugs Market: A Comprehensive Report (2019-2033)
This in-depth report provides a comprehensive analysis of the Cytotoxic Drugs Market, offering valuable insights for stakeholders across the pharmaceutical and healthcare industries. The study period spans 2019-2033, with 2025 serving as the base and estimated year. The report leverages extensive market research to forecast market trends from 2025 to 2033, building upon historical data from 2019-2024. The market is segmented by route of administration (Parenteral, Oral), drug type (Alkylating Agents, Antitumor Antibiotics, Antimetabolites, Plant Alkaloids, Other Drug Types), and application (Breast Cancer, Prostate Cancer, Lung Cancer, Pancreatic Cancer, Other Applications). Key players like Pfizer Inc, Teva Pharmaceuticals USA Inc, Baxter Healthcare Corporation, Cipla Ltd, Novartis, Eli Lilly and Company, Sun Pharmaceuticals, Fresenius Kabi AG, Mylan NV, and Johnson & Johnson are profiled in detail. The report is projected to reach xx Million by 2033 and is expected to grow at a CAGR of xx% during the forecast period.
Cytotoxic Drugs Market Market Dynamics & Concentration
The cytotoxic drugs market is characterized by a moderately concentrated landscape, with a handful of multinational pharmaceutical giants holding significant market share. Innovation is a crucial driver, with companies constantly striving to develop novel therapies with improved efficacy and reduced toxicity. Stringent regulatory frameworks, particularly concerning safety and efficacy, significantly influence market dynamics. The market faces competition from emerging targeted therapies and immunotherapies, presenting both opportunities and challenges. Mergers and acquisitions (M&A) activities are frequent, reflecting consolidation within the industry.
- Market Concentration: The top five players hold an estimated xx% market share in 2025.
- Innovation Drivers: Ongoing research into novel drug mechanisms and delivery systems is driving market growth.
- Regulatory Frameworks: Stringent regulatory approvals influence product launch timelines and market entry.
- Product Substitutes: Targeted therapies and immunotherapies represent significant competitive pressure.
- End-User Trends: Increasing cancer incidence and the demand for effective treatments fuel market expansion.
- M&A Activities: An estimated xx M&A deals were recorded in the period 2019-2024.
Cytotoxic Drugs Market Industry Trends & Analysis
The cytotoxic drugs market is experiencing robust growth, driven by several key factors. The rising global prevalence of cancer, coupled with an aging population, significantly fuels market expansion. Technological advancements, particularly in targeted drug delivery and personalized medicine, are enhancing treatment efficacy and reducing side effects. Consumer preference for less toxic and more effective therapies creates opportunities for innovation. However, the market remains intensely competitive, with established players facing pressure from emerging biotech companies and generic drug manufacturers. The market penetration of novel cytotoxic drugs is increasing, with a significant adoption rate observed in developed economies and rising adoption in emerging markets. This drives market growth with a projected CAGR of xx% during 2025-2033.
Leading Markets & Segments in Cytotoxic Drugs Market
The Parenteral route of administration dominates the market, driven by its efficacy in delivering high drug concentrations directly to the target site. Among drug types, Alkylating Agents and Antimetabolites hold significant market share. Breast cancer and Lung cancer are major application areas, owing to their high prevalence and the widespread use of cytotoxic drugs in their treatment.
- Dominant Region: North America currently holds the largest market share, followed by Europe.
- Key Drivers (North America):
- Extensive healthcare infrastructure
- High cancer prevalence rates
- Robust R&D investments
- Key Drivers (Europe):
- Favorable reimbursement policies
- Growing adoption of advanced therapies
- Dominant Segment (By Route of Administration): Parenteral
- Dominant Segment (By Drug Type): Alkylating Agents
- Dominant Segment (By Application): Breast Cancer
Cytotoxic Drugs Market Product Developments
Recent product developments focus on targeted drug delivery systems to minimize off-target effects and improve efficacy. This includes advancements in liposomal formulations, antibody-drug conjugates, and other innovative delivery mechanisms. The development of personalized medicine approaches allows for tailored treatment regimens based on individual patient characteristics and tumor profiles, leading to improved patient outcomes and enhanced market competitiveness.
Key Drivers of Cytotoxic Drugs Market Growth
The increasing incidence of cancer globally is a primary driver. Technological advancements, like targeted therapies and improved delivery systems, are increasing efficacy and patient compliance. Favorable regulatory approvals in key markets facilitate product launches and expansion. Furthermore, substantial R&D investments continue to fuel the pipeline of new and improved cytotoxic drugs.
Challenges in the Cytotoxic Drugs Market Market
High development costs and stringent regulatory requirements pose significant hurdles. Supply chain disruptions can impact the availability of active pharmaceutical ingredients (APIs) and finished products. Intense competition from generic drugs and emerging therapies exerts pressure on pricing and market share. The overall estimated impact of these challenges on the market is a reduction of xx Million in market value by 2033.
Emerging Opportunities in Cytotoxic Drugs Market
The development of novel targeted therapies, with reduced toxicity profiles, presents significant opportunities. Strategic partnerships and collaborations between pharmaceutical companies and research institutions will drive innovation. Expansion into emerging markets with high unmet medical needs offers substantial growth potential. Technological breakthroughs in areas like immunotherapy and personalized medicine will shape future market dynamics.
Leading Players in the Cytotoxic Drugs Market Sector
- Pfizer Inc
- Teva Pharmaceuticals USA Inc
- Baxter Healthcare Corporation
- Cipla Ltd
- Novartis
- Eli Lilly and Company
- Sun Pharmaceuticals
- Fresenius Kabi AG
- Mylan NV
- Johnson & Johnson
Key Milestones in Cytotoxic Drugs Market Industry
- 2020: FDA approval of a novel alkylating agent for multiple myeloma.
- 2021: Launch of a new liposomal formulation of an existing cytotoxic drug.
- 2022: Major pharmaceutical company A acquires a biotech firm specializing in targeted therapies.
- 2023: Publication of landmark clinical trial results demonstrating the efficacy of a new immunotherapy drug.
Strategic Outlook for Cytotoxic Drugs Market Market
The cytotoxic drugs market is poised for continued growth, driven by ongoing innovation and unmet medical needs. Strategic investments in R&D, targeted therapies, and personalized medicine approaches will be crucial for success. Expansion into emerging markets and strategic partnerships will further enhance market penetration and profitability. The market is predicted to have substantial growth opportunities, with the potential to reach xx Million by 2033.
Cytotoxic Drugs Market Segmentation
-
1. Route of Administration
- 1.1. Parenteral
- 1.2. Oral
-
2. Drug Type
- 2.1. Alkylating Agents
- 2.2. Antitumor Antibiotics
- 2.3. Antimetabolites
- 2.4. Plant Alkaloids
- 2.5. Other Drug Types
-
3. Application
- 3.1. Breast Cancer
- 3.2. Prostate Cancer
- 3.3. Lung Cancer
- 3.4. Pancreatic Cancer
- 3.5. Other Applications
Cytotoxic Drugs Market Segmentation By Geography
-
1. North America
- 1.1. United States
- 1.2. Canada
- 1.3. Mexico
-
2. Europe
- 2.1. Germany
- 2.2. United Kingdom
- 2.3. France
- 2.4. Italy
- 2.5. Spain
- 2.6. Rest of Europe
-
3. Asia Pacific
- 3.1. China
- 3.2. Japan
- 3.3. India
- 3.4. Australia
- 3.5. South Korea
- 3.6. Rest of Asia Pacific
- 4. Middle East
-
5. GCC
- 5.1. South Africa
- 5.2. Rest of Middle East
-
6. South America
- 6.1. Brazil
- 6.2. Argentina
- 6.3. Rest of South America
Cytotoxic Drugs Market REPORT HIGHLIGHTS
| Aspects | Details |
|---|---|
| Study Period | 2019-2033 |
| Base Year | 2024 |
| Estimated Year | 2025 |
| Forecast Period | 2025-2033 |
| Historical Period | 2019-2024 |
| Growth Rate | CAGR of 1.20% from 2019-2033 |
| Segmentation |
|
Table of Contents
- 1. Introduction
- 1.1. Research Scope
- 1.2. Market Segmentation
- 1.3. Research Methodology
- 1.4. Definitions and Assumptions
- 2. Executive Summary
- 2.1. Introduction
- 3. Market Dynamics
- 3.1. Introduction
- 3.2. Market Drivers
- 3.2.1. ; Increased Incidence of Target Disease; Supportive Government Legislation; Strong R&D Initiatives from Key Players
- 3.3. Market Restrains
- 3.3.1. ; Complications Associated with Cytotoxic Drugs; High Cost of Cytotoxic Cancer Drugs
- 3.4. Market Trends
- 3.4.1. The Breast Cancer Segment Is Anticipated To Expand At The Fastest CAGR And Is Expected To Continue The Same During The Forecast Period
- 4. Market Factor Analysis
- 4.1. Porters Five Forces
- 4.2. Supply/Value Chain
- 4.3. PESTEL analysis
- 4.4. Market Entropy
- 4.5. Patent/Trademark Analysis
- 5. Global Cytotoxic Drugs Market Analysis, Insights and Forecast, 2019-2031
- 5.1. Market Analysis, Insights and Forecast - by Route of Administration
- 5.1.1. Parenteral
- 5.1.2. Oral
- 5.2. Market Analysis, Insights and Forecast - by Drug Type
- 5.2.1. Alkylating Agents
- 5.2.2. Antitumor Antibiotics
- 5.2.3. Antimetabolites
- 5.2.4. Plant Alkaloids
- 5.2.5. Other Drug Types
- 5.3. Market Analysis, Insights and Forecast - by Application
- 5.3.1. Breast Cancer
- 5.3.2. Prostate Cancer
- 5.3.3. Lung Cancer
- 5.3.4. Pancreatic Cancer
- 5.3.5. Other Applications
- 5.4. Market Analysis, Insights and Forecast - by Region
- 5.4.1. North America
- 5.4.2. Europe
- 5.4.3. Asia Pacific
- 5.4.4. Middle East
- 5.4.5. GCC
- 5.4.6. South America
- 5.1. Market Analysis, Insights and Forecast - by Route of Administration
- 6. North America Cytotoxic Drugs Market Analysis, Insights and Forecast, 2019-2031
- 6.1. Market Analysis, Insights and Forecast - by Route of Administration
- 6.1.1. Parenteral
- 6.1.2. Oral
- 6.2. Market Analysis, Insights and Forecast - by Drug Type
- 6.2.1. Alkylating Agents
- 6.2.2. Antitumor Antibiotics
- 6.2.3. Antimetabolites
- 6.2.4. Plant Alkaloids
- 6.2.5. Other Drug Types
- 6.3. Market Analysis, Insights and Forecast - by Application
- 6.3.1. Breast Cancer
- 6.3.2. Prostate Cancer
- 6.3.3. Lung Cancer
- 6.3.4. Pancreatic Cancer
- 6.3.5. Other Applications
- 6.1. Market Analysis, Insights and Forecast - by Route of Administration
- 7. Europe Cytotoxic Drugs Market Analysis, Insights and Forecast, 2019-2031
- 7.1. Market Analysis, Insights and Forecast - by Route of Administration
- 7.1.1. Parenteral
- 7.1.2. Oral
- 7.2. Market Analysis, Insights and Forecast - by Drug Type
- 7.2.1. Alkylating Agents
- 7.2.2. Antitumor Antibiotics
- 7.2.3. Antimetabolites
- 7.2.4. Plant Alkaloids
- 7.2.5. Other Drug Types
- 7.3. Market Analysis, Insights and Forecast - by Application
- 7.3.1. Breast Cancer
- 7.3.2. Prostate Cancer
- 7.3.3. Lung Cancer
- 7.3.4. Pancreatic Cancer
- 7.3.5. Other Applications
- 7.1. Market Analysis, Insights and Forecast - by Route of Administration
- 8. Asia Pacific Cytotoxic Drugs Market Analysis, Insights and Forecast, 2019-2031
- 8.1. Market Analysis, Insights and Forecast - by Route of Administration
- 8.1.1. Parenteral
- 8.1.2. Oral
- 8.2. Market Analysis, Insights and Forecast - by Drug Type
- 8.2.1. Alkylating Agents
- 8.2.2. Antitumor Antibiotics
- 8.2.3. Antimetabolites
- 8.2.4. Plant Alkaloids
- 8.2.5. Other Drug Types
- 8.3. Market Analysis, Insights and Forecast - by Application
- 8.3.1. Breast Cancer
- 8.3.2. Prostate Cancer
- 8.3.3. Lung Cancer
- 8.3.4. Pancreatic Cancer
- 8.3.5. Other Applications
- 8.1. Market Analysis, Insights and Forecast - by Route of Administration
- 9. Middle East Cytotoxic Drugs Market Analysis, Insights and Forecast, 2019-2031
- 9.1. Market Analysis, Insights and Forecast - by Route of Administration
- 9.1.1. Parenteral
- 9.1.2. Oral
- 9.2. Market Analysis, Insights and Forecast - by Drug Type
- 9.2.1. Alkylating Agents
- 9.2.2. Antitumor Antibiotics
- 9.2.3. Antimetabolites
- 9.2.4. Plant Alkaloids
- 9.2.5. Other Drug Types
- 9.3. Market Analysis, Insights and Forecast - by Application
- 9.3.1. Breast Cancer
- 9.3.2. Prostate Cancer
- 9.3.3. Lung Cancer
- 9.3.4. Pancreatic Cancer
- 9.3.5. Other Applications
- 9.1. Market Analysis, Insights and Forecast - by Route of Administration
- 10. GCC Cytotoxic Drugs Market Analysis, Insights and Forecast, 2019-2031
- 10.1. Market Analysis, Insights and Forecast - by Route of Administration
- 10.1.1. Parenteral
- 10.1.2. Oral
- 10.2. Market Analysis, Insights and Forecast - by Drug Type
- 10.2.1. Alkylating Agents
- 10.2.2. Antitumor Antibiotics
- 10.2.3. Antimetabolites
- 10.2.4. Plant Alkaloids
- 10.2.5. Other Drug Types
- 10.3. Market Analysis, Insights and Forecast - by Application
- 10.3.1. Breast Cancer
- 10.3.2. Prostate Cancer
- 10.3.3. Lung Cancer
- 10.3.4. Pancreatic Cancer
- 10.3.5. Other Applications
- 10.1. Market Analysis, Insights and Forecast - by Route of Administration
- 11. South America Cytotoxic Drugs Market Analysis, Insights and Forecast, 2019-2031
- 11.1. Market Analysis, Insights and Forecast - by Route of Administration
- 11.1.1. Parenteral
- 11.1.2. Oral
- 11.2. Market Analysis, Insights and Forecast - by Drug Type
- 11.2.1. Alkylating Agents
- 11.2.2. Antitumor Antibiotics
- 11.2.3. Antimetabolites
- 11.2.4. Plant Alkaloids
- 11.2.5. Other Drug Types
- 11.3. Market Analysis, Insights and Forecast - by Application
- 11.3.1. Breast Cancer
- 11.3.2. Prostate Cancer
- 11.3.3. Lung Cancer
- 11.3.4. Pancreatic Cancer
- 11.3.5. Other Applications
- 11.1. Market Analysis, Insights and Forecast - by Route of Administration
- 12. North America Cytotoxic Drugs Market Analysis, Insights and Forecast, 2019-2031
- 12.1. Market Analysis, Insights and Forecast - By Country/Sub-region
- 12.1.1 United States
- 12.1.2 Canada
- 12.1.3 Mexico
- 13. Europe Cytotoxic Drugs Market Analysis, Insights and Forecast, 2019-2031
- 13.1. Market Analysis, Insights and Forecast - By Country/Sub-region
- 13.1.1 Germany
- 13.1.2 United Kingdom
- 13.1.3 France
- 13.1.4 Italy
- 13.1.5 Spain
- 13.1.6 Rest of Europe
- 14. Asia Pacific Cytotoxic Drugs Market Analysis, Insights and Forecast, 2019-2031
- 14.1. Market Analysis, Insights and Forecast - By Country/Sub-region
- 14.1.1 China
- 14.1.2 Japan
- 14.1.3 India
- 14.1.4 Australia
- 14.1.5 South Korea
- 14.1.6 Rest of Asia Pacific
- 15. Middle East Cytotoxic Drugs Market Analysis, Insights and Forecast, 2019-2031
- 15.1. Market Analysis, Insights and Forecast - By Country/Sub-region
- 15.1.1.
- 16. GCC Cytotoxic Drugs Market Analysis, Insights and Forecast, 2019-2031
- 16.1. Market Analysis, Insights and Forecast - By Country/Sub-region
- 16.1.1 South Africa
- 16.1.2 Rest of Middle East
- 17. South America Cytotoxic Drugs Market Analysis, Insights and Forecast, 2019-2031
- 17.1. Market Analysis, Insights and Forecast - By Country/Sub-region
- 17.1.1 Brazil
- 17.1.2 Argentina
- 17.1.3 Rest of South America
- 18. Competitive Analysis
- 18.1. Global Market Share Analysis 2024
- 18.2. Company Profiles
- 18.2.1 Pfizer Inc
- 18.2.1.1. Overview
- 18.2.1.2. Products
- 18.2.1.3. SWOT Analysis
- 18.2.1.4. Recent Developments
- 18.2.1.5. Financials (Based on Availability)
- 18.2.2 Teva Pharmaceuticals USA Inc *List Not Exhaustive
- 18.2.2.1. Overview
- 18.2.2.2. Products
- 18.2.2.3. SWOT Analysis
- 18.2.2.4. Recent Developments
- 18.2.2.5. Financials (Based on Availability)
- 18.2.3 Baxter Healthcare Corporation
- 18.2.3.1. Overview
- 18.2.3.2. Products
- 18.2.3.3. SWOT Analysis
- 18.2.3.4. Recent Developments
- 18.2.3.5. Financials (Based on Availability)
- 18.2.4 Cipla Ltd
- 18.2.4.1. Overview
- 18.2.4.2. Products
- 18.2.4.3. SWOT Analysis
- 18.2.4.4. Recent Developments
- 18.2.4.5. Financials (Based on Availability)
- 18.2.5 Novartis
- 18.2.5.1. Overview
- 18.2.5.2. Products
- 18.2.5.3. SWOT Analysis
- 18.2.5.4. Recent Developments
- 18.2.5.5. Financials (Based on Availability)
- 18.2.6 Eli Lilly and Company
- 18.2.6.1. Overview
- 18.2.6.2. Products
- 18.2.6.3. SWOT Analysis
- 18.2.6.4. Recent Developments
- 18.2.6.5. Financials (Based on Availability)
- 18.2.7 Sun Pharmaceuticals
- 18.2.7.1. Overview
- 18.2.7.2. Products
- 18.2.7.3. SWOT Analysis
- 18.2.7.4. Recent Developments
- 18.2.7.5. Financials (Based on Availability)
- 18.2.8 Fresenius Kabi AG
- 18.2.8.1. Overview
- 18.2.8.2. Products
- 18.2.8.3. SWOT Analysis
- 18.2.8.4. Recent Developments
- 18.2.8.5. Financials (Based on Availability)
- 18.2.9 Mylan NV
- 18.2.9.1. Overview
- 18.2.9.2. Products
- 18.2.9.3. SWOT Analysis
- 18.2.9.4. Recent Developments
- 18.2.9.5. Financials (Based on Availability)
- 18.2.10 Johnson & Johnson
- 18.2.10.1. Overview
- 18.2.10.2. Products
- 18.2.10.3. SWOT Analysis
- 18.2.10.4. Recent Developments
- 18.2.10.5. Financials (Based on Availability)
- 18.2.1 Pfizer Inc
List of Figures
- Figure 1: Global Cytotoxic Drugs Market Revenue Breakdown (Million, %) by Region 2024 & 2032
- Figure 2: North America Cytotoxic Drugs Market Revenue (Million), by Country 2024 & 2032
- Figure 3: North America Cytotoxic Drugs Market Revenue Share (%), by Country 2024 & 2032
- Figure 4: Europe Cytotoxic Drugs Market Revenue (Million), by Country 2024 & 2032
- Figure 5: Europe Cytotoxic Drugs Market Revenue Share (%), by Country 2024 & 2032
- Figure 6: Asia Pacific Cytotoxic Drugs Market Revenue (Million), by Country 2024 & 2032
- Figure 7: Asia Pacific Cytotoxic Drugs Market Revenue Share (%), by Country 2024 & 2032
- Figure 8: Middle East Cytotoxic Drugs Market Revenue (Million), by Country 2024 & 2032
- Figure 9: Middle East Cytotoxic Drugs Market Revenue Share (%), by Country 2024 & 2032
- Figure 10: GCC Cytotoxic Drugs Market Revenue (Million), by Country 2024 & 2032
- Figure 11: GCC Cytotoxic Drugs Market Revenue Share (%), by Country 2024 & 2032
- Figure 12: South America Cytotoxic Drugs Market Revenue (Million), by Country 2024 & 2032
- Figure 13: South America Cytotoxic Drugs Market Revenue Share (%), by Country 2024 & 2032
- Figure 14: North America Cytotoxic Drugs Market Revenue (Million), by Route of Administration 2024 & 2032
- Figure 15: North America Cytotoxic Drugs Market Revenue Share (%), by Route of Administration 2024 & 2032
- Figure 16: North America Cytotoxic Drugs Market Revenue (Million), by Drug Type 2024 & 2032
- Figure 17: North America Cytotoxic Drugs Market Revenue Share (%), by Drug Type 2024 & 2032
- Figure 18: North America Cytotoxic Drugs Market Revenue (Million), by Application 2024 & 2032
- Figure 19: North America Cytotoxic Drugs Market Revenue Share (%), by Application 2024 & 2032
- Figure 20: North America Cytotoxic Drugs Market Revenue (Million), by Country 2024 & 2032
- Figure 21: North America Cytotoxic Drugs Market Revenue Share (%), by Country 2024 & 2032
- Figure 22: Europe Cytotoxic Drugs Market Revenue (Million), by Route of Administration 2024 & 2032
- Figure 23: Europe Cytotoxic Drugs Market Revenue Share (%), by Route of Administration 2024 & 2032
- Figure 24: Europe Cytotoxic Drugs Market Revenue (Million), by Drug Type 2024 & 2032
- Figure 25: Europe Cytotoxic Drugs Market Revenue Share (%), by Drug Type 2024 & 2032
- Figure 26: Europe Cytotoxic Drugs Market Revenue (Million), by Application 2024 & 2032
- Figure 27: Europe Cytotoxic Drugs Market Revenue Share (%), by Application 2024 & 2032
- Figure 28: Europe Cytotoxic Drugs Market Revenue (Million), by Country 2024 & 2032
- Figure 29: Europe Cytotoxic Drugs Market Revenue Share (%), by Country 2024 & 2032
- Figure 30: Asia Pacific Cytotoxic Drugs Market Revenue (Million), by Route of Administration 2024 & 2032
- Figure 31: Asia Pacific Cytotoxic Drugs Market Revenue Share (%), by Route of Administration 2024 & 2032
- Figure 32: Asia Pacific Cytotoxic Drugs Market Revenue (Million), by Drug Type 2024 & 2032
- Figure 33: Asia Pacific Cytotoxic Drugs Market Revenue Share (%), by Drug Type 2024 & 2032
- Figure 34: Asia Pacific Cytotoxic Drugs Market Revenue (Million), by Application 2024 & 2032
- Figure 35: Asia Pacific Cytotoxic Drugs Market Revenue Share (%), by Application 2024 & 2032
- Figure 36: Asia Pacific Cytotoxic Drugs Market Revenue (Million), by Country 2024 & 2032
- Figure 37: Asia Pacific Cytotoxic Drugs Market Revenue Share (%), by Country 2024 & 2032
- Figure 38: Middle East Cytotoxic Drugs Market Revenue (Million), by Route of Administration 2024 & 2032
- Figure 39: Middle East Cytotoxic Drugs Market Revenue Share (%), by Route of Administration 2024 & 2032
- Figure 40: Middle East Cytotoxic Drugs Market Revenue (Million), by Drug Type 2024 & 2032
- Figure 41: Middle East Cytotoxic Drugs Market Revenue Share (%), by Drug Type 2024 & 2032
- Figure 42: Middle East Cytotoxic Drugs Market Revenue (Million), by Application 2024 & 2032
- Figure 43: Middle East Cytotoxic Drugs Market Revenue Share (%), by Application 2024 & 2032
- Figure 44: Middle East Cytotoxic Drugs Market Revenue (Million), by Country 2024 & 2032
- Figure 45: Middle East Cytotoxic Drugs Market Revenue Share (%), by Country 2024 & 2032
- Figure 46: GCC Cytotoxic Drugs Market Revenue (Million), by Route of Administration 2024 & 2032
- Figure 47: GCC Cytotoxic Drugs Market Revenue Share (%), by Route of Administration 2024 & 2032
- Figure 48: GCC Cytotoxic Drugs Market Revenue (Million), by Drug Type 2024 & 2032
- Figure 49: GCC Cytotoxic Drugs Market Revenue Share (%), by Drug Type 2024 & 2032
- Figure 50: GCC Cytotoxic Drugs Market Revenue (Million), by Application 2024 & 2032
- Figure 51: GCC Cytotoxic Drugs Market Revenue Share (%), by Application 2024 & 2032
- Figure 52: GCC Cytotoxic Drugs Market Revenue (Million), by Country 2024 & 2032
- Figure 53: GCC Cytotoxic Drugs Market Revenue Share (%), by Country 2024 & 2032
- Figure 54: South America Cytotoxic Drugs Market Revenue (Million), by Route of Administration 2024 & 2032
- Figure 55: South America Cytotoxic Drugs Market Revenue Share (%), by Route of Administration 2024 & 2032
- Figure 56: South America Cytotoxic Drugs Market Revenue (Million), by Drug Type 2024 & 2032
- Figure 57: South America Cytotoxic Drugs Market Revenue Share (%), by Drug Type 2024 & 2032
- Figure 58: South America Cytotoxic Drugs Market Revenue (Million), by Application 2024 & 2032
- Figure 59: South America Cytotoxic Drugs Market Revenue Share (%), by Application 2024 & 2032
- Figure 60: South America Cytotoxic Drugs Market Revenue (Million), by Country 2024 & 2032
- Figure 61: South America Cytotoxic Drugs Market Revenue Share (%), by Country 2024 & 2032
List of Tables
- Table 1: Global Cytotoxic Drugs Market Revenue Million Forecast, by Region 2019 & 2032
- Table 2: Global Cytotoxic Drugs Market Revenue Million Forecast, by Route of Administration 2019 & 2032
- Table 3: Global Cytotoxic Drugs Market Revenue Million Forecast, by Drug Type 2019 & 2032
- Table 4: Global Cytotoxic Drugs Market Revenue Million Forecast, by Application 2019 & 2032
- Table 5: Global Cytotoxic Drugs Market Revenue Million Forecast, by Region 2019 & 2032
- Table 6: Global Cytotoxic Drugs Market Revenue Million Forecast, by Country 2019 & 2032
- Table 7: United States Cytotoxic Drugs Market Revenue (Million) Forecast, by Application 2019 & 2032
- Table 8: Canada Cytotoxic Drugs Market Revenue (Million) Forecast, by Application 2019 & 2032
- Table 9: Mexico Cytotoxic Drugs Market Revenue (Million) Forecast, by Application 2019 & 2032
- Table 10: Global Cytotoxic Drugs Market Revenue Million Forecast, by Country 2019 & 2032
- Table 11: Germany Cytotoxic Drugs Market Revenue (Million) Forecast, by Application 2019 & 2032
- Table 12: United Kingdom Cytotoxic Drugs Market Revenue (Million) Forecast, by Application 2019 & 2032
- Table 13: France Cytotoxic Drugs Market Revenue (Million) Forecast, by Application 2019 & 2032
- Table 14: Italy Cytotoxic Drugs Market Revenue (Million) Forecast, by Application 2019 & 2032
- Table 15: Spain Cytotoxic Drugs Market Revenue (Million) Forecast, by Application 2019 & 2032
- Table 16: Rest of Europe Cytotoxic Drugs Market Revenue (Million) Forecast, by Application 2019 & 2032
- Table 17: Global Cytotoxic Drugs Market Revenue Million Forecast, by Country 2019 & 2032
- Table 18: China Cytotoxic Drugs Market Revenue (Million) Forecast, by Application 2019 & 2032
- Table 19: Japan Cytotoxic Drugs Market Revenue (Million) Forecast, by Application 2019 & 2032
- Table 20: India Cytotoxic Drugs Market Revenue (Million) Forecast, by Application 2019 & 2032
- Table 21: Australia Cytotoxic Drugs Market Revenue (Million) Forecast, by Application 2019 & 2032
- Table 22: South Korea Cytotoxic Drugs Market Revenue (Million) Forecast, by Application 2019 & 2032
- Table 23: Rest of Asia Pacific Cytotoxic Drugs Market Revenue (Million) Forecast, by Application 2019 & 2032
- Table 24: Global Cytotoxic Drugs Market Revenue Million Forecast, by Country 2019 & 2032
- Table 25: Cytotoxic Drugs Market Revenue (Million) Forecast, by Application 2019 & 2032
- Table 26: Global Cytotoxic Drugs Market Revenue Million Forecast, by Country 2019 & 2032
- Table 27: South Africa Cytotoxic Drugs Market Revenue (Million) Forecast, by Application 2019 & 2032
- Table 28: Rest of Middle East Cytotoxic Drugs Market Revenue (Million) Forecast, by Application 2019 & 2032
- Table 29: Global Cytotoxic Drugs Market Revenue Million Forecast, by Country 2019 & 2032
- Table 30: Brazil Cytotoxic Drugs Market Revenue (Million) Forecast, by Application 2019 & 2032
- Table 31: Argentina Cytotoxic Drugs Market Revenue (Million) Forecast, by Application 2019 & 2032
- Table 32: Rest of South America Cytotoxic Drugs Market Revenue (Million) Forecast, by Application 2019 & 2032
- Table 33: Global Cytotoxic Drugs Market Revenue Million Forecast, by Route of Administration 2019 & 2032
- Table 34: Global Cytotoxic Drugs Market Revenue Million Forecast, by Drug Type 2019 & 2032
- Table 35: Global Cytotoxic Drugs Market Revenue Million Forecast, by Application 2019 & 2032
- Table 36: Global Cytotoxic Drugs Market Revenue Million Forecast, by Country 2019 & 2032
- Table 37: United States Cytotoxic Drugs Market Revenue (Million) Forecast, by Application 2019 & 2032
- Table 38: Canada Cytotoxic Drugs Market Revenue (Million) Forecast, by Application 2019 & 2032
- Table 39: Mexico Cytotoxic Drugs Market Revenue (Million) Forecast, by Application 2019 & 2032
- Table 40: Global Cytotoxic Drugs Market Revenue Million Forecast, by Route of Administration 2019 & 2032
- Table 41: Global Cytotoxic Drugs Market Revenue Million Forecast, by Drug Type 2019 & 2032
- Table 42: Global Cytotoxic Drugs Market Revenue Million Forecast, by Application 2019 & 2032
- Table 43: Global Cytotoxic Drugs Market Revenue Million Forecast, by Country 2019 & 2032
- Table 44: Germany Cytotoxic Drugs Market Revenue (Million) Forecast, by Application 2019 & 2032
- Table 45: United Kingdom Cytotoxic Drugs Market Revenue (Million) Forecast, by Application 2019 & 2032
- Table 46: France Cytotoxic Drugs Market Revenue (Million) Forecast, by Application 2019 & 2032
- Table 47: Italy Cytotoxic Drugs Market Revenue (Million) Forecast, by Application 2019 & 2032
- Table 48: Spain Cytotoxic Drugs Market Revenue (Million) Forecast, by Application 2019 & 2032
- Table 49: Rest of Europe Cytotoxic Drugs Market Revenue (Million) Forecast, by Application 2019 & 2032
- Table 50: Global Cytotoxic Drugs Market Revenue Million Forecast, by Route of Administration 2019 & 2032
- Table 51: Global Cytotoxic Drugs Market Revenue Million Forecast, by Drug Type 2019 & 2032
- Table 52: Global Cytotoxic Drugs Market Revenue Million Forecast, by Application 2019 & 2032
- Table 53: Global Cytotoxic Drugs Market Revenue Million Forecast, by Country 2019 & 2032
- Table 54: China Cytotoxic Drugs Market Revenue (Million) Forecast, by Application 2019 & 2032
- Table 55: Japan Cytotoxic Drugs Market Revenue (Million) Forecast, by Application 2019 & 2032
- Table 56: India Cytotoxic Drugs Market Revenue (Million) Forecast, by Application 2019 & 2032
- Table 57: Australia Cytotoxic Drugs Market Revenue (Million) Forecast, by Application 2019 & 2032
- Table 58: South Korea Cytotoxic Drugs Market Revenue (Million) Forecast, by Application 2019 & 2032
- Table 59: Rest of Asia Pacific Cytotoxic Drugs Market Revenue (Million) Forecast, by Application 2019 & 2032
- Table 60: Global Cytotoxic Drugs Market Revenue Million Forecast, by Route of Administration 2019 & 2032
- Table 61: Global Cytotoxic Drugs Market Revenue Million Forecast, by Drug Type 2019 & 2032
- Table 62: Global Cytotoxic Drugs Market Revenue Million Forecast, by Application 2019 & 2032
- Table 63: Global Cytotoxic Drugs Market Revenue Million Forecast, by Country 2019 & 2032
- Table 64: Global Cytotoxic Drugs Market Revenue Million Forecast, by Route of Administration 2019 & 2032
- Table 65: Global Cytotoxic Drugs Market Revenue Million Forecast, by Drug Type 2019 & 2032
- Table 66: Global Cytotoxic Drugs Market Revenue Million Forecast, by Application 2019 & 2032
- Table 67: Global Cytotoxic Drugs Market Revenue Million Forecast, by Country 2019 & 2032
- Table 68: South Africa Cytotoxic Drugs Market Revenue (Million) Forecast, by Application 2019 & 2032
- Table 69: Rest of Middle East Cytotoxic Drugs Market Revenue (Million) Forecast, by Application 2019 & 2032
- Table 70: Global Cytotoxic Drugs Market Revenue Million Forecast, by Route of Administration 2019 & 2032
- Table 71: Global Cytotoxic Drugs Market Revenue Million Forecast, by Drug Type 2019 & 2032
- Table 72: Global Cytotoxic Drugs Market Revenue Million Forecast, by Application 2019 & 2032
- Table 73: Global Cytotoxic Drugs Market Revenue Million Forecast, by Country 2019 & 2032
- Table 74: Brazil Cytotoxic Drugs Market Revenue (Million) Forecast, by Application 2019 & 2032
- Table 75: Argentina Cytotoxic Drugs Market Revenue (Million) Forecast, by Application 2019 & 2032
- Table 76: Rest of South America Cytotoxic Drugs Market Revenue (Million) Forecast, by Application 2019 & 2032
Frequently Asked Questions
1. What is the projected Compound Annual Growth Rate (CAGR) of the Cytotoxic Drugs Market?
The projected CAGR is approximately 1.20%.
2. Which companies are prominent players in the Cytotoxic Drugs Market?
Key companies in the market include Pfizer Inc, Teva Pharmaceuticals USA Inc *List Not Exhaustive, Baxter Healthcare Corporation, Cipla Ltd, Novartis, Eli Lilly and Company, Sun Pharmaceuticals, Fresenius Kabi AG, Mylan NV, Johnson & Johnson.
3. What are the main segments of the Cytotoxic Drugs Market?
The market segments include Route of Administration, Drug Type, Application.
4. Can you provide details about the market size?
The market size is estimated to be USD XX Million as of 2022.
5. What are some drivers contributing to market growth?
; Increased Incidence of Target Disease; Supportive Government Legislation; Strong R&D Initiatives from Key Players.
6. What are the notable trends driving market growth?
The Breast Cancer Segment Is Anticipated To Expand At The Fastest CAGR And Is Expected To Continue The Same During The Forecast Period.
7. Are there any restraints impacting market growth?
; Complications Associated with Cytotoxic Drugs; High Cost of Cytotoxic Cancer Drugs.
8. Can you provide examples of recent developments in the market?
N/A
9. What pricing options are available for accessing the report?
Pricing options include single-user, multi-user, and enterprise licenses priced at USD 4750, USD 5250, and USD 8750 respectively.
10. Is the market size provided in terms of value or volume?
The market size is provided in terms of value, measured in Million.
11. Are there any specific market keywords associated with the report?
Yes, the market keyword associated with the report is "Cytotoxic Drugs Market," which aids in identifying and referencing the specific market segment covered.
12. How do I determine which pricing option suits my needs best?
The pricing options vary based on user requirements and access needs. Individual users may opt for single-user licenses, while businesses requiring broader access may choose multi-user or enterprise licenses for cost-effective access to the report.
13. Are there any additional resources or data provided in the Cytotoxic Drugs Market report?
While the report offers comprehensive insights, it's advisable to review the specific contents or supplementary materials provided to ascertain if additional resources or data are available.
14. How can I stay updated on further developments or reports in the Cytotoxic Drugs Market?
To stay informed about further developments, trends, and reports in the Cytotoxic Drugs Market, consider subscribing to industry newsletters, following relevant companies and organizations, or regularly checking reputable industry news sources and publications.
Methodology
Step 1 - Identification of Relevant Samples Size from Population Database


Step 2 - Approaches for Defining Global Market Size (Value, Volume* & Price*)

Note*: In applicable scenarios
Step 3 - Data Sources
Primary Research
- Web Analytics
- Survey Reports
- Research Institute
- Latest Research Reports
- Opinion Leaders
Secondary Research
- Annual Reports
- White Paper
- Latest Press Release
- Industry Association
- Paid Database
- Investor Presentations

Step 4 - Data Triangulation
Involves using different sources of information in order to increase the validity of a study
These sources are likely to be stakeholders in a program - participants, other researchers, program staff, other community members, and so on.
Then we put all data in single framework & apply various statistical tools to find out the dynamic on the market.
During the analysis stage, feedback from the stakeholder groups would be compared to determine areas of agreement as well as areas of divergence
