

Key Insights
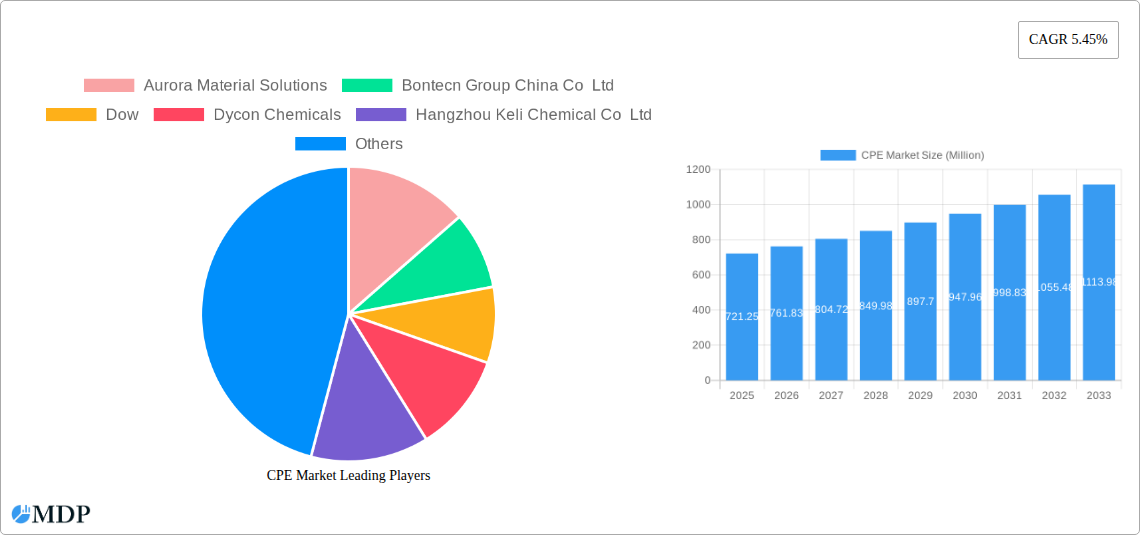
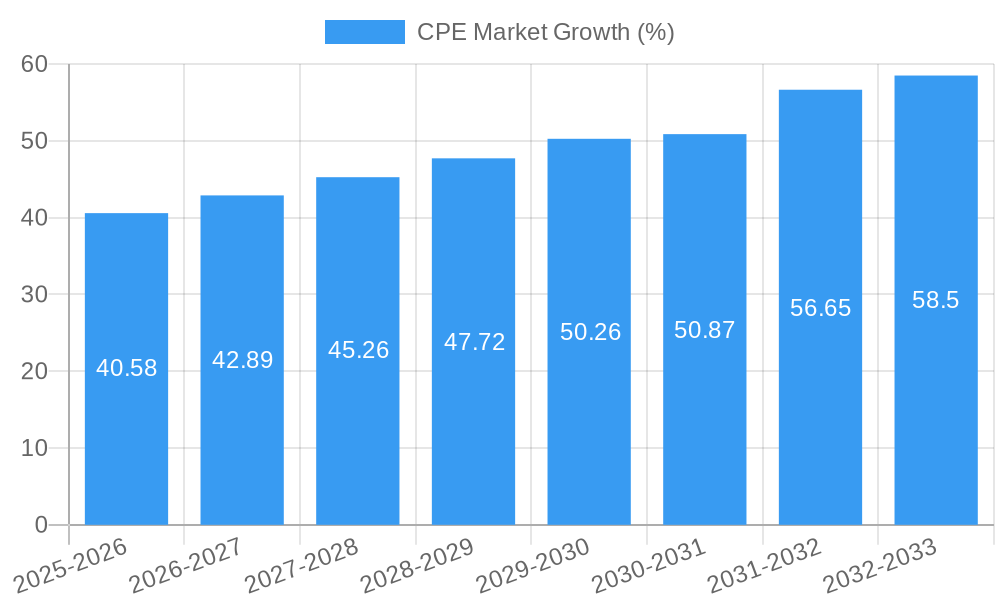
The Chlorinated Polyethylene (CPE) market, valued at $721.25 million in 2025, is projected to experience robust growth, driven by increasing demand across diverse sectors. A Compound Annual Growth Rate (CAGR) of 5.45% from 2025 to 2033 indicates a significant expansion of the market. Key drivers include the CPE's exceptional properties such as its excellent weather resistance, chemical inertness, and flexibility, making it ideal for various applications like cable jacketing, automotive parts, and sealing compounds. The rising construction activities globally further fuels the demand for CPE, contributing to market expansion. Growth is also fueled by advancements in CPE formulations, leading to enhanced material properties and broader application possibilities. While specific restraints are not provided, potential challenges could include fluctuations in raw material prices, stringent environmental regulations, and the emergence of alternative materials. However, continuous innovation and the development of sustainable CPE production methods are expected to mitigate these challenges.
The competitive landscape of the CPE market is characterized by a mix of established global players and regional manufacturers. Companies like Dow, Resonac Holdings Corporation, and several prominent Chinese manufacturers play significant roles, contributing to production capacity and innovation. The geographical distribution of the market is likely to see variations, with regions experiencing rapid industrialization and infrastructure development expected to witness higher growth rates. Further research into specific regional data is required to gain a detailed understanding of geographical market dynamics. The forecast period (2025-2033) suggests a continued positive trajectory for the CPE market, driven by its versatility and performance characteristics across numerous end-use applications.
CPE Market Report: A Comprehensive Analysis of Growth, Trends, and Opportunities (2019-2033)
This in-depth report provides a comprehensive analysis of the CPE (Chlorinated Polyethylene) market, covering market dynamics, industry trends, leading players, and future growth prospects. The study period spans from 2019 to 2033, with a base year of 2025 and a forecast period from 2025 to 2033. This report is essential for industry stakeholders, investors, and businesses seeking to understand and capitalize on the evolving CPE market landscape. The global CPE market is projected to reach xx Million by 2033, exhibiting a CAGR of xx% during the forecast period.
CPE Market Market Dynamics & Concentration
The CPE market is characterized by a moderate level of concentration, with several major players holding significant market share. However, the presence of numerous smaller regional players fosters competition. Market share data for 2024 reveals that the top 5 companies control approximately xx% of the global market. Innovation, driven by the need for improved material properties and expanding applications, is a key dynamic. Stringent regulatory frameworks regarding environmental compliance and product safety significantly influence market operations. CPE faces competition from alternative materials like PVC and other polymers, necessitating continuous innovation to maintain market relevance. End-user trends, particularly in the construction and automotive sectors, significantly impact demand. Mergers and acquisitions (M&A) activity, such as the May 2024 acquisition of EnCom Polymers Inc. by Aurora Plastics LLC, are reshaping the competitive landscape, driving consolidation and expanding product portfolios. In 2024, there were approximately xx M&A deals in the CPE market, contributing to market consolidation and increased competition.
- Market Concentration: Top 5 players hold approximately xx% market share in 2024.
- Innovation Drivers: Demand for enhanced material properties and broader applications.
- Regulatory Frameworks: Stringent environmental and safety regulations.
- Product Substitutes: Competition from PVC and other polymers.
- End-User Trends: Growing demand from construction and automotive sectors.
- M&A Activity: xx deals in 2024, leading to market consolidation.
CPE Market Industry Trends & Analysis
The CPE market is experiencing robust growth, driven by several key factors. Increasing demand from key end-use sectors such as construction (pipes, profiles, membranes) and automotive (seals, gaskets) fuel market expansion. Technological advancements, particularly in the development of CPE compounds with improved properties (e.g., higher flexibility, improved weather resistance), are driving innovation and product differentiation. Consumer preferences towards eco-friendly and sustainable materials are also influencing market dynamics. Competitive dynamics are characterized by price competition, product differentiation, and ongoing innovation, with established players expanding their product portfolios and exploring new markets. The market penetration of CPE in various applications is increasing steadily, with significant growth in emerging economies. The global CPE market is projected to experience a CAGR of xx% from 2025 to 2033, reaching a market value of xx Million by 2033.
Leading Markets & Segments in CPE Market
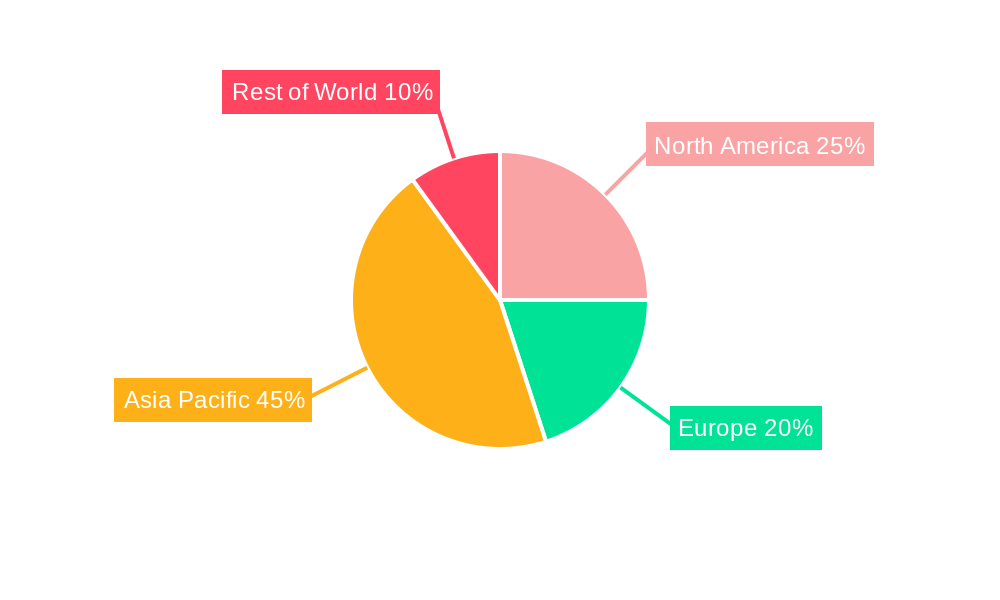
The Asia-Pacific region dominates the global CPE market, driven by robust economic growth, significant infrastructure development, and increasing industrialization in countries like China and India. These factors translate into substantial demand for CPE in various applications.
- Key Drivers in Asia-Pacific:
- Rapid economic growth and urbanization.
- Extensive infrastructure projects (roads, buildings, water management).
- Increasing industrial activity and manufacturing.
- Favorable government policies supporting infrastructure development.
China's substantial construction activity and automotive production significantly contribute to its dominant position. The construction segment holds the largest market share globally, followed by the automotive and packaging segments. This dominance reflects the extensive use of CPE in various applications within these sectors. The report provides a detailed analysis of market share by region and segment, projecting continued growth in the Asia-Pacific region and specific countries.
CPE Market Product Developments
Recent product developments focus on enhancing CPE's performance characteristics, including improved flexibility, impact resistance, and chemical resistance. Innovations in compounding technology and the incorporation of additives are improving CPE's suitability for diverse applications. These advancements broaden the range of potential applications and enhance CPE's competitiveness against substitute materials. The focus is on developing environmentally friendly and sustainable CPE formulations to meet the growing demand for eco-conscious materials.
Key Drivers of CPE Market Growth
The CPE market's growth is fueled by a confluence of factors. The construction industry's expansion drives substantial demand for CPE in various applications, such as pipes, profiles, and membranes. Similarly, the automotive sector relies heavily on CPE for seals, gaskets, and other components. Technological advancements leading to improved material properties and expanding application possibilities also contribute to market growth. Government initiatives promoting sustainable building materials and infrastructure projects further enhance market expansion.
Challenges in the CPE Market Market
Fluctuations in raw material prices and supply chain disruptions represent significant challenges for the CPE market. Stringent environmental regulations necessitate compliance investments, increasing production costs. Intense competition from substitute materials, such as PVC and other polymers, requires continuous innovation and product differentiation to maintain market share. These challenges necessitate strategic adaptation by market players.
Emerging Opportunities in CPE Market
Emerging opportunities exist in developing specialized CPE compounds tailored for niche applications, such as high-performance seals, medical devices, and advanced construction materials. Strategic partnerships and collaborations with downstream industries open avenues for market expansion. Exploring new geographical markets, especially in developing economies, offers considerable growth potential. Technological breakthroughs in CPE synthesis and modification will unlock further innovations and market penetration.
Leading Players in the CPE Market Sector
- Aurora Material Solutions
- Bontecn Group China Co Ltd
- Dow
- Dycon Chemicals
- Hangzhou Keli Chemical Co Ltd
- Jiangsu Tianteng Chemical Industry Co Ltd
- Resonac Holdings Corporation
- Shandong Gaoxin Chemical Co Ltd
- Shandong Ketian Chemical Co Ltd
- Shandong Novista Chemical Ltd (Novista Group)
- Shandong Xiangsheng New Materials Technology Co Ltd
- Shandong Xuye New Materials Co Ltd
- Sundow Polymers Co Ltd
- Weifang Yaxing Chemical Co Ltd
- *List Not Exhaustive
Key Milestones in CPE Market Industry
- May 2024: Aurora Plastics LLC (Aurora) announced the acquisition of EnCom Polymers Inc., expanding its product offering to include chlorinated polyethylene alloys (CPE) and strengthening its product portfolio.
Strategic Outlook for CPE Market Market
The CPE market exhibits promising long-term growth potential, driven by sustained demand from key end-use sectors and ongoing technological advancements. Strategic opportunities include focusing on developing sustainable and high-performance CPE compounds, expanding into new geographical markets, and forging strategic partnerships to broaden market reach and access new applications. Companies adopting innovation and sustainable practices are well-positioned to capture significant market share in the years to come.
CPE Market Segmentation
-
1. Product
- 1.1. CPE 135A
- 1.2. CPA 135B
- 1.3. Other Products
-
2. Application
- 2.1. Impact Modifier
- 2.2. Wire and Cable Jacketing
- 2.3. Hose and Tubing
- 2.4. Adhesives
- 2.5. Other Applications
CPE Market Segmentation By Geography
-
1. Asia Pacific
- 1.1. China
- 1.2. India
- 1.3. Japan
- 1.4. South Korea
- 1.5. Rest of Asia Pacific
-
2. North America
- 2.1. United States
- 2.2. Canada
- 2.3. Mexico
-
3. Europe
- 3.1. Germany
- 3.2. United Kingdom
- 3.3. France
- 3.4. Italy
- 3.5. Rest of Europe
-
4. South America
- 4.1. Brazil
- 4.2. Argentina
- 4.3. Rest of South America
-
5. Middle East and Africa
- 5.1. Saudi Arabia
- 5.2. South Africa
- 5.3. Rest of Middle East and Africa
CPE Market REPORT HIGHLIGHTS
| Aspects | Details |
|---|---|
| Study Period | 2019-2033 |
| Base Year | 2024 |
| Estimated Year | 2025 |
| Forecast Period | 2025-2033 |
| Historical Period | 2019-2024 |
| Growth Rate | CAGR of 5.45% from 2019-2033 |
| Segmentation |
|
Table of Contents
- 1. Introduction
- 1.1. Research Scope
- 1.2. Market Segmentation
- 1.3. Research Methodology
- 1.4. Definitions and Assumptions
- 2. Executive Summary
- 2.1. Introduction
- 3. Market Dynamics
- 3.1. Introduction
- 3.2. Market Drivers
- 3.2.1. Rising Demand for CPE-based Impact Modifiers in PVC Products; Growing Demand for CPE-based Hoses and Tubes in the Automotive Industry
- 3.3. Market Restrains
- 3.3.1. Rising Demand for CPE-based Impact Modifiers in PVC Products; Growing Demand for CPE-based Hoses and Tubes in the Automotive Industry
- 3.4. Market Trends
- 3.4.1. Impact Modifier is Expected to Dominate the Market
- 4. Market Factor Analysis
- 4.1. Porters Five Forces
- 4.2. Supply/Value Chain
- 4.3. PESTEL analysis
- 4.4. Market Entropy
- 4.5. Patent/Trademark Analysis
- 5. Global CPE Market Analysis, Insights and Forecast, 2019-2031
- 5.1. Market Analysis, Insights and Forecast - by Product
- 5.1.1. CPE 135A
- 5.1.2. CPA 135B
- 5.1.3. Other Products
- 5.2. Market Analysis, Insights and Forecast - by Application
- 5.2.1. Impact Modifier
- 5.2.2. Wire and Cable Jacketing
- 5.2.3. Hose and Tubing
- 5.2.4. Adhesives
- 5.2.5. Other Applications
- 5.3. Market Analysis, Insights and Forecast - by Region
- 5.3.1. Asia Pacific
- 5.3.2. North America
- 5.3.3. Europe
- 5.3.4. South America
- 5.3.5. Middle East and Africa
- 5.1. Market Analysis, Insights and Forecast - by Product
- 6. Asia Pacific CPE Market Analysis, Insights and Forecast, 2019-2031
- 6.1. Market Analysis, Insights and Forecast - by Product
- 6.1.1. CPE 135A
- 6.1.2. CPA 135B
- 6.1.3. Other Products
- 6.2. Market Analysis, Insights and Forecast - by Application
- 6.2.1. Impact Modifier
- 6.2.2. Wire and Cable Jacketing
- 6.2.3. Hose and Tubing
- 6.2.4. Adhesives
- 6.2.5. Other Applications
- 6.1. Market Analysis, Insights and Forecast - by Product
- 7. North America CPE Market Analysis, Insights and Forecast, 2019-2031
- 7.1. Market Analysis, Insights and Forecast - by Product
- 7.1.1. CPE 135A
- 7.1.2. CPA 135B
- 7.1.3. Other Products
- 7.2. Market Analysis, Insights and Forecast - by Application
- 7.2.1. Impact Modifier
- 7.2.2. Wire and Cable Jacketing
- 7.2.3. Hose and Tubing
- 7.2.4. Adhesives
- 7.2.5. Other Applications
- 7.1. Market Analysis, Insights and Forecast - by Product
- 8. Europe CPE Market Analysis, Insights and Forecast, 2019-2031
- 8.1. Market Analysis, Insights and Forecast - by Product
- 8.1.1. CPE 135A
- 8.1.2. CPA 135B
- 8.1.3. Other Products
- 8.2. Market Analysis, Insights and Forecast - by Application
- 8.2.1. Impact Modifier
- 8.2.2. Wire and Cable Jacketing
- 8.2.3. Hose and Tubing
- 8.2.4. Adhesives
- 8.2.5. Other Applications
- 8.1. Market Analysis, Insights and Forecast - by Product
- 9. South America CPE Market Analysis, Insights and Forecast, 2019-2031
- 9.1. Market Analysis, Insights and Forecast - by Product
- 9.1.1. CPE 135A
- 9.1.2. CPA 135B
- 9.1.3. Other Products
- 9.2. Market Analysis, Insights and Forecast - by Application
- 9.2.1. Impact Modifier
- 9.2.2. Wire and Cable Jacketing
- 9.2.3. Hose and Tubing
- 9.2.4. Adhesives
- 9.2.5. Other Applications
- 9.1. Market Analysis, Insights and Forecast - by Product
- 10. Middle East and Africa CPE Market Analysis, Insights and Forecast, 2019-2031
- 10.1. Market Analysis, Insights and Forecast - by Product
- 10.1.1. CPE 135A
- 10.1.2. CPA 135B
- 10.1.3. Other Products
- 10.2. Market Analysis, Insights and Forecast - by Application
- 10.2.1. Impact Modifier
- 10.2.2. Wire and Cable Jacketing
- 10.2.3. Hose and Tubing
- 10.2.4. Adhesives
- 10.2.5. Other Applications
- 10.1. Market Analysis, Insights and Forecast - by Product
- 11. Competitive Analysis
- 11.1. Global Market Share Analysis 2024
- 11.2. Company Profiles
- 11.2.1 Aurora Material Solutions
- 11.2.1.1. Overview
- 11.2.1.2. Products
- 11.2.1.3. SWOT Analysis
- 11.2.1.4. Recent Developments
- 11.2.1.5. Financials (Based on Availability)
- 11.2.2 Bontecn Group China Co Ltd
- 11.2.2.1. Overview
- 11.2.2.2. Products
- 11.2.2.3. SWOT Analysis
- 11.2.2.4. Recent Developments
- 11.2.2.5. Financials (Based on Availability)
- 11.2.3 Dow
- 11.2.3.1. Overview
- 11.2.3.2. Products
- 11.2.3.3. SWOT Analysis
- 11.2.3.4. Recent Developments
- 11.2.3.5. Financials (Based on Availability)
- 11.2.4 Dycon Chemicals
- 11.2.4.1. Overview
- 11.2.4.2. Products
- 11.2.4.3. SWOT Analysis
- 11.2.4.4. Recent Developments
- 11.2.4.5. Financials (Based on Availability)
- 11.2.5 Hangzhou Keli Chemical Co Ltd
- 11.2.5.1. Overview
- 11.2.5.2. Products
- 11.2.5.3. SWOT Analysis
- 11.2.5.4. Recent Developments
- 11.2.5.5. Financials (Based on Availability)
- 11.2.6 Jiangsu Tianteng Chemical Industry Co Ltd
- 11.2.6.1. Overview
- 11.2.6.2. Products
- 11.2.6.3. SWOT Analysis
- 11.2.6.4. Recent Developments
- 11.2.6.5. Financials (Based on Availability)
- 11.2.7 Resonac Holdings Corporation
- 11.2.7.1. Overview
- 11.2.7.2. Products
- 11.2.7.3. SWOT Analysis
- 11.2.7.4. Recent Developments
- 11.2.7.5. Financials (Based on Availability)
- 11.2.8 Shandong Gaoxin Chemical Co Ltd
- 11.2.8.1. Overview
- 11.2.8.2. Products
- 11.2.8.3. SWOT Analysis
- 11.2.8.4. Recent Developments
- 11.2.8.5. Financials (Based on Availability)
- 11.2.9 Shandong Ketian Chemical Co Ltd
- 11.2.9.1. Overview
- 11.2.9.2. Products
- 11.2.9.3. SWOT Analysis
- 11.2.9.4. Recent Developments
- 11.2.9.5. Financials (Based on Availability)
- 11.2.10 Shandong Novista Chemical Ltd (Novista Group)
- 11.2.10.1. Overview
- 11.2.10.2. Products
- 11.2.10.3. SWOT Analysis
- 11.2.10.4. Recent Developments
- 11.2.10.5. Financials (Based on Availability)
- 11.2.11 Shandong Xiangsheng New Materials Technology Co Ltd
- 11.2.11.1. Overview
- 11.2.11.2. Products
- 11.2.11.3. SWOT Analysis
- 11.2.11.4. Recent Developments
- 11.2.11.5. Financials (Based on Availability)
- 11.2.12 Shandong Xuye New Materials Co Ltd
- 11.2.12.1. Overview
- 11.2.12.2. Products
- 11.2.12.3. SWOT Analysis
- 11.2.12.4. Recent Developments
- 11.2.12.5. Financials (Based on Availability)
- 11.2.13 Sundow Polymers Co Ltd
- 11.2.13.1. Overview
- 11.2.13.2. Products
- 11.2.13.3. SWOT Analysis
- 11.2.13.4. Recent Developments
- 11.2.13.5. Financials (Based on Availability)
- 11.2.14 Weifang Yaxing Chemical Co Ltd*List Not Exhaustive
- 11.2.14.1. Overview
- 11.2.14.2. Products
- 11.2.14.3. SWOT Analysis
- 11.2.14.4. Recent Developments
- 11.2.14.5. Financials (Based on Availability)
- 11.2.1 Aurora Material Solutions
List of Figures
- Figure 1: Global CPE Market Revenue Breakdown (Million, %) by Region 2024 & 2032
- Figure 2: Global CPE Market Volume Breakdown (Million, %) by Region 2024 & 2032
- Figure 3: Asia Pacific CPE Market Revenue (Million), by Product 2024 & 2032
- Figure 4: Asia Pacific CPE Market Volume (Million), by Product 2024 & 2032
- Figure 5: Asia Pacific CPE Market Revenue Share (%), by Product 2024 & 2032
- Figure 6: Asia Pacific CPE Market Volume Share (%), by Product 2024 & 2032
- Figure 7: Asia Pacific CPE Market Revenue (Million), by Application 2024 & 2032
- Figure 8: Asia Pacific CPE Market Volume (Million), by Application 2024 & 2032
- Figure 9: Asia Pacific CPE Market Revenue Share (%), by Application 2024 & 2032
- Figure 10: Asia Pacific CPE Market Volume Share (%), by Application 2024 & 2032
- Figure 11: Asia Pacific CPE Market Revenue (Million), by Country 2024 & 2032
- Figure 12: Asia Pacific CPE Market Volume (Million), by Country 2024 & 2032
- Figure 13: Asia Pacific CPE Market Revenue Share (%), by Country 2024 & 2032
- Figure 14: Asia Pacific CPE Market Volume Share (%), by Country 2024 & 2032
- Figure 15: North America CPE Market Revenue (Million), by Product 2024 & 2032
- Figure 16: North America CPE Market Volume (Million), by Product 2024 & 2032
- Figure 17: North America CPE Market Revenue Share (%), by Product 2024 & 2032
- Figure 18: North America CPE Market Volume Share (%), by Product 2024 & 2032
- Figure 19: North America CPE Market Revenue (Million), by Application 2024 & 2032
- Figure 20: North America CPE Market Volume (Million), by Application 2024 & 2032
- Figure 21: North America CPE Market Revenue Share (%), by Application 2024 & 2032
- Figure 22: North America CPE Market Volume Share (%), by Application 2024 & 2032
- Figure 23: North America CPE Market Revenue (Million), by Country 2024 & 2032
- Figure 24: North America CPE Market Volume (Million), by Country 2024 & 2032
- Figure 25: North America CPE Market Revenue Share (%), by Country 2024 & 2032
- Figure 26: North America CPE Market Volume Share (%), by Country 2024 & 2032
- Figure 27: Europe CPE Market Revenue (Million), by Product 2024 & 2032
- Figure 28: Europe CPE Market Volume (Million), by Product 2024 & 2032
- Figure 29: Europe CPE Market Revenue Share (%), by Product 2024 & 2032
- Figure 30: Europe CPE Market Volume Share (%), by Product 2024 & 2032
- Figure 31: Europe CPE Market Revenue (Million), by Application 2024 & 2032
- Figure 32: Europe CPE Market Volume (Million), by Application 2024 & 2032
- Figure 33: Europe CPE Market Revenue Share (%), by Application 2024 & 2032
- Figure 34: Europe CPE Market Volume Share (%), by Application 2024 & 2032
- Figure 35: Europe CPE Market Revenue (Million), by Country 2024 & 2032
- Figure 36: Europe CPE Market Volume (Million), by Country 2024 & 2032
- Figure 37: Europe CPE Market Revenue Share (%), by Country 2024 & 2032
- Figure 38: Europe CPE Market Volume Share (%), by Country 2024 & 2032
- Figure 39: South America CPE Market Revenue (Million), by Product 2024 & 2032
- Figure 40: South America CPE Market Volume (Million), by Product 2024 & 2032
- Figure 41: South America CPE Market Revenue Share (%), by Product 2024 & 2032
- Figure 42: South America CPE Market Volume Share (%), by Product 2024 & 2032
- Figure 43: South America CPE Market Revenue (Million), by Application 2024 & 2032
- Figure 44: South America CPE Market Volume (Million), by Application 2024 & 2032
- Figure 45: South America CPE Market Revenue Share (%), by Application 2024 & 2032
- Figure 46: South America CPE Market Volume Share (%), by Application 2024 & 2032
- Figure 47: South America CPE Market Revenue (Million), by Country 2024 & 2032
- Figure 48: South America CPE Market Volume (Million), by Country 2024 & 2032
- Figure 49: South America CPE Market Revenue Share (%), by Country 2024 & 2032
- Figure 50: South America CPE Market Volume Share (%), by Country 2024 & 2032
- Figure 51: Middle East and Africa CPE Market Revenue (Million), by Product 2024 & 2032
- Figure 52: Middle East and Africa CPE Market Volume (Million), by Product 2024 & 2032
- Figure 53: Middle East and Africa CPE Market Revenue Share (%), by Product 2024 & 2032
- Figure 54: Middle East and Africa CPE Market Volume Share (%), by Product 2024 & 2032
- Figure 55: Middle East and Africa CPE Market Revenue (Million), by Application 2024 & 2032
- Figure 56: Middle East and Africa CPE Market Volume (Million), by Application 2024 & 2032
- Figure 57: Middle East and Africa CPE Market Revenue Share (%), by Application 2024 & 2032
- Figure 58: Middle East and Africa CPE Market Volume Share (%), by Application 2024 & 2032
- Figure 59: Middle East and Africa CPE Market Revenue (Million), by Country 2024 & 2032
- Figure 60: Middle East and Africa CPE Market Volume (Million), by Country 2024 & 2032
- Figure 61: Middle East and Africa CPE Market Revenue Share (%), by Country 2024 & 2032
- Figure 62: Middle East and Africa CPE Market Volume Share (%), by Country 2024 & 2032
List of Tables
- Table 1: Global CPE Market Revenue Million Forecast, by Region 2019 & 2032
- Table 2: Global CPE Market Volume Million Forecast, by Region 2019 & 2032
- Table 3: Global CPE Market Revenue Million Forecast, by Product 2019 & 2032
- Table 4: Global CPE Market Volume Million Forecast, by Product 2019 & 2032
- Table 5: Global CPE Market Revenue Million Forecast, by Application 2019 & 2032
- Table 6: Global CPE Market Volume Million Forecast, by Application 2019 & 2032
- Table 7: Global CPE Market Revenue Million Forecast, by Region 2019 & 2032
- Table 8: Global CPE Market Volume Million Forecast, by Region 2019 & 2032
- Table 9: Global CPE Market Revenue Million Forecast, by Product 2019 & 2032
- Table 10: Global CPE Market Volume Million Forecast, by Product 2019 & 2032
- Table 11: Global CPE Market Revenue Million Forecast, by Application 2019 & 2032
- Table 12: Global CPE Market Volume Million Forecast, by Application 2019 & 2032
- Table 13: Global CPE Market Revenue Million Forecast, by Country 2019 & 2032
- Table 14: Global CPE Market Volume Million Forecast, by Country 2019 & 2032
- Table 15: China CPE Market Revenue (Million) Forecast, by Application 2019 & 2032
- Table 16: China CPE Market Volume (Million) Forecast, by Application 2019 & 2032
- Table 17: India CPE Market Revenue (Million) Forecast, by Application 2019 & 2032
- Table 18: India CPE Market Volume (Million) Forecast, by Application 2019 & 2032
- Table 19: Japan CPE Market Revenue (Million) Forecast, by Application 2019 & 2032
- Table 20: Japan CPE Market Volume (Million) Forecast, by Application 2019 & 2032
- Table 21: South Korea CPE Market Revenue (Million) Forecast, by Application 2019 & 2032
- Table 22: South Korea CPE Market Volume (Million) Forecast, by Application 2019 & 2032
- Table 23: Rest of Asia Pacific CPE Market Revenue (Million) Forecast, by Application 2019 & 2032
- Table 24: Rest of Asia Pacific CPE Market Volume (Million) Forecast, by Application 2019 & 2032
- Table 25: Global CPE Market Revenue Million Forecast, by Product 2019 & 2032
- Table 26: Global CPE Market Volume Million Forecast, by Product 2019 & 2032
- Table 27: Global CPE Market Revenue Million Forecast, by Application 2019 & 2032
- Table 28: Global CPE Market Volume Million Forecast, by Application 2019 & 2032
- Table 29: Global CPE Market Revenue Million Forecast, by Country 2019 & 2032
- Table 30: Global CPE Market Volume Million Forecast, by Country 2019 & 2032
- Table 31: United States CPE Market Revenue (Million) Forecast, by Application 2019 & 2032
- Table 32: United States CPE Market Volume (Million) Forecast, by Application 2019 & 2032
- Table 33: Canada CPE Market Revenue (Million) Forecast, by Application 2019 & 2032
- Table 34: Canada CPE Market Volume (Million) Forecast, by Application 2019 & 2032
- Table 35: Mexico CPE Market Revenue (Million) Forecast, by Application 2019 & 2032
- Table 36: Mexico CPE Market Volume (Million) Forecast, by Application 2019 & 2032
- Table 37: Global CPE Market Revenue Million Forecast, by Product 2019 & 2032
- Table 38: Global CPE Market Volume Million Forecast, by Product 2019 & 2032
- Table 39: Global CPE Market Revenue Million Forecast, by Application 2019 & 2032
- Table 40: Global CPE Market Volume Million Forecast, by Application 2019 & 2032
- Table 41: Global CPE Market Revenue Million Forecast, by Country 2019 & 2032
- Table 42: Global CPE Market Volume Million Forecast, by Country 2019 & 2032
- Table 43: Germany CPE Market Revenue (Million) Forecast, by Application 2019 & 2032
- Table 44: Germany CPE Market Volume (Million) Forecast, by Application 2019 & 2032
- Table 45: United Kingdom CPE Market Revenue (Million) Forecast, by Application 2019 & 2032
- Table 46: United Kingdom CPE Market Volume (Million) Forecast, by Application 2019 & 2032
- Table 47: France CPE Market Revenue (Million) Forecast, by Application 2019 & 2032
- Table 48: France CPE Market Volume (Million) Forecast, by Application 2019 & 2032
- Table 49: Italy CPE Market Revenue (Million) Forecast, by Application 2019 & 2032
- Table 50: Italy CPE Market Volume (Million) Forecast, by Application 2019 & 2032
- Table 51: Rest of Europe CPE Market Revenue (Million) Forecast, by Application 2019 & 2032
- Table 52: Rest of Europe CPE Market Volume (Million) Forecast, by Application 2019 & 2032
- Table 53: Global CPE Market Revenue Million Forecast, by Product 2019 & 2032
- Table 54: Global CPE Market Volume Million Forecast, by Product 2019 & 2032
- Table 55: Global CPE Market Revenue Million Forecast, by Application 2019 & 2032
- Table 56: Global CPE Market Volume Million Forecast, by Application 2019 & 2032
- Table 57: Global CPE Market Revenue Million Forecast, by Country 2019 & 2032
- Table 58: Global CPE Market Volume Million Forecast, by Country 2019 & 2032
- Table 59: Brazil CPE Market Revenue (Million) Forecast, by Application 2019 & 2032
- Table 60: Brazil CPE Market Volume (Million) Forecast, by Application 2019 & 2032
- Table 61: Argentina CPE Market Revenue (Million) Forecast, by Application 2019 & 2032
- Table 62: Argentina CPE Market Volume (Million) Forecast, by Application 2019 & 2032
- Table 63: Rest of South America CPE Market Revenue (Million) Forecast, by Application 2019 & 2032
- Table 64: Rest of South America CPE Market Volume (Million) Forecast, by Application 2019 & 2032
- Table 65: Global CPE Market Revenue Million Forecast, by Product 2019 & 2032
- Table 66: Global CPE Market Volume Million Forecast, by Product 2019 & 2032
- Table 67: Global CPE Market Revenue Million Forecast, by Application 2019 & 2032
- Table 68: Global CPE Market Volume Million Forecast, by Application 2019 & 2032
- Table 69: Global CPE Market Revenue Million Forecast, by Country 2019 & 2032
- Table 70: Global CPE Market Volume Million Forecast, by Country 2019 & 2032
- Table 71: Saudi Arabia CPE Market Revenue (Million) Forecast, by Application 2019 & 2032
- Table 72: Saudi Arabia CPE Market Volume (Million) Forecast, by Application 2019 & 2032
- Table 73: South Africa CPE Market Revenue (Million) Forecast, by Application 2019 & 2032
- Table 74: South Africa CPE Market Volume (Million) Forecast, by Application 2019 & 2032
- Table 75: Rest of Middle East and Africa CPE Market Revenue (Million) Forecast, by Application 2019 & 2032
- Table 76: Rest of Middle East and Africa CPE Market Volume (Million) Forecast, by Application 2019 & 2032
Frequently Asked Questions
1. What is the projected Compound Annual Growth Rate (CAGR) of the CPE Market?
The projected CAGR is approximately 5.45%.
2. Which companies are prominent players in the CPE Market?
Key companies in the market include Aurora Material Solutions, Bontecn Group China Co Ltd, Dow, Dycon Chemicals, Hangzhou Keli Chemical Co Ltd, Jiangsu Tianteng Chemical Industry Co Ltd, Resonac Holdings Corporation, Shandong Gaoxin Chemical Co Ltd, Shandong Ketian Chemical Co Ltd, Shandong Novista Chemical Ltd (Novista Group), Shandong Xiangsheng New Materials Technology Co Ltd, Shandong Xuye New Materials Co Ltd, Sundow Polymers Co Ltd, Weifang Yaxing Chemical Co Ltd*List Not Exhaustive.
3. What are the main segments of the CPE Market?
The market segments include Product, Application.
4. Can you provide details about the market size?
The market size is estimated to be USD 721.25 Million as of 2022.
5. What are some drivers contributing to market growth?
Rising Demand for CPE-based Impact Modifiers in PVC Products; Growing Demand for CPE-based Hoses and Tubes in the Automotive Industry.
6. What are the notable trends driving market growth?
Impact Modifier is Expected to Dominate the Market.
7. Are there any restraints impacting market growth?
Rising Demand for CPE-based Impact Modifiers in PVC Products; Growing Demand for CPE-based Hoses and Tubes in the Automotive Industry.
8. Can you provide examples of recent developments in the market?
May 2024: Aurora Plastics LLC (Aurora) announced the acquisition of EnCom Polymers Inc., extending its product offering to include chlorinated polyethylene alloys (CPE). This acquisition strengthened Aurora Plastics LLC's product portfolio.
9. What pricing options are available for accessing the report?
Pricing options include single-user, multi-user, and enterprise licenses priced at USD 4750, USD 5250, and USD 8750 respectively.
10. Is the market size provided in terms of value or volume?
The market size is provided in terms of value, measured in Million and volume, measured in Million.
11. Are there any specific market keywords associated with the report?
Yes, the market keyword associated with the report is "CPE Market," which aids in identifying and referencing the specific market segment covered.
12. How do I determine which pricing option suits my needs best?
The pricing options vary based on user requirements and access needs. Individual users may opt for single-user licenses, while businesses requiring broader access may choose multi-user or enterprise licenses for cost-effective access to the report.
13. Are there any additional resources or data provided in the CPE Market report?
While the report offers comprehensive insights, it's advisable to review the specific contents or supplementary materials provided to ascertain if additional resources or data are available.
14. How can I stay updated on further developments or reports in the CPE Market?
To stay informed about further developments, trends, and reports in the CPE Market, consider subscribing to industry newsletters, following relevant companies and organizations, or regularly checking reputable industry news sources and publications.
Methodology
Step 1 - Identification of Relevant Samples Size from Population Database


Step 2 - Approaches for Defining Global Market Size (Value, Volume* & Price*)

Note*: In applicable scenarios
Step 3 - Data Sources
Primary Research
- Web Analytics
- Survey Reports
- Research Institute
- Latest Research Reports
- Opinion Leaders
Secondary Research
- Annual Reports
- White Paper
- Latest Press Release
- Industry Association
- Paid Database
- Investor Presentations

Step 4 - Data Triangulation
Involves using different sources of information in order to increase the validity of a study
These sources are likely to be stakeholders in a program - participants, other researchers, program staff, other community members, and so on.
Then we put all data in single framework & apply various statistical tools to find out the dynamic on the market.
During the analysis stage, feedback from the stakeholder groups would be compared to determine areas of agreement as well as areas of divergence
