

Key Insights
The commercial robot market is experiencing explosive growth, projected to reach a substantial size driven by technological advancements and increasing adoption across diverse sectors. The 33.65% Compound Annual Growth Rate (CAGR) from 2019 to 2025 indicates a significant upward trajectory, reflecting the rising demand for automation solutions in industries such as healthcare, agriculture, and defense. Key drivers include the decreasing cost of robotics, improved sensor technology enabling greater autonomy and precision, and the increasing need for efficient and cost-effective operations across various business segments. The market segmentation reveals strong growth across all robot types, with drones, field robots, and medical robots leading the charge. The medical and healthcare application segment is particularly lucrative, fueled by the demand for minimally invasive surgeries and robotic-assisted therapies. Agricultural applications are also experiencing rapid growth due to labor shortages and the need for improved crop yields. However, regulatory hurdles related to safety and data privacy, along with high initial investment costs for implementing robotic systems, pose some restraints on market expansion. Despite these challenges, the long-term outlook for the commercial robot market remains overwhelmingly positive, with continued technological innovation and government initiatives poised to further accelerate market penetration.
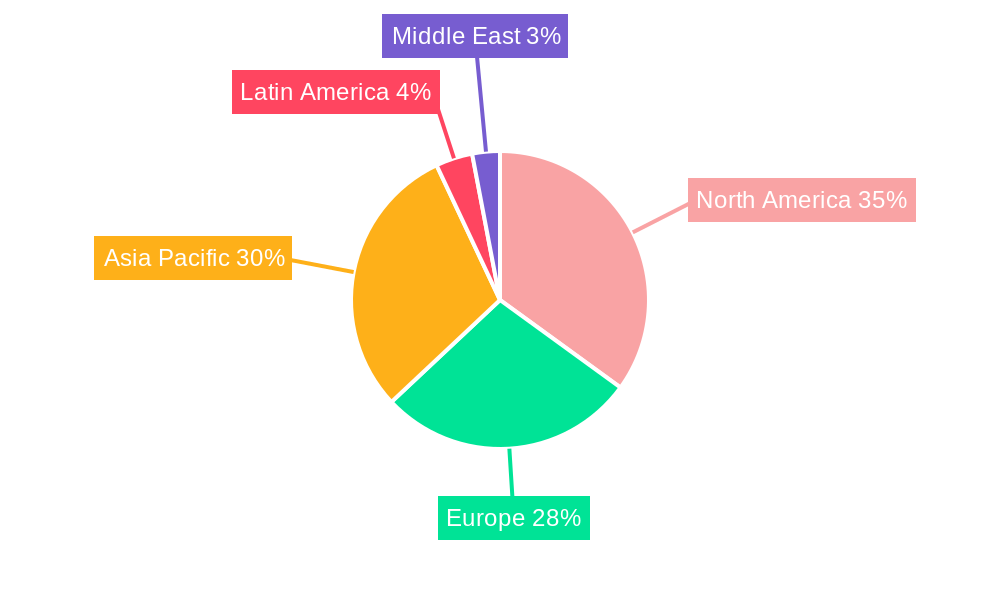
Looking forward to 2033, the market will continue its robust expansion, building upon the foundation laid in the previous years. The increasing sophistication of AI and machine learning algorithms will enable robots to perform more complex tasks, driving demand across new sectors. The integration of robotics into existing infrastructure and processes will be crucial for seamless adoption. Regional variations in growth will exist, with North America and Asia-Pacific anticipated as key market leaders, owing to their advanced technological infrastructure and robust manufacturing sectors. Europe will also contribute significantly, driven by growing industrial automation and government support for technological innovation. Strategic partnerships between robotics companies and end-users will be critical for successful implementation and market penetration. The consistent improvement in robot capabilities, alongside decreasing costs, will ensure this market continues to thrive and become increasingly integral to numerous industries.
Commercial Robot Industry Market Report: 2019-2033
This comprehensive report provides an in-depth analysis of the Commercial Robot Industry, covering market dynamics, leading players, technological advancements, and future growth prospects. With a study period spanning 2019-2033, a base year of 2025, and a forecast period of 2025-2033, this report offers invaluable insights for industry stakeholders, investors, and strategic decision-makers. The global commercial robot market is projected to reach xx Million by 2033, exhibiting a CAGR of xx% during the forecast period.
Commercial Robot Industry Market Dynamics & Concentration
The Commercial Robot Industry is characterized by a dynamic interplay of factors influencing market concentration, innovation, and growth. Market concentration is moderate, with several key players holding significant market share, but also with a healthy number of smaller, specialized companies. The industry is driven by continuous technological advancements in areas such as AI, machine learning, and sensor technologies, leading to improved robot capabilities and functionalities. Regulatory frameworks, while evolving, play a crucial role in shaping market dynamics, particularly concerning safety standards and data privacy. Product substitutes, such as automated systems without robotics, exist, but the advantages of robotic systems in terms of flexibility and adaptability often outweigh the trade-offs. End-user trends are pushing the adoption of commercial robots across various sectors, demanding more efficient, customized solutions. M&A activity in the industry is relatively frequent, reflecting a consolidation of market leadership and access to cutting-edge technologies.
- Market Share: The top 5 players hold approximately xx% of the global market share in 2025.
- M&A Deal Counts: An estimated xx M&A deals were reported in the industry between 2019 and 2024.
- Innovation Drivers: AI, Machine Learning, Sensor Technology, Cloud Computing.
- Regulatory Frameworks: Vary significantly by region, impacting development and deployment.
Commercial Robot Industry Industry Trends & Analysis
The Commercial Robot Industry is experiencing robust growth, driven by several key trends. Increased automation across industries, coupled with labor shortages and the need for enhanced efficiency, is significantly driving market expansion. Technological disruptions, especially the rise of advanced AI and machine learning algorithms, are revolutionizing robot capabilities and applications. Consumer preferences are shifting towards more user-friendly, versatile, and cost-effective robots. Competitive dynamics are intense, with established players and new entrants vying for market share through innovation and strategic partnerships. The market is segmented by robot type (Drones, Field Robots, Medical Robots, Autonomous Guided Robotics, Other Types of Robots) and application (Medical and Healthcare, Defense and Security, Agriculture and Forestry, Marine, Other Applications). The medical and healthcare sector is currently the largest segment, driven by the demand for surgical robots and assistive devices. Market penetration of commercial robots is gradually increasing, particularly in developed economies with advanced infrastructure and industrial automation. The CAGR for the overall market is projected to be xx% during the forecast period (2025-2033).
Leading Markets & Segments in Commercial Robot Industry
The North American market currently holds the largest share of the commercial robot market, driven by robust industrial automation, a favorable regulatory environment, and significant investments in R&D. Within the segments, the Medical Robots and Autonomous Guided Vehicles (AGV) categories are experiencing the most rapid growth.
- Key Drivers in North America: Strong industrial base, favorable regulatory environment, high R&D investment.
- Key Drivers in Europe: Growing focus on automation in manufacturing and healthcare, supportive government initiatives.
- Key Drivers in Asia-Pacific: Rapid industrialization, increasing labor costs, and strong government support for technological advancement.
By Type of Robot: Medical robots are projected to maintain dominance due to their increasing use in minimally invasive surgery and rehabilitation. The field robots segment will also show strong growth, driven by increasing applications in agriculture and logistics.
By Application: The Medical and Healthcare segment is the largest, followed by the Defense and Security segment. Growth in the Agriculture and Forestry segment is expected to accelerate due to the increasing need for automation in these labor-intensive industries.
Commercial Robot Industry Product Developments
Recent product innovations focus on enhanced dexterity, improved sensor integration, and more sophisticated AI algorithms. These advancements lead to greater flexibility, adaptability, and precision in robot operations, expanding their applicability across diverse sectors. Robots with advanced haptic feedback mechanisms are improving human-robot collaboration, while cloud-based connectivity allows for remote monitoring and control. These developments offer significant competitive advantages by optimizing efficiency, reducing costs, and enhancing safety.
Key Drivers of Commercial Robot Industry Growth
Technological advancements, particularly in AI and machine learning, are primary growth drivers. Government incentives and supportive regulations, including tax breaks and funding programs, are also accelerating adoption. The growing need for automation across various industries, driven by labor shortages and the increasing demand for efficient production, further fuels market expansion. Specific examples include the rise of collaborative robots (cobots) for safer human-robot interaction and the increasing use of drones for inspections and deliveries.
Challenges in the Commercial Robot Industry Market
High initial investment costs and complex integration processes pose significant barriers to entry. Supply chain disruptions, particularly concerning key components like sensors and microchips, impact production and delivery timelines. Regulatory compliance and safety standards vary across regions, creating complexities for global deployment. Intense competition and the emergence of new technologies continually challenge the market landscape. The unpredictable nature of global events, such as pandemics and economic downturns, can impact market growth significantly.
Emerging Opportunities in Commercial Robot Industry
Technological breakthroughs, such as the development of more sophisticated AI algorithms and advanced sensors, continue to unlock new applications and markets. Strategic partnerships between technology companies, robotics manufacturers, and end-users are creating synergistic opportunities. The expansion into new markets, such as construction and logistics, offers vast growth potential. The development of more robust and reliable robotic systems capable of operating in challenging environments presents another key opportunity.
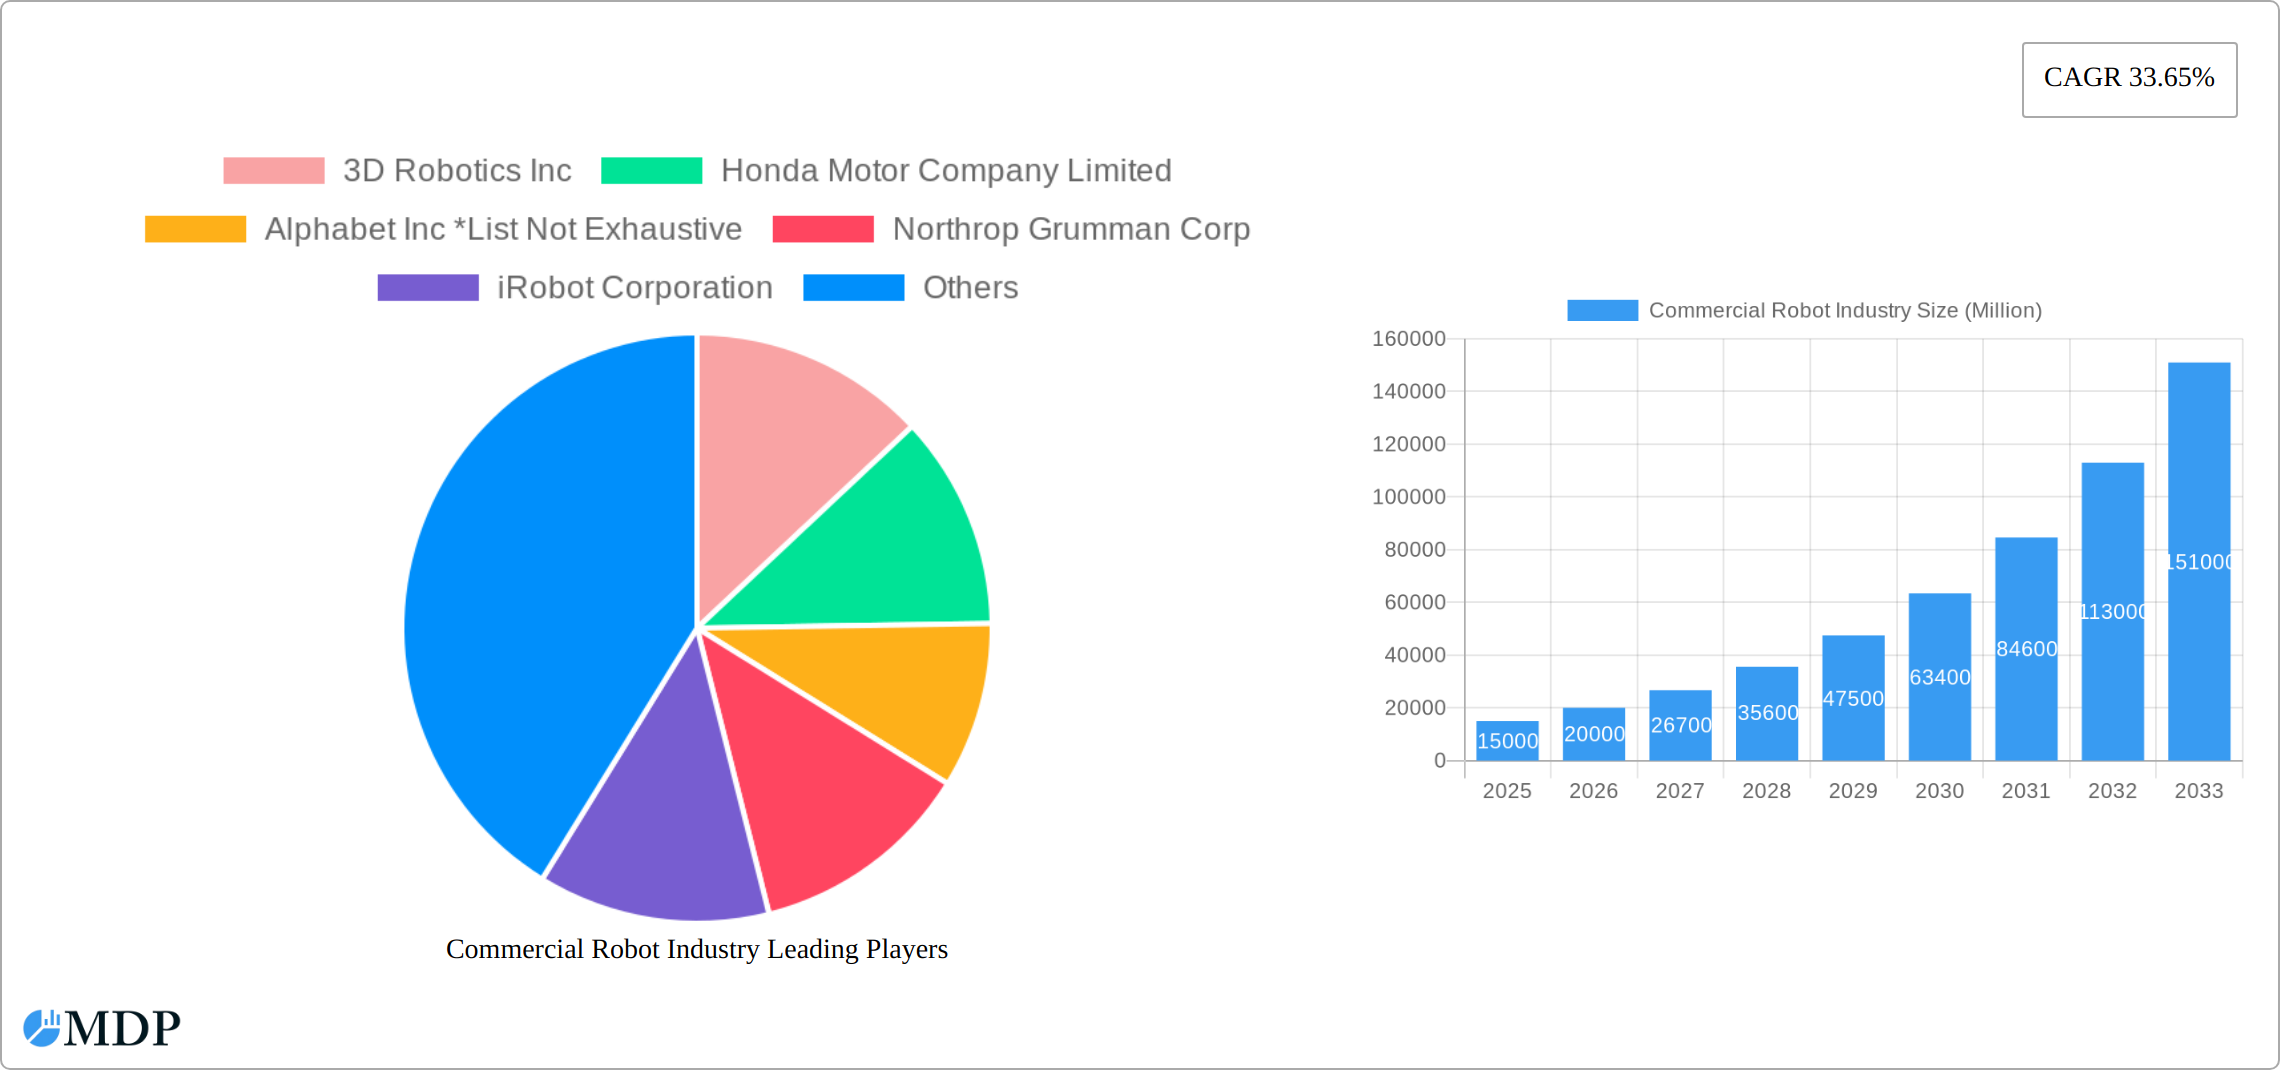
Leading Players in the Commercial Robot Industry Sector
- 3D Robotics Inc
- Honda Motor Company Limited
- Alphabet Inc
- Northrop Grumman Corp
- iRobot Corporation
- Kuka AG
- Omron Adept Technologies Inc
- Yaskawa Electric Corporation
Key Milestones in Commercial Robot Industry Industry
- July 2022: Ganymed Robotics secured EUR 21 Million in Series B funding for its next-generation surgical robot. This highlights growing investor confidence in the medical robotics sector.
- January 2022: LG launched its CLOi service robot in the US, signifying expansion into the service robotics market. This indicates a growing need for automation in various commercial settings.
Strategic Outlook for Commercial Robot Industry Market
The future of the Commercial Robot Industry is bright, with continuous technological advancements and expanding applications driving sustained growth. Strategic partnerships and collaborations will play a vital role in accelerating market expansion. Companies focusing on innovation, affordability, and user-friendliness will be well-positioned to capture significant market share. The increasing adoption of robots in emerging economies will further contribute to the industry's long-term growth trajectory.
Commercial Robot Industry Segmentation
-
1. Type of Robot
- 1.1. Drones
- 1.2. Field Robots
- 1.3. Medical Robots
- 1.4. Autonomous Guided Robotics
- 1.5. Other Types of Robots
-
2. Application
- 2.1. Medical and Healthcare
- 2.2. Defense and Security
- 2.3. Agriculture and Forestry
- 2.4. Marine
- 2.5. Other Applications
Commercial Robot Industry Segmentation By Geography
-
1. North America
- 1.1. United States
- 1.2. Canada
-
2. Europe
- 2.1. United Kingdom
- 2.2. Germany
- 2.3. France
- 2.4. Spain
- 2.5. Rest of Europe
-
3. Asia Pacific
- 3.1. China
- 3.2. India
- 3.3. Japan
- 3.4. Singapore
- 3.5. Australia
- 3.6. Rest of Asia Pacific
-
4. Latin America
- 4.1. Brazil
- 4.2. Mexico
- 4.3. Argentina
- 4.4. Rest of Latin America
- 5. Middle East
-
6. United Arab Emirates
- 6.1. Saudi Arabia
- 6.2. South Africa
- 6.3. Rest of Middle East
Commercial Robot Industry REPORT HIGHLIGHTS
| Aspects | Details |
|---|---|
| Study Period | 2019-2033 |
| Base Year | 2024 |
| Estimated Year | 2025 |
| Forecast Period | 2025-2033 |
| Historical Period | 2019-2024 |
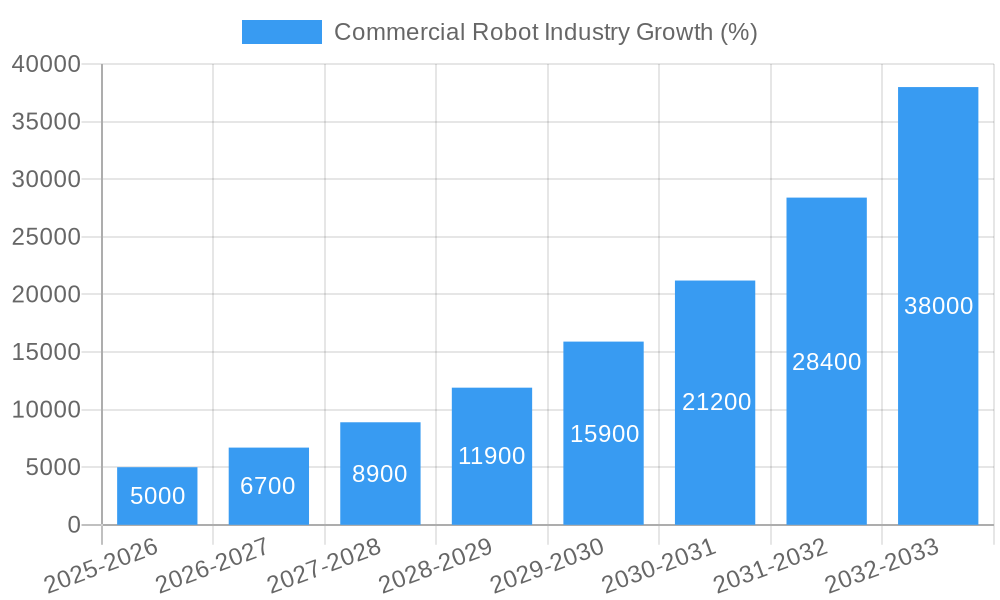
| Growth Rate | CAGR of 33.65% from 2019-2033 |
| Segmentation |
|
Table of Contents
- 1. Introduction
- 1.1. Research Scope
- 1.2. Market Segmentation
- 1.3. Research Methodology
- 1.4. Definitions and Assumptions
- 2. Executive Summary
- 2.1. Introduction
- 3. Market Dynamics
- 3.1. Introduction
- 3.2. Market Drivers
- 3.2.1. Technological Advancements and Convergence of Robotics and Artificial Intelligence; Increasing Government Spending on Defense
- 3.3. Market Restrains
- 3.3.1. Higher Costs of the Robotic Systems
- 3.4. Market Trends
- 3.4.1. Drones in Military and Defense to Present Significant Opportunities for the Commercial Robotics Market
- 4. Market Factor Analysis
- 4.1. Porters Five Forces
- 4.2. Supply/Value Chain
- 4.3. PESTEL analysis
- 4.4. Market Entropy
- 4.5. Patent/Trademark Analysis
- 5. Global Commercial Robot Industry Analysis, Insights and Forecast, 2019-2031
- 5.1. Market Analysis, Insights and Forecast - by Type of Robot
- 5.1.1. Drones
- 5.1.2. Field Robots
- 5.1.3. Medical Robots
- 5.1.4. Autonomous Guided Robotics
- 5.1.5. Other Types of Robots
- 5.2. Market Analysis, Insights and Forecast - by Application
- 5.2.1. Medical and Healthcare
- 5.2.2. Defense and Security
- 5.2.3. Agriculture and Forestry
- 5.2.4. Marine
- 5.2.5. Other Applications
- 5.3. Market Analysis, Insights and Forecast - by Region
- 5.3.1. North America
- 5.3.2. Europe
- 5.3.3. Asia Pacific
- 5.3.4. Latin America
- 5.3.5. Middle East
- 5.3.6. United Arab Emirates
- 5.1. Market Analysis, Insights and Forecast - by Type of Robot
- 6. North America Commercial Robot Industry Analysis, Insights and Forecast, 2019-2031
- 6.1. Market Analysis, Insights and Forecast - by Type of Robot
- 6.1.1. Drones
- 6.1.2. Field Robots
- 6.1.3. Medical Robots
- 6.1.4. Autonomous Guided Robotics
- 6.1.5. Other Types of Robots
- 6.2. Market Analysis, Insights and Forecast - by Application
- 6.2.1. Medical and Healthcare
- 6.2.2. Defense and Security
- 6.2.3. Agriculture and Forestry
- 6.2.4. Marine
- 6.2.5. Other Applications
- 6.1. Market Analysis, Insights and Forecast - by Type of Robot
- 7. Europe Commercial Robot Industry Analysis, Insights and Forecast, 2019-2031
- 7.1. Market Analysis, Insights and Forecast - by Type of Robot
- 7.1.1. Drones
- 7.1.2. Field Robots
- 7.1.3. Medical Robots
- 7.1.4. Autonomous Guided Robotics
- 7.1.5. Other Types of Robots
- 7.2. Market Analysis, Insights and Forecast - by Application
- 7.2.1. Medical and Healthcare
- 7.2.2. Defense and Security
- 7.2.3. Agriculture and Forestry
- 7.2.4. Marine
- 7.2.5. Other Applications
- 7.1. Market Analysis, Insights and Forecast - by Type of Robot
- 8. Asia Pacific Commercial Robot Industry Analysis, Insights and Forecast, 2019-2031
- 8.1. Market Analysis, Insights and Forecast - by Type of Robot
- 8.1.1. Drones
- 8.1.2. Field Robots
- 8.1.3. Medical Robots
- 8.1.4. Autonomous Guided Robotics
- 8.1.5. Other Types of Robots
- 8.2. Market Analysis, Insights and Forecast - by Application
- 8.2.1. Medical and Healthcare
- 8.2.2. Defense and Security
- 8.2.3. Agriculture and Forestry
- 8.2.4. Marine
- 8.2.5. Other Applications
- 8.1. Market Analysis, Insights and Forecast - by Type of Robot
- 9. Latin America Commercial Robot Industry Analysis, Insights and Forecast, 2019-2031
- 9.1. Market Analysis, Insights and Forecast - by Type of Robot
- 9.1.1. Drones
- 9.1.2. Field Robots
- 9.1.3. Medical Robots
- 9.1.4. Autonomous Guided Robotics
- 9.1.5. Other Types of Robots
- 9.2. Market Analysis, Insights and Forecast - by Application
- 9.2.1. Medical and Healthcare
- 9.2.2. Defense and Security
- 9.2.3. Agriculture and Forestry
- 9.2.4. Marine
- 9.2.5. Other Applications
- 9.1. Market Analysis, Insights and Forecast - by Type of Robot
- 10. Middle East Commercial Robot Industry Analysis, Insights and Forecast, 2019-2031
- 10.1. Market Analysis, Insights and Forecast - by Type of Robot
- 10.1.1. Drones
- 10.1.2. Field Robots
- 10.1.3. Medical Robots
- 10.1.4. Autonomous Guided Robotics
- 10.1.5. Other Types of Robots
- 10.2. Market Analysis, Insights and Forecast - by Application
- 10.2.1. Medical and Healthcare
- 10.2.2. Defense and Security
- 10.2.3. Agriculture and Forestry
- 10.2.4. Marine
- 10.2.5. Other Applications
- 10.1. Market Analysis, Insights and Forecast - by Type of Robot
- 11. United Arab Emirates Commercial Robot Industry Analysis, Insights and Forecast, 2019-2031
- 11.1. Market Analysis, Insights and Forecast - by Type of Robot
- 11.1.1. Drones
- 11.1.2. Field Robots
- 11.1.3. Medical Robots
- 11.1.4. Autonomous Guided Robotics
- 11.1.5. Other Types of Robots
- 11.2. Market Analysis, Insights and Forecast - by Application
- 11.2.1. Medical and Healthcare
- 11.2.2. Defense and Security
- 11.2.3. Agriculture and Forestry
- 11.2.4. Marine
- 11.2.5. Other Applications
- 11.1. Market Analysis, Insights and Forecast - by Type of Robot
- 12. North America Commercial Robot Industry Analysis, Insights and Forecast, 2019-2031
- 12.1. Market Analysis, Insights and Forecast - By Country/Sub-region
- 12.1.1 United States
- 12.1.2 Canada
- 13. Europe Commercial Robot Industry Analysis, Insights and Forecast, 2019-2031
- 13.1. Market Analysis, Insights and Forecast - By Country/Sub-region
- 13.1.1 United Kingdom
- 13.1.2 Germany
- 13.1.3 France
- 13.1.4 Spain
- 13.1.5 Rest of Europe
- 14. Asia Pacific Commercial Robot Industry Analysis, Insights and Forecast, 2019-2031
- 14.1. Market Analysis, Insights and Forecast - By Country/Sub-region
- 14.1.1 China
- 14.1.2 India
- 14.1.3 Japan
- 14.1.4 Singapore
- 14.1.5 Australia
- 14.1.6 Rest of Asia Pacific
- 15. Latin America Commercial Robot Industry Analysis, Insights and Forecast, 2019-2031
- 15.1. Market Analysis, Insights and Forecast - By Country/Sub-region
- 15.1.1 Brazil
- 15.1.2 Mexico
- 15.1.3 Argentina
- 15.1.4 Rest of Latin America
- 16. Middle East Commercial Robot Industry Analysis, Insights and Forecast, 2019-2031
- 16.1. Market Analysis, Insights and Forecast - By Country/Sub-region
- 16.1.1.
- 17. United Arab Emirates Commercial Robot Industry Analysis, Insights and Forecast, 2019-2031
- 17.1. Market Analysis, Insights and Forecast - By Country/Sub-region
- 17.1.1 Saudi Arabia
- 17.1.2 South Africa
- 17.1.3 Rest of Middle East
- 18. Competitive Analysis
- 18.1. Global Market Share Analysis 2024
- 18.2. Company Profiles
- 18.2.1 3D Robotics Inc
- 18.2.1.1. Overview
- 18.2.1.2. Products
- 18.2.1.3. SWOT Analysis
- 18.2.1.4. Recent Developments
- 18.2.1.5. Financials (Based on Availability)
- 18.2.2 Honda Motor Company Limited
- 18.2.2.1. Overview
- 18.2.2.2. Products
- 18.2.2.3. SWOT Analysis
- 18.2.2.4. Recent Developments
- 18.2.2.5. Financials (Based on Availability)
- 18.2.3 Alphabet Inc *List Not Exhaustive
- 18.2.3.1. Overview
- 18.2.3.2. Products
- 18.2.3.3. SWOT Analysis
- 18.2.3.4. Recent Developments
- 18.2.3.5. Financials (Based on Availability)
- 18.2.4 Northrop Grumman Corp
- 18.2.4.1. Overview
- 18.2.4.2. Products
- 18.2.4.3. SWOT Analysis
- 18.2.4.4. Recent Developments
- 18.2.4.5. Financials (Based on Availability)
- 18.2.5 iRobot Corporation
- 18.2.5.1. Overview
- 18.2.5.2. Products
- 18.2.5.3. SWOT Analysis
- 18.2.5.4. Recent Developments
- 18.2.5.5. Financials (Based on Availability)
- 18.2.6 Kuka AG
- 18.2.6.1. Overview
- 18.2.6.2. Products
- 18.2.6.3. SWOT Analysis
- 18.2.6.4. Recent Developments
- 18.2.6.5. Financials (Based on Availability)
- 18.2.7 Omron Adept Technologies Inc
- 18.2.7.1. Overview
- 18.2.7.2. Products
- 18.2.7.3. SWOT Analysis
- 18.2.7.4. Recent Developments
- 18.2.7.5. Financials (Based on Availability)
- 18.2.8 Yaskawa Electric Corporation
- 18.2.8.1. Overview
- 18.2.8.2. Products
- 18.2.8.3. SWOT Analysis
- 18.2.8.4. Recent Developments
- 18.2.8.5. Financials (Based on Availability)
- 18.2.1 3D Robotics Inc
List of Figures
- Figure 1: Global Commercial Robot Industry Revenue Breakdown (Million, %) by Region 2024 & 2032
- Figure 2: North America Commercial Robot Industry Revenue (Million), by Country 2024 & 2032
- Figure 3: North America Commercial Robot Industry Revenue Share (%), by Country 2024 & 2032
- Figure 4: Europe Commercial Robot Industry Revenue (Million), by Country 2024 & 2032
- Figure 5: Europe Commercial Robot Industry Revenue Share (%), by Country 2024 & 2032
- Figure 6: Asia Pacific Commercial Robot Industry Revenue (Million), by Country 2024 & 2032
- Figure 7: Asia Pacific Commercial Robot Industry Revenue Share (%), by Country 2024 & 2032
- Figure 8: Latin America Commercial Robot Industry Revenue (Million), by Country 2024 & 2032
- Figure 9: Latin America Commercial Robot Industry Revenue Share (%), by Country 2024 & 2032
- Figure 10: Middle East Commercial Robot Industry Revenue (Million), by Country 2024 & 2032
- Figure 11: Middle East Commercial Robot Industry Revenue Share (%), by Country 2024 & 2032
- Figure 12: United Arab Emirates Commercial Robot Industry Revenue (Million), by Country 2024 & 2032
- Figure 13: United Arab Emirates Commercial Robot Industry Revenue Share (%), by Country 2024 & 2032
- Figure 14: North America Commercial Robot Industry Revenue (Million), by Type of Robot 2024 & 2032
- Figure 15: North America Commercial Robot Industry Revenue Share (%), by Type of Robot 2024 & 2032
- Figure 16: North America Commercial Robot Industry Revenue (Million), by Application 2024 & 2032
- Figure 17: North America Commercial Robot Industry Revenue Share (%), by Application 2024 & 2032
- Figure 18: North America Commercial Robot Industry Revenue (Million), by Country 2024 & 2032
- Figure 19: North America Commercial Robot Industry Revenue Share (%), by Country 2024 & 2032
- Figure 20: Europe Commercial Robot Industry Revenue (Million), by Type of Robot 2024 & 2032
- Figure 21: Europe Commercial Robot Industry Revenue Share (%), by Type of Robot 2024 & 2032
- Figure 22: Europe Commercial Robot Industry Revenue (Million), by Application 2024 & 2032
- Figure 23: Europe Commercial Robot Industry Revenue Share (%), by Application 2024 & 2032
- Figure 24: Europe Commercial Robot Industry Revenue (Million), by Country 2024 & 2032
- Figure 25: Europe Commercial Robot Industry Revenue Share (%), by Country 2024 & 2032
- Figure 26: Asia Pacific Commercial Robot Industry Revenue (Million), by Type of Robot 2024 & 2032
- Figure 27: Asia Pacific Commercial Robot Industry Revenue Share (%), by Type of Robot 2024 & 2032
- Figure 28: Asia Pacific Commercial Robot Industry Revenue (Million), by Application 2024 & 2032
- Figure 29: Asia Pacific Commercial Robot Industry Revenue Share (%), by Application 2024 & 2032
- Figure 30: Asia Pacific Commercial Robot Industry Revenue (Million), by Country 2024 & 2032
- Figure 31: Asia Pacific Commercial Robot Industry Revenue Share (%), by Country 2024 & 2032
- Figure 32: Latin America Commercial Robot Industry Revenue (Million), by Type of Robot 2024 & 2032
- Figure 33: Latin America Commercial Robot Industry Revenue Share (%), by Type of Robot 2024 & 2032
- Figure 34: Latin America Commercial Robot Industry Revenue (Million), by Application 2024 & 2032
- Figure 35: Latin America Commercial Robot Industry Revenue Share (%), by Application 2024 & 2032
- Figure 36: Latin America Commercial Robot Industry Revenue (Million), by Country 2024 & 2032
- Figure 37: Latin America Commercial Robot Industry Revenue Share (%), by Country 2024 & 2032
- Figure 38: Middle East Commercial Robot Industry Revenue (Million), by Type of Robot 2024 & 2032
- Figure 39: Middle East Commercial Robot Industry Revenue Share (%), by Type of Robot 2024 & 2032
- Figure 40: Middle East Commercial Robot Industry Revenue (Million), by Application 2024 & 2032
- Figure 41: Middle East Commercial Robot Industry Revenue Share (%), by Application 2024 & 2032
- Figure 42: Middle East Commercial Robot Industry Revenue (Million), by Country 2024 & 2032
- Figure 43: Middle East Commercial Robot Industry Revenue Share (%), by Country 2024 & 2032
- Figure 44: United Arab Emirates Commercial Robot Industry Revenue (Million), by Type of Robot 2024 & 2032
- Figure 45: United Arab Emirates Commercial Robot Industry Revenue Share (%), by Type of Robot 2024 & 2032
- Figure 46: United Arab Emirates Commercial Robot Industry Revenue (Million), by Application 2024 & 2032
- Figure 47: United Arab Emirates Commercial Robot Industry Revenue Share (%), by Application 2024 & 2032
- Figure 48: United Arab Emirates Commercial Robot Industry Revenue (Million), by Country 2024 & 2032
- Figure 49: United Arab Emirates Commercial Robot Industry Revenue Share (%), by Country 2024 & 2032
List of Tables
- Table 1: Global Commercial Robot Industry Revenue Million Forecast, by Region 2019 & 2032
- Table 2: Global Commercial Robot Industry Revenue Million Forecast, by Type of Robot 2019 & 2032
- Table 3: Global Commercial Robot Industry Revenue Million Forecast, by Application 2019 & 2032
- Table 4: Global Commercial Robot Industry Revenue Million Forecast, by Region 2019 & 2032
- Table 5: Global Commercial Robot Industry Revenue Million Forecast, by Country 2019 & 2032
- Table 6: United States Commercial Robot Industry Revenue (Million) Forecast, by Application 2019 & 2032
- Table 7: Canada Commercial Robot Industry Revenue (Million) Forecast, by Application 2019 & 2032
- Table 8: Global Commercial Robot Industry Revenue Million Forecast, by Country 2019 & 2032
- Table 9: United Kingdom Commercial Robot Industry Revenue (Million) Forecast, by Application 2019 & 2032
- Table 10: Germany Commercial Robot Industry Revenue (Million) Forecast, by Application 2019 & 2032
- Table 11: France Commercial Robot Industry Revenue (Million) Forecast, by Application 2019 & 2032
- Table 12: Spain Commercial Robot Industry Revenue (Million) Forecast, by Application 2019 & 2032
- Table 13: Rest of Europe Commercial Robot Industry Revenue (Million) Forecast, by Application 2019 & 2032
- Table 14: Global Commercial Robot Industry Revenue Million Forecast, by Country 2019 & 2032
- Table 15: China Commercial Robot Industry Revenue (Million) Forecast, by Application 2019 & 2032
- Table 16: India Commercial Robot Industry Revenue (Million) Forecast, by Application 2019 & 2032
- Table 17: Japan Commercial Robot Industry Revenue (Million) Forecast, by Application 2019 & 2032
- Table 18: Singapore Commercial Robot Industry Revenue (Million) Forecast, by Application 2019 & 2032
- Table 19: Australia Commercial Robot Industry Revenue (Million) Forecast, by Application 2019 & 2032
- Table 20: Rest of Asia Pacific Commercial Robot Industry Revenue (Million) Forecast, by Application 2019 & 2032
- Table 21: Global Commercial Robot Industry Revenue Million Forecast, by Country 2019 & 2032
- Table 22: Brazil Commercial Robot Industry Revenue (Million) Forecast, by Application 2019 & 2032
- Table 23: Mexico Commercial Robot Industry Revenue (Million) Forecast, by Application 2019 & 2032
- Table 24: Argentina Commercial Robot Industry Revenue (Million) Forecast, by Application 2019 & 2032
- Table 25: Rest of Latin America Commercial Robot Industry Revenue (Million) Forecast, by Application 2019 & 2032
- Table 26: Global Commercial Robot Industry Revenue Million Forecast, by Country 2019 & 2032
- Table 27: Commercial Robot Industry Revenue (Million) Forecast, by Application 2019 & 2032
- Table 28: Global Commercial Robot Industry Revenue Million Forecast, by Country 2019 & 2032
- Table 29: Saudi Arabia Commercial Robot Industry Revenue (Million) Forecast, by Application 2019 & 2032
- Table 30: South Africa Commercial Robot Industry Revenue (Million) Forecast, by Application 2019 & 2032
- Table 31: Rest of Middle East Commercial Robot Industry Revenue (Million) Forecast, by Application 2019 & 2032
- Table 32: Global Commercial Robot Industry Revenue Million Forecast, by Type of Robot 2019 & 2032
- Table 33: Global Commercial Robot Industry Revenue Million Forecast, by Application 2019 & 2032
- Table 34: Global Commercial Robot Industry Revenue Million Forecast, by Country 2019 & 2032
- Table 35: United States Commercial Robot Industry Revenue (Million) Forecast, by Application 2019 & 2032
- Table 36: Canada Commercial Robot Industry Revenue (Million) Forecast, by Application 2019 & 2032
- Table 37: Global Commercial Robot Industry Revenue Million Forecast, by Type of Robot 2019 & 2032
- Table 38: Global Commercial Robot Industry Revenue Million Forecast, by Application 2019 & 2032
- Table 39: Global Commercial Robot Industry Revenue Million Forecast, by Country 2019 & 2032
- Table 40: United Kingdom Commercial Robot Industry Revenue (Million) Forecast, by Application 2019 & 2032
- Table 41: Germany Commercial Robot Industry Revenue (Million) Forecast, by Application 2019 & 2032
- Table 42: France Commercial Robot Industry Revenue (Million) Forecast, by Application 2019 & 2032
- Table 43: Spain Commercial Robot Industry Revenue (Million) Forecast, by Application 2019 & 2032
- Table 44: Rest of Europe Commercial Robot Industry Revenue (Million) Forecast, by Application 2019 & 2032
- Table 45: Global Commercial Robot Industry Revenue Million Forecast, by Type of Robot 2019 & 2032
- Table 46: Global Commercial Robot Industry Revenue Million Forecast, by Application 2019 & 2032
- Table 47: Global Commercial Robot Industry Revenue Million Forecast, by Country 2019 & 2032
- Table 48: China Commercial Robot Industry Revenue (Million) Forecast, by Application 2019 & 2032
- Table 49: India Commercial Robot Industry Revenue (Million) Forecast, by Application 2019 & 2032
- Table 50: Japan Commercial Robot Industry Revenue (Million) Forecast, by Application 2019 & 2032
- Table 51: Singapore Commercial Robot Industry Revenue (Million) Forecast, by Application 2019 & 2032
- Table 52: Australia Commercial Robot Industry Revenue (Million) Forecast, by Application 2019 & 2032
- Table 53: Rest of Asia Pacific Commercial Robot Industry Revenue (Million) Forecast, by Application 2019 & 2032
- Table 54: Global Commercial Robot Industry Revenue Million Forecast, by Type of Robot 2019 & 2032
- Table 55: Global Commercial Robot Industry Revenue Million Forecast, by Application 2019 & 2032
- Table 56: Global Commercial Robot Industry Revenue Million Forecast, by Country 2019 & 2032
- Table 57: Brazil Commercial Robot Industry Revenue (Million) Forecast, by Application 2019 & 2032
- Table 58: Mexico Commercial Robot Industry Revenue (Million) Forecast, by Application 2019 & 2032
- Table 59: Argentina Commercial Robot Industry Revenue (Million) Forecast, by Application 2019 & 2032
- Table 60: Rest of Latin America Commercial Robot Industry Revenue (Million) Forecast, by Application 2019 & 2032
- Table 61: Global Commercial Robot Industry Revenue Million Forecast, by Type of Robot 2019 & 2032
- Table 62: Global Commercial Robot Industry Revenue Million Forecast, by Application 2019 & 2032
- Table 63: Global Commercial Robot Industry Revenue Million Forecast, by Country 2019 & 2032
- Table 64: Global Commercial Robot Industry Revenue Million Forecast, by Type of Robot 2019 & 2032
- Table 65: Global Commercial Robot Industry Revenue Million Forecast, by Application 2019 & 2032
- Table 66: Global Commercial Robot Industry Revenue Million Forecast, by Country 2019 & 2032
- Table 67: Saudi Arabia Commercial Robot Industry Revenue (Million) Forecast, by Application 2019 & 2032
- Table 68: South Africa Commercial Robot Industry Revenue (Million) Forecast, by Application 2019 & 2032
- Table 69: Rest of Middle East Commercial Robot Industry Revenue (Million) Forecast, by Application 2019 & 2032
Frequently Asked Questions
1. What is the projected Compound Annual Growth Rate (CAGR) of the Commercial Robot Industry?
The projected CAGR is approximately 33.65%.
2. Which companies are prominent players in the Commercial Robot Industry?
Key companies in the market include 3D Robotics Inc, Honda Motor Company Limited, Alphabet Inc *List Not Exhaustive, Northrop Grumman Corp, iRobot Corporation, Kuka AG, Omron Adept Technologies Inc, Yaskawa Electric Corporation.
3. What are the main segments of the Commercial Robot Industry?
The market segments include Type of Robot, Application.
4. Can you provide details about the market size?
The market size is estimated to be USD XX Million as of 2022.
5. What are some drivers contributing to market growth?
Technological Advancements and Convergence of Robotics and Artificial Intelligence; Increasing Government Spending on Defense.
6. What are the notable trends driving market growth?
Drones in Military and Defense to Present Significant Opportunities for the Commercial Robotics Market.
7. Are there any restraints impacting market growth?
Higher Costs of the Robotic Systems.
8. Can you provide examples of recent developments in the market?
July 2022 - Ganymed Robotics announced that the company had received funding of EUR 21 million in the series B funding round to complete the development of its next-generation surgical robot and prepare for a commercial launch.
9. What pricing options are available for accessing the report?
Pricing options include single-user, multi-user, and enterprise licenses priced at USD 4750, USD 5250, and USD 8750 respectively.
10. Is the market size provided in terms of value or volume?
The market size is provided in terms of value, measured in Million.
11. Are there any specific market keywords associated with the report?
Yes, the market keyword associated with the report is "Commercial Robot Industry," which aids in identifying and referencing the specific market segment covered.
12. How do I determine which pricing option suits my needs best?
The pricing options vary based on user requirements and access needs. Individual users may opt for single-user licenses, while businesses requiring broader access may choose multi-user or enterprise licenses for cost-effective access to the report.
13. Are there any additional resources or data provided in the Commercial Robot Industry report?
While the report offers comprehensive insights, it's advisable to review the specific contents or supplementary materials provided to ascertain if additional resources or data are available.
14. How can I stay updated on further developments or reports in the Commercial Robot Industry?
To stay informed about further developments, trends, and reports in the Commercial Robot Industry, consider subscribing to industry newsletters, following relevant companies and organizations, or regularly checking reputable industry news sources and publications.
Methodology
Step 1 - Identification of Relevant Samples Size from Population Database


Step 2 - Approaches for Defining Global Market Size (Value, Volume* & Price*)

Note*: In applicable scenarios
Step 3 - Data Sources
Primary Research
- Web Analytics
- Survey Reports
- Research Institute
- Latest Research Reports
- Opinion Leaders
Secondary Research
- Annual Reports
- White Paper
- Latest Press Release
- Industry Association
- Paid Database
- Investor Presentations

Step 4 - Data Triangulation
Involves using different sources of information in order to increase the validity of a study
These sources are likely to be stakeholders in a program - participants, other researchers, program staff, other community members, and so on.
Then we put all data in single framework & apply various statistical tools to find out the dynamic on the market.
During the analysis stage, feedback from the stakeholder groups would be compared to determine areas of agreement as well as areas of divergence
