

Key Insights
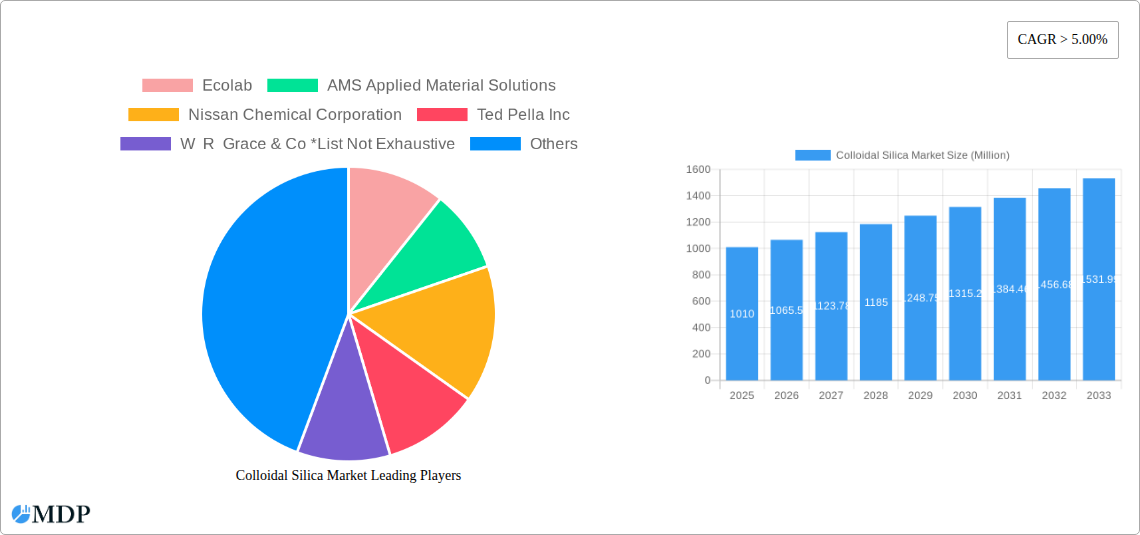
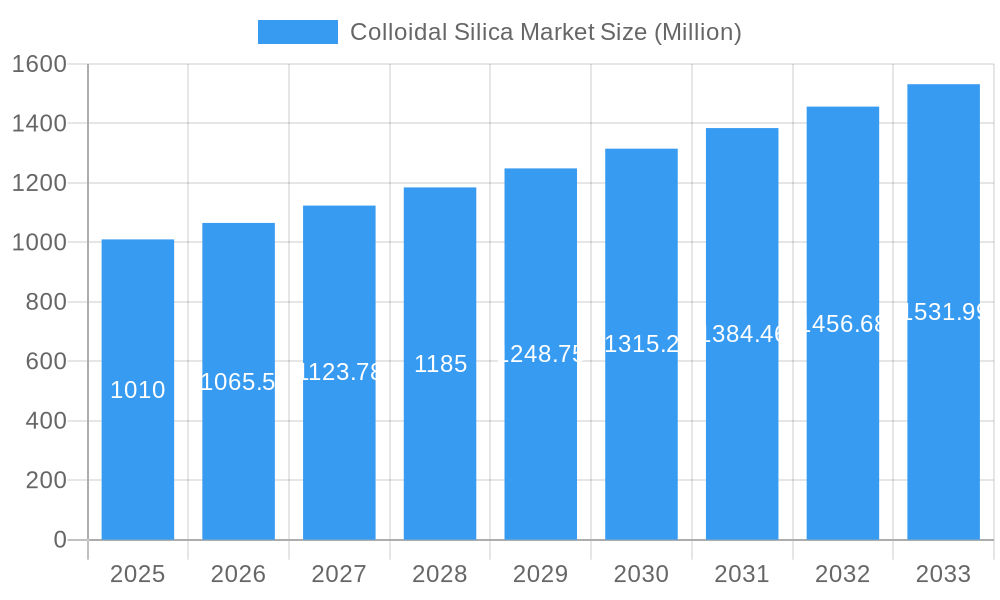
The colloidal silica market, valued at approximately $1.01 billion in 2025, is projected to experience robust growth with a compound annual growth rate (CAGR) exceeding 5% from 2025 to 2033. This expansion is driven by increasing demand across diverse end-user industries. The pulp and paper industry relies heavily on colloidal silica for enhanced paper strength and coating properties. Simultaneously, the paints and coatings sector utilizes it as a rheological additive and matting agent, contributing significantly to market growth. The chemical industry employs colloidal silica in various applications, including catalysts and silica gels, further boosting market demand. Growth is also fueled by expanding construction activities, where colloidal silica serves as a binder and additive in concrete and other building materials. The electronics and semiconductor industries leverage its properties in polishing and other high-precision applications. While specific restraints are not detailed, potential challenges could include fluctuations in raw material prices, stringent environmental regulations, and the emergence of alternative materials. However, ongoing innovation and the development of new applications are expected to offset these challenges, ensuring sustained market expansion throughout the forecast period. Regional variations in market growth are anticipated, with Asia Pacific likely leading due to its substantial industrial base and rapid economic development. North America and Europe will also contribute significantly to the overall market size, driven by established industries and technological advancements.
Colloidal Silica Market Market Size (In Billion)
The competitive landscape is marked by the presence of several key players, including Ecolab, AMS Applied Material Solutions, Nissan Chemical Corporation, and others. These companies are investing in research and development to enhance product quality, expand applications, and cater to the evolving needs of different end-user sectors. Strategic collaborations, mergers, and acquisitions are also expected to shape the competitive dynamics within the market. The ongoing development of novel applications in emerging industries, coupled with improvements in colloidal silica production processes, will further fuel market growth and encourage the entry of new players. The market segmentation analysis points towards a diverse range of applications driving the steady growth, ensuring a strong outlook for colloidal silica producers.
Colloidal Silica Market Company Market Share
Deep Dive into the Colloidal Silica Market: A Comprehensive Report (2019-2033)
This comprehensive report provides an in-depth analysis of the Colloidal Silica market, offering invaluable insights for industry stakeholders, investors, and strategic decision-makers. Covering the period from 2019 to 2033, with a base year of 2025, this report meticulously examines market dynamics, industry trends, leading players, and future growth prospects. The report projects a market valuation of xx Million by 2033, exhibiting a robust CAGR of xx% during the forecast period (2025-2033).
Colloidal Silica Market Market Dynamics & Concentration
The Colloidal Silica market exhibits a dynamic and moderately concentrated competitive landscape, characterized by the presence of several influential key players who collectively hold a substantial portion of the market share. The top 5 companies are estimated to command approximately XX% of the market, with the remaining share being fragmented among a diverse array of smaller, specialized manufacturers. A primary catalyst for market evolution is continuous innovation. Companies are actively engaged in the research and development of novel formulations and expanded applications, meticulously designed to address the increasingly sophisticated and evolving needs of end-users across various industries. Furthermore, stringent regulatory frameworks, particularly those pertaining to environmental sustainability and product safety, exert a significant influence on market dynamics, shaping operational strategies and product development trajectories. The market also faces competitive pressure from substitute products, such as alternative rheological additives, compelling manufacturers to prioritize continuous product differentiation and value enhancement. Industry consolidation is a recurring theme, marked by periodic mergers and acquisitions (M&A) activities. An estimated XX M&A deals have been observed within the period spanning from 2019 to 2024, reflecting strategic moves to enhance market reach, technological capabilities, and product portfolios. Underlying these trends is the overarching influence of end-user demands, with a pronounced surge in the requirement for sustainable, eco-friendly, and high-performance materials across a broad spectrum of sectors, serving as a robust engine for market growth.
- Market Concentration: The top 5 key players collectively hold approximately XX% of the global market share.
- Innovation Drivers: Continuous investment in the development of advanced formulations and the exploration of new application areas are pivotal for market expansion.
- Regulatory Frameworks: Adherence to increasingly stringent environmental protection standards and product safety regulations is a critical factor for market players.
- Product Substitutes: The competitive landscape is shaped by the availability and performance of alternative rheological additives.
- M&A Activity: The market has witnessed significant consolidation, with an estimated XX M&A deals occurring between 2019 and 2024.
- End-User Trends: A growing preference for sustainable, eco-conscious, and high-performance materials is a key driver for market growth across diverse industries.
Colloidal Silica Market Industry Trends & Analysis
The Colloidal Silica market exhibits significant growth potential, driven by factors such as increasing demand from key end-use industries, technological advancements leading to improved product performance, and favorable government policies in certain regions. The market penetration of colloidal silica in various applications is steadily increasing, with a projected penetration rate of xx% by 2033. Technological disruptions, such as the development of novel synthesis methods and improved dispersion technologies, are enhancing product quality and expanding applications. Consumer preference for eco-friendly and sustainable products is influencing market demand. Competitive dynamics are characterized by both price competition and product differentiation strategies.
Leading Markets & Segments in Colloidal Silica Market
The Paints and Coatings segment currently stands as the dominant force within the Colloidal Silica market, projected to account for approximately XX% of the total market value by 2025. This leadership is largely attributed to the robust expansion of the global construction industry and the escalating demand for coatings that offer superior performance characteristics, such as enhanced durability, improved adhesion, and aesthetic appeal. The broader Construction sector, a cornerstone end-user industry, is anticipated to experience substantial growth, propelled by significant investments in infrastructure development projects worldwide. Geographically, the Asia-Pacific region is poised to emerge as the leading market for colloidal silica. This preeminence is a direct consequence of rapid industrialization, burgeoning urbanization, and increasing consumer spending power in developing economies within this region.
- Paints and Coatings: This segment leads the market, driven by the strong performance of the construction industry and the continuous demand for advanced, high-performance coating solutions.
- Construction: The construction sector is a significant growth engine, fueled by large-scale infrastructure development initiatives and rapid urbanization trends globally.
- Asia-Pacific Region: This region is projected to be the largest market for colloidal silica, owing to accelerated industrial growth and increasing urbanization.
- Key Drivers: Supportive government policies promoting infrastructure development, rising disposable incomes, and the burgeoning urban populations in emerging economies are critical growth catalysts.
Colloidal Silica Market Product Developments
Recent product developments focus on improving the colloidal silica's rheological properties, enhancing its stability, and expanding its applications. Innovations include the development of novel surface treatments for improved dispersibility and enhanced performance in specific applications. These advancements cater to the growing demand for high-performance materials across various industries. The development of more sustainable and environmentally friendly production methods is also a significant focus area.
Key Drivers of Colloidal Silica Market Growth
The growth of the Colloidal Silica market is primarily propelled by several factors. The booming construction industry, particularly in developing economies, fuels high demand. Technological advancements in manufacturing processes lead to cost reductions and improved product quality. Favorable government policies and regulations encouraging the use of sustainable materials in various industries further contribute to market expansion.
Challenges in the Colloidal Silica Market Market
The Colloidal Silica market, while promising, is not without its hurdles. One of the primary challenges faced by manufacturers is the volatility of raw material prices. Fluctuations in the cost of essential raw materials can directly impact production costs, thereby affecting profit margins and pricing strategies. Furthermore, supply chain disruptions, whether due to geopolitical events, logistical complexities, or unforeseen circumstances, can lead to production delays, stockouts, and ultimately, an inability to meet customer demand. The market is also characterized by intense competition, not only from established players but also from emerging companies entering the market. This necessitates a relentless focus on innovation, cost optimization, and efficient operational management to maintain a competitive edge. Moreover, the increasing stringency of environmental regulations across various regions can impose additional compliance costs on manufacturers, requiring investments in cleaner production technologies and waste management solutions.
Emerging Opportunities in Colloidal Silica Market
The Colloidal Silica market presents numerous opportunities for growth. Technological breakthroughs, such as advancements in nanotechnology and material science, are expected to lead to the development of novel applications. Strategic partnerships between manufacturers and end-users can drive innovation and market penetration. Market expansion into new geographical regions, particularly in developing economies, offers significant potential for growth.
Leading Players in the Colloidal Silica Market Sector
- Ecolab Inc.
- AMS Applied Material Solutions
- Nissan Chemical Corporation
- Ted Pella, Inc.
- W R Grace & Co.
- Cabot Corporation
- Nyacol Nanomaterials
- FUSO CHEMICAL CO LTD
- Nouryan
- CWK Chemiewerk Bad Kstritz GmbH
- Linyi Kehan Silicon Products Co., LTD.
- Sterling Chemicals
- Jinan Yinfeng Silicon Products Co., Ltd.
- Akasel
- Evonik Industries AG
Key Milestones in Colloidal Silica Market Industry
- June 2020: W. R. Grace & Co. opened a new colloidal silica plant in Germany, enhancing its presence in EMEA.
- November 2021: Nouryon announced an increase in production capacity at its Green Bay facility, targeting packaging and construction markets. Completion expected in the second half of 2022.
Strategic Outlook for Colloidal Silica Market Market
The Colloidal Silica market is on a trajectory for robust and sustained growth in the foreseeable future. This optimistic outlook is underpinned by a confluence of factors, including the escalating demand from a diverse array of end-use industries, continuous technological advancements that unlock new applications and enhance product performance, and favorable economic conditions prevalent in key global regions. Companies that strategically prioritize and invest in product innovation, foster strong strategic partnerships, and meticulously optimize their supply chain management are best positioned to gain a significant competitive advantage. Moreover, the exploration and penetration of new and emerging markets represent substantial opportunities for market share expansion and long-term sustainable growth. The industry is likely to witness further development in specialized colloidal silica grades tailored for niche applications and an increased focus on sustainable manufacturing processes.
Colloidal Silica Market Segmentation
-
1. End-user Industry
- 1.1. Pulp and Paper
- 1.2. Paints and Coatings
- 1.3. Chemicals
- 1.4. Construction
- 1.5. Metals and Metallurgy
- 1.6. Electronics and Semiconductors
- 1.7. Other End-user Industries
Colloidal Silica Market Segmentation By Geography
-
1. Asia Pacific
- 1.1. China
- 1.2. India
- 1.3. Japan
- 1.4. South Korea
- 1.5. Rest of Asia Pacific
-
2. North America
- 2.1. United States
- 2.2. Canada
- 2.3. Mexico
-
3. Europe
- 3.1. Germany
- 3.2. United Kingdom
- 3.3. Italy
- 3.4. France
- 3.5. Rest of Europe
-
4. South America
- 4.1. Brazil
- 4.2. Argentina
- 4.3. Rest of South America
-
5. Middle East and Africa
- 5.1. Saudi Arabia
- 5.2. South Africa
- 5.3. Rest of Middle East and Africa
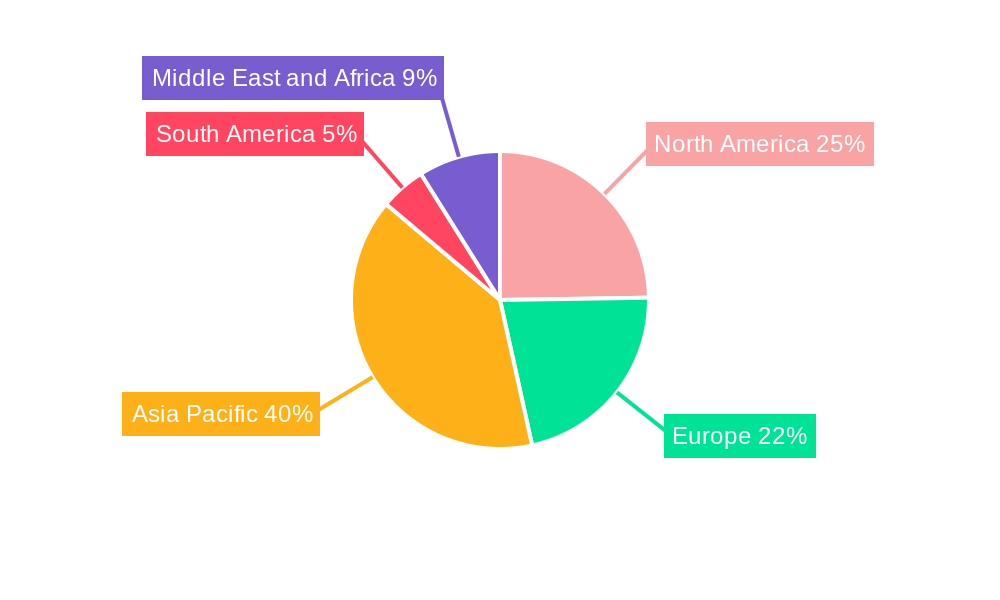
Colloidal Silica Market Regional Market Share
Geographic Coverage of Colloidal Silica Market
Colloidal Silica Market REPORT HIGHLIGHTS
| Aspects | Details |
|---|---|
| Study Period | 2020-2034 |
| Base Year | 2025 |
| Estimated Year | 2026 |
| Forecast Period | 2026-2034 |
| Historical Period | 2020-2025 |
| Growth Rate | CAGR of > 5.00% from 2020-2034 |
| Segmentation |
|
Table of Contents
- 1. Introduction
- 1.1. Research Scope
- 1.2. Market Segmentation
- 1.3. Research Objective
- 1.4. Definitions and Assumptions
- 2. Executive Summary
- 2.1. Market Snapshot
- 3. Market Dynamics
- 3.1. Market Drivers
- 3.2. Market Restrains
- 3.3. Market Trends
- 3.4. Market Opportunities
- 4. Market Factor Analysis
- 4.1. Porters Five Forces
- 4.1.1. Bargaining Power of Suppliers
- 4.1.2. Bargaining Power of Buyers
- 4.1.3. Threat of New Entrants
- 4.1.4. Threat of Substitutes
- 4.1.5. Competitive Rivalry
- 4.2. PESTEL analysis
- 4.3. BCG Analysis
- 4.3.1. Stars (High Growth, High Market Share)
- 4.3.2. Cash Cows (Low Growth, High Market Share)
- 4.3.3. Question Mark (High Growth, Low Market Share)
- 4.3.4. Dogs (Low Growth, Low Market Share)
- 4.4. Ansoff Matrix Analysis
- 4.5. Supply Chain Analysis
- 4.6. Regulatory Landscape
- 4.7. Current Market Potential and Opportunity Assessment (TAM–SAM–SOM Framework)
- 4.8. MDP Analyst Note
- 4.1. Porters Five Forces
- 5. Market Analysis, Insights and Forecast 2021-2033
- 5.1. Market Analysis, Insights and Forecast - by End-user Industry
- 5.1.1. Pulp and Paper
- 5.1.2. Paints and Coatings
- 5.1.3. Chemicals
- 5.1.4. Construction
- 5.1.5. Metals and Metallurgy
- 5.1.6. Electronics and Semiconductors
- 5.1.7. Other End-user Industries
- 5.2. Market Analysis, Insights and Forecast - by Region
- 5.2.1. Asia Pacific
- 5.2.2. North America
- 5.2.3. Europe
- 5.2.4. South America
- 5.2.5. Middle East and Africa
- 5.1. Market Analysis, Insights and Forecast - by End-user Industry
- 6. Global Colloidal Silica Market Analysis, Insights and Forecast, 2021-2033
- 6.1. Market Analysis, Insights and Forecast - by End-user Industry
- 6.1.1. Pulp and Paper
- 6.1.2. Paints and Coatings
- 6.1.3. Chemicals
- 6.1.4. Construction
- 6.1.5. Metals and Metallurgy
- 6.1.6. Electronics and Semiconductors
- 6.1.7. Other End-user Industries
- 6.1. Market Analysis, Insights and Forecast - by End-user Industry
- 7. Asia Pacific Colloidal Silica Market Analysis, Insights and Forecast, 2020-2032
- 7.1. Market Analysis, Insights and Forecast - by End-user Industry
- 7.1.1. Pulp and Paper
- 7.1.2. Paints and Coatings
- 7.1.3. Chemicals
- 7.1.4. Construction
- 7.1.5. Metals and Metallurgy
- 7.1.6. Electronics and Semiconductors
- 7.1.7. Other End-user Industries
- 7.1. Market Analysis, Insights and Forecast - by End-user Industry
- 8. North America Colloidal Silica Market Analysis, Insights and Forecast, 2020-2032
- 8.1. Market Analysis, Insights and Forecast - by End-user Industry
- 8.1.1. Pulp and Paper
- 8.1.2. Paints and Coatings
- 8.1.3. Chemicals
- 8.1.4. Construction
- 8.1.5. Metals and Metallurgy
- 8.1.6. Electronics and Semiconductors
- 8.1.7. Other End-user Industries
- 8.1. Market Analysis, Insights and Forecast - by End-user Industry
- 9. Europe Colloidal Silica Market Analysis, Insights and Forecast, 2020-2032
- 9.1. Market Analysis, Insights and Forecast - by End-user Industry
- 9.1.1. Pulp and Paper
- 9.1.2. Paints and Coatings
- 9.1.3. Chemicals
- 9.1.4. Construction
- 9.1.5. Metals and Metallurgy
- 9.1.6. Electronics and Semiconductors
- 9.1.7. Other End-user Industries
- 9.1. Market Analysis, Insights and Forecast - by End-user Industry
- 10. South America Colloidal Silica Market Analysis, Insights and Forecast, 2020-2032
- 10.1. Market Analysis, Insights and Forecast - by End-user Industry
- 10.1.1. Pulp and Paper
- 10.1.2. Paints and Coatings
- 10.1.3. Chemicals
- 10.1.4. Construction
- 10.1.5. Metals and Metallurgy
- 10.1.6. Electronics and Semiconductors
- 10.1.7. Other End-user Industries
- 10.1. Market Analysis, Insights and Forecast - by End-user Industry
- 11. Middle East and Africa Colloidal Silica Market Analysis, Insights and Forecast, 2020-2032
- 11.1. Market Analysis, Insights and Forecast - by End-user Industry
- 11.1.1. Pulp and Paper
- 11.1.2. Paints and Coatings
- 11.1.3. Chemicals
- 11.1.4. Construction
- 11.1.5. Metals and Metallurgy
- 11.1.6. Electronics and Semiconductors
- 11.1.7. Other End-user Industries
- 11.1. Market Analysis, Insights and Forecast - by End-user Industry
- 12. Competitive Analysis
- 12.1. Company Profiles
- 12.1.1 Ecolab
- 12.1.1.1. Company Overview
- 12.1.1.2. Products
- 12.1.1.3. Company Financials
- 12.1.1.4. SWOT Analysis
- 12.1.2 AMS Applied Material Solutions
- 12.1.2.1. Company Overview
- 12.1.2.2. Products
- 12.1.2.3. Company Financials
- 12.1.2.4. SWOT Analysis
- 12.1.3 Nissan Chemical Corporation
- 12.1.3.1. Company Overview
- 12.1.3.2. Products
- 12.1.3.3. Company Financials
- 12.1.3.4. SWOT Analysis
- 12.1.4 Ted Pella Inc
- 12.1.4.1. Company Overview
- 12.1.4.2. Products
- 12.1.4.3. Company Financials
- 12.1.4.4. SWOT Analysis
- 12.1.5 W R Grace & Co *List Not Exhaustive
- 12.1.5.1. Company Overview
- 12.1.5.2. Products
- 12.1.5.3. Company Financials
- 12.1.5.4. SWOT Analysis
- 12.1.6 Cabot Corporation
- 12.1.6.1. Company Overview
- 12.1.6.2. Products
- 12.1.6.3. Company Financials
- 12.1.6.4. SWOT Analysis
- 12.1.7 Nyacol
- 12.1.7.1. Company Overview
- 12.1.7.2. Products
- 12.1.7.3. Company Financials
- 12.1.7.4. SWOT Analysis
- 12.1.8 FUSO CHEMICAL CO LTD
- 12.1.8.1. Company Overview
- 12.1.8.2. Products
- 12.1.8.3. Company Financials
- 12.1.8.4. SWOT Analysis
- 12.1.9 Nouryan
- 12.1.9.1. Company Overview
- 12.1.9.2. Products
- 12.1.9.3. Company Financials
- 12.1.9.4. SWOT Analysis
- 12.1.10 CWK Chemiewerk Bad Kstritz GmbH
- 12.1.10.1. Company Overview
- 12.1.10.2. Products
- 12.1.10.3. Company Financials
- 12.1.10.4. SWOT Analysis
- 12.1.11 Linyi Kehan Silicon Products Co LTD
- 12.1.11.1. Company Overview
- 12.1.11.2. Products
- 12.1.11.3. Company Financials
- 12.1.11.4. SWOT Analysis
- 12.1.12 Sterling Chemicals
- 12.1.12.1. Company Overview
- 12.1.12.2. Products
- 12.1.12.3. Company Financials
- 12.1.12.4. SWOT Analysis
- 12.1.13 Jinan Yinfeng Silicon Products Co Ltd
- 12.1.13.1. Company Overview
- 12.1.13.2. Products
- 12.1.13.3. Company Financials
- 12.1.13.4. SWOT Analysis
- 12.1.14 Akasel
- 12.1.14.1. Company Overview
- 12.1.14.2. Products
- 12.1.14.3. Company Financials
- 12.1.14.4. SWOT Analysis
- 12.1.15 Evonik
- 12.1.15.1. Company Overview
- 12.1.15.2. Products
- 12.1.15.3. Company Financials
- 12.1.15.4. SWOT Analysis
- 12.1.1 Ecolab
- 12.2. Market Entropy
- 12.2.1 Company's Key Areas Served
- 12.2.2 Recent Developments
- 12.3. Company Market Share Analysis 2025
- 12.3.1 Top 5 Companies Market Share Analysis
- 12.3.2 Top 3 Companies Market Share Analysis
- 12.4. List of Potential Customers
- 13. Research Methodology
List of Figures
- Figure 1: Global Colloidal Silica Market Revenue Breakdown (Million, %) by Region 2025 & 2033
- Figure 2: Global Colloidal Silica Market Volume Breakdown (K Tons, %) by Region 2025 & 2033
- Figure 3: Asia Pacific Colloidal Silica Market Revenue (Million), by End-user Industry 2025 & 2033
- Figure 4: Asia Pacific Colloidal Silica Market Volume (K Tons), by End-user Industry 2025 & 2033
- Figure 5: Asia Pacific Colloidal Silica Market Revenue Share (%), by End-user Industry 2025 & 2033
- Figure 6: Asia Pacific Colloidal Silica Market Volume Share (%), by End-user Industry 2025 & 2033
- Figure 7: Asia Pacific Colloidal Silica Market Revenue (Million), by Country 2025 & 2033
- Figure 8: Asia Pacific Colloidal Silica Market Volume (K Tons), by Country 2025 & 2033
- Figure 9: Asia Pacific Colloidal Silica Market Revenue Share (%), by Country 2025 & 2033
- Figure 10: Asia Pacific Colloidal Silica Market Volume Share (%), by Country 2025 & 2033
- Figure 11: North America Colloidal Silica Market Revenue (Million), by End-user Industry 2025 & 2033
- Figure 12: North America Colloidal Silica Market Volume (K Tons), by End-user Industry 2025 & 2033
- Figure 13: North America Colloidal Silica Market Revenue Share (%), by End-user Industry 2025 & 2033
- Figure 14: North America Colloidal Silica Market Volume Share (%), by End-user Industry 2025 & 2033
- Figure 15: North America Colloidal Silica Market Revenue (Million), by Country 2025 & 2033
- Figure 16: North America Colloidal Silica Market Volume (K Tons), by Country 2025 & 2033
- Figure 17: North America Colloidal Silica Market Revenue Share (%), by Country 2025 & 2033
- Figure 18: North America Colloidal Silica Market Volume Share (%), by Country 2025 & 2033
- Figure 19: Europe Colloidal Silica Market Revenue (Million), by End-user Industry 2025 & 2033
- Figure 20: Europe Colloidal Silica Market Volume (K Tons), by End-user Industry 2025 & 2033
- Figure 21: Europe Colloidal Silica Market Revenue Share (%), by End-user Industry 2025 & 2033
- Figure 22: Europe Colloidal Silica Market Volume Share (%), by End-user Industry 2025 & 2033
- Figure 23: Europe Colloidal Silica Market Revenue (Million), by Country 2025 & 2033
- Figure 24: Europe Colloidal Silica Market Volume (K Tons), by Country 2025 & 2033
- Figure 25: Europe Colloidal Silica Market Revenue Share (%), by Country 2025 & 2033
- Figure 26: Europe Colloidal Silica Market Volume Share (%), by Country 2025 & 2033
- Figure 27: South America Colloidal Silica Market Revenue (Million), by End-user Industry 2025 & 2033
- Figure 28: South America Colloidal Silica Market Volume (K Tons), by End-user Industry 2025 & 2033
- Figure 29: South America Colloidal Silica Market Revenue Share (%), by End-user Industry 2025 & 2033
- Figure 30: South America Colloidal Silica Market Volume Share (%), by End-user Industry 2025 & 2033
- Figure 31: South America Colloidal Silica Market Revenue (Million), by Country 2025 & 2033
- Figure 32: South America Colloidal Silica Market Volume (K Tons), by Country 2025 & 2033
- Figure 33: South America Colloidal Silica Market Revenue Share (%), by Country 2025 & 2033
- Figure 34: South America Colloidal Silica Market Volume Share (%), by Country 2025 & 2033
- Figure 35: Middle East and Africa Colloidal Silica Market Revenue (Million), by End-user Industry 2025 & 2033
- Figure 36: Middle East and Africa Colloidal Silica Market Volume (K Tons), by End-user Industry 2025 & 2033
- Figure 37: Middle East and Africa Colloidal Silica Market Revenue Share (%), by End-user Industry 2025 & 2033
- Figure 38: Middle East and Africa Colloidal Silica Market Volume Share (%), by End-user Industry 2025 & 2033
- Figure 39: Middle East and Africa Colloidal Silica Market Revenue (Million), by Country 2025 & 2033
- Figure 40: Middle East and Africa Colloidal Silica Market Volume (K Tons), by Country 2025 & 2033
- Figure 41: Middle East and Africa Colloidal Silica Market Revenue Share (%), by Country 2025 & 2033
- Figure 42: Middle East and Africa Colloidal Silica Market Volume Share (%), by Country 2025 & 2033
List of Tables
- Table 1: Global Colloidal Silica Market Revenue Million Forecast, by End-user Industry 2020 & 2033
- Table 2: Global Colloidal Silica Market Volume K Tons Forecast, by End-user Industry 2020 & 2033
- Table 3: Global Colloidal Silica Market Revenue Million Forecast, by Region 2020 & 2033
- Table 4: Global Colloidal Silica Market Volume K Tons Forecast, by Region 2020 & 2033
- Table 5: Global Colloidal Silica Market Revenue Million Forecast, by End-user Industry 2020 & 2033
- Table 6: Global Colloidal Silica Market Volume K Tons Forecast, by End-user Industry 2020 & 2033
- Table 7: Global Colloidal Silica Market Revenue Million Forecast, by Country 2020 & 2033
- Table 8: Global Colloidal Silica Market Volume K Tons Forecast, by Country 2020 & 2033
- Table 9: China Colloidal Silica Market Revenue (Million) Forecast, by Application 2020 & 2033
- Table 10: China Colloidal Silica Market Volume (K Tons) Forecast, by Application 2020 & 2033
- Table 11: India Colloidal Silica Market Revenue (Million) Forecast, by Application 2020 & 2033
- Table 12: India Colloidal Silica Market Volume (K Tons) Forecast, by Application 2020 & 2033
- Table 13: Japan Colloidal Silica Market Revenue (Million) Forecast, by Application 2020 & 2033
- Table 14: Japan Colloidal Silica Market Volume (K Tons) Forecast, by Application 2020 & 2033
- Table 15: South Korea Colloidal Silica Market Revenue (Million) Forecast, by Application 2020 & 2033
- Table 16: South Korea Colloidal Silica Market Volume (K Tons) Forecast, by Application 2020 & 2033
- Table 17: Rest of Asia Pacific Colloidal Silica Market Revenue (Million) Forecast, by Application 2020 & 2033
- Table 18: Rest of Asia Pacific Colloidal Silica Market Volume (K Tons) Forecast, by Application 2020 & 2033
- Table 19: Global Colloidal Silica Market Revenue Million Forecast, by End-user Industry 2020 & 2033
- Table 20: Global Colloidal Silica Market Volume K Tons Forecast, by End-user Industry 2020 & 2033
- Table 21: Global Colloidal Silica Market Revenue Million Forecast, by Country 2020 & 2033
- Table 22: Global Colloidal Silica Market Volume K Tons Forecast, by Country 2020 & 2033
- Table 23: United States Colloidal Silica Market Revenue (Million) Forecast, by Application 2020 & 2033
- Table 24: United States Colloidal Silica Market Volume (K Tons) Forecast, by Application 2020 & 2033
- Table 25: Canada Colloidal Silica Market Revenue (Million) Forecast, by Application 2020 & 2033
- Table 26: Canada Colloidal Silica Market Volume (K Tons) Forecast, by Application 2020 & 2033
- Table 27: Mexico Colloidal Silica Market Revenue (Million) Forecast, by Application 2020 & 2033
- Table 28: Mexico Colloidal Silica Market Volume (K Tons) Forecast, by Application 2020 & 2033
- Table 29: Global Colloidal Silica Market Revenue Million Forecast, by End-user Industry 2020 & 2033
- Table 30: Global Colloidal Silica Market Volume K Tons Forecast, by End-user Industry 2020 & 2033
- Table 31: Global Colloidal Silica Market Revenue Million Forecast, by Country 2020 & 2033
- Table 32: Global Colloidal Silica Market Volume K Tons Forecast, by Country 2020 & 2033
- Table 33: Germany Colloidal Silica Market Revenue (Million) Forecast, by Application 2020 & 2033
- Table 34: Germany Colloidal Silica Market Volume (K Tons) Forecast, by Application 2020 & 2033
- Table 35: United Kingdom Colloidal Silica Market Revenue (Million) Forecast, by Application 2020 & 2033
- Table 36: United Kingdom Colloidal Silica Market Volume (K Tons) Forecast, by Application 2020 & 2033
- Table 37: Italy Colloidal Silica Market Revenue (Million) Forecast, by Application 2020 & 2033
- Table 38: Italy Colloidal Silica Market Volume (K Tons) Forecast, by Application 2020 & 2033
- Table 39: France Colloidal Silica Market Revenue (Million) Forecast, by Application 2020 & 2033
- Table 40: France Colloidal Silica Market Volume (K Tons) Forecast, by Application 2020 & 2033
- Table 41: Rest of Europe Colloidal Silica Market Revenue (Million) Forecast, by Application 2020 & 2033
- Table 42: Rest of Europe Colloidal Silica Market Volume (K Tons) Forecast, by Application 2020 & 2033
- Table 43: Global Colloidal Silica Market Revenue Million Forecast, by End-user Industry 2020 & 2033
- Table 44: Global Colloidal Silica Market Volume K Tons Forecast, by End-user Industry 2020 & 2033
- Table 45: Global Colloidal Silica Market Revenue Million Forecast, by Country 2020 & 2033
- Table 46: Global Colloidal Silica Market Volume K Tons Forecast, by Country 2020 & 2033
- Table 47: Brazil Colloidal Silica Market Revenue (Million) Forecast, by Application 2020 & 2033
- Table 48: Brazil Colloidal Silica Market Volume (K Tons) Forecast, by Application 2020 & 2033
- Table 49: Argentina Colloidal Silica Market Revenue (Million) Forecast, by Application 2020 & 2033
- Table 50: Argentina Colloidal Silica Market Volume (K Tons) Forecast, by Application 2020 & 2033
- Table 51: Rest of South America Colloidal Silica Market Revenue (Million) Forecast, by Application 2020 & 2033
- Table 52: Rest of South America Colloidal Silica Market Volume (K Tons) Forecast, by Application 2020 & 2033
- Table 53: Global Colloidal Silica Market Revenue Million Forecast, by End-user Industry 2020 & 2033
- Table 54: Global Colloidal Silica Market Volume K Tons Forecast, by End-user Industry 2020 & 2033
- Table 55: Global Colloidal Silica Market Revenue Million Forecast, by Country 2020 & 2033
- Table 56: Global Colloidal Silica Market Volume K Tons Forecast, by Country 2020 & 2033
- Table 57: Saudi Arabia Colloidal Silica Market Revenue (Million) Forecast, by Application 2020 & 2033
- Table 58: Saudi Arabia Colloidal Silica Market Volume (K Tons) Forecast, by Application 2020 & 2033
- Table 59: South Africa Colloidal Silica Market Revenue (Million) Forecast, by Application 2020 & 2033
- Table 60: South Africa Colloidal Silica Market Volume (K Tons) Forecast, by Application 2020 & 2033
- Table 61: Rest of Middle East and Africa Colloidal Silica Market Revenue (Million) Forecast, by Application 2020 & 2033
- Table 62: Rest of Middle East and Africa Colloidal Silica Market Volume (K Tons) Forecast, by Application 2020 & 2033
Frequently Asked Questions
1. What is the projected Compound Annual Growth Rate (CAGR) of the Colloidal Silica Market?
The projected CAGR is approximately > 5.00%.
2. Which companies are prominent players in the Colloidal Silica Market?
Key companies in the market include Ecolab, AMS Applied Material Solutions, Nissan Chemical Corporation, Ted Pella Inc, W R Grace & Co *List Not Exhaustive, Cabot Corporation, Nyacol, FUSO CHEMICAL CO LTD, Nouryan, CWK Chemiewerk Bad Kstritz GmbH, Linyi Kehan Silicon Products Co LTD, Sterling Chemicals, Jinan Yinfeng Silicon Products Co Ltd, Akasel, Evonik.
3. What are the main segments of the Colloidal Silica Market?
The market segments include End-user Industry.
4. Can you provide details about the market size?
The market size is estimated to be USD 1010 Million as of 2022.
5. What are some drivers contributing to market growth?
Rising Demand for Concrete and Cements in the Construction Industry Globally; Increasing Demand for Silicon wafers for Production of Integrated Circuits in Electronic Devices.
6. What are the notable trends driving market growth?
Increasing Usage in the Construction Industry.
7. Are there any restraints impacting market growth?
Slow Drying Properties of Colloidal Silica; Other Restraints.
8. Can you provide examples of recent developments in the market?
In November 2021, Nouryon announced to increase the production capacity of the colloidal silica manufacturing facility, based in Green Bay, Wisconsin, U.S.A. The increased production capacity will help in meeting demands for packaging and construction end markets. The construction is expected to complete in the second half of 2022.
9. What pricing options are available for accessing the report?
Pricing options include single-user, multi-user, and enterprise licenses priced at USD 4750, USD 5250, and USD 8750 respectively.
10. Is the market size provided in terms of value or volume?
The market size is provided in terms of value, measured in Million and volume, measured in K Tons.
11. Are there any specific market keywords associated with the report?
Yes, the market keyword associated with the report is "Colloidal Silica Market," which aids in identifying and referencing the specific market segment covered.
12. How do I determine which pricing option suits my needs best?
The pricing options vary based on user requirements and access needs. Individual users may opt for single-user licenses, while businesses requiring broader access may choose multi-user or enterprise licenses for cost-effective access to the report.
13. Are there any additional resources or data provided in the Colloidal Silica Market report?
While the report offers comprehensive insights, it's advisable to review the specific contents or supplementary materials provided to ascertain if additional resources or data are available.
14. How can I stay updated on further developments or reports in the Colloidal Silica Market?
To stay informed about further developments, trends, and reports in the Colloidal Silica Market, consider subscribing to industry newsletters, following relevant companies and organizations, or regularly checking reputable industry news sources and publications.
Methodology
Step 1 - Identification of Relevant Samples Size from Population Database


Step 2 - Approaches for Defining Global Market Size (Value, Volume* & Price*)

Note*: In applicable scenarios
Step 3 - Data Sources
Primary Research
- Web Analytics
- Survey Reports
- Research Institute
- Latest Research Reports
- Opinion Leaders
Secondary Research
- Annual Reports
- White Paper
- Latest Press Release
- Industry Association
- Paid Database
- Investor Presentations

Step 4 - Data Triangulation
Involves using different sources of information in order to increase the validity of a study
These sources are likely to be stakeholders in a program - participants, other researchers, program staff, other community members, and so on.
Then we put all data in single framework & apply various statistical tools to find out the dynamic on the market.
During the analysis stage, feedback from the stakeholder groups would be compared to determine areas of agreement as well as areas of divergence