

Key Insights
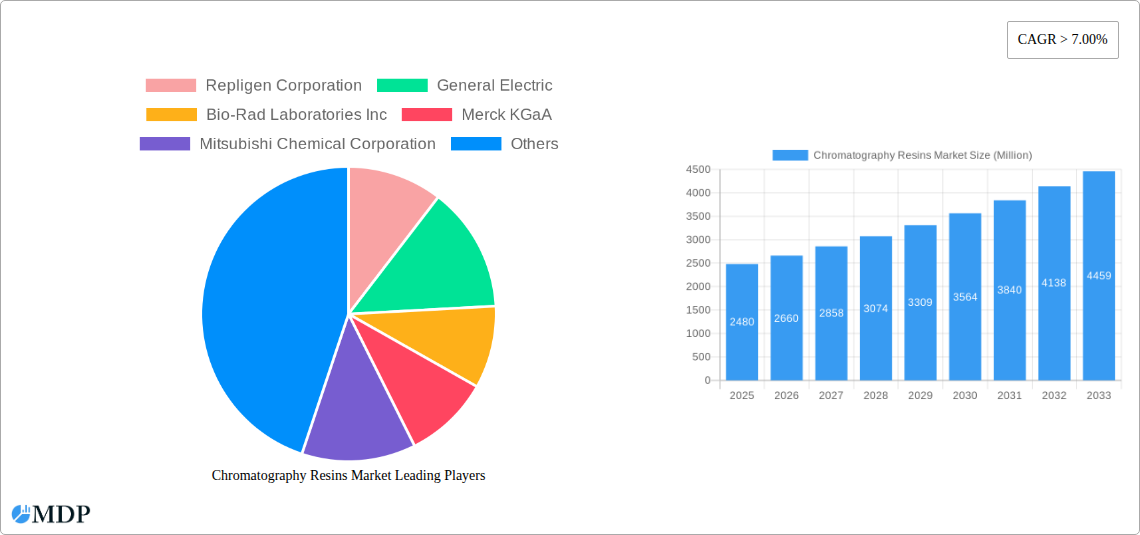
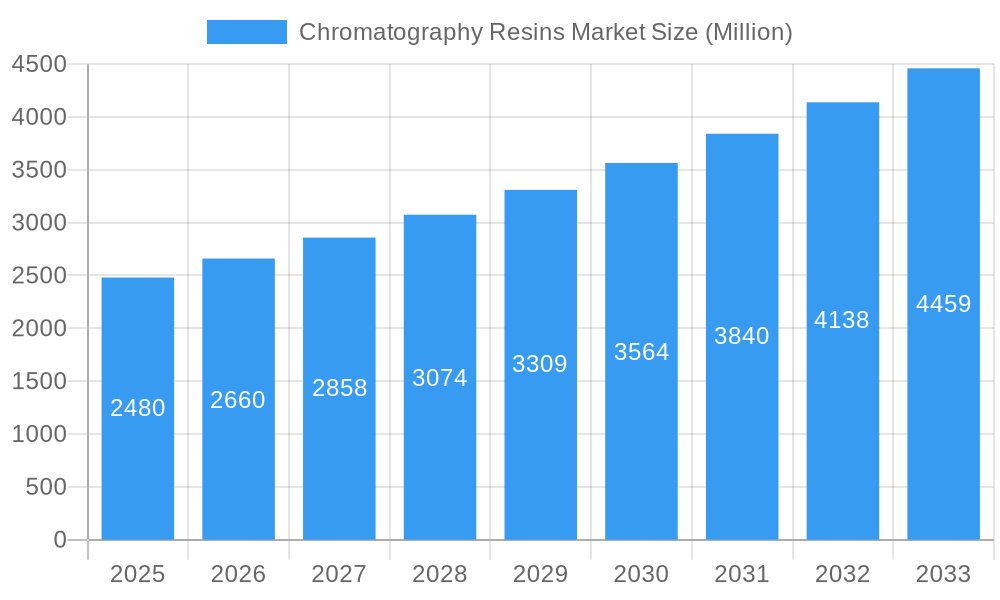
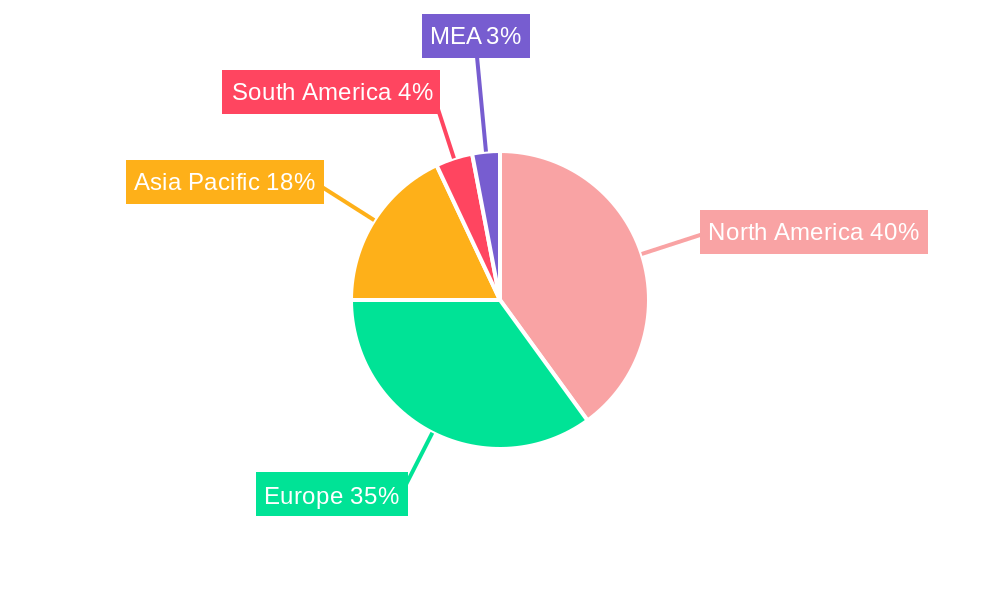
The Chromatography Resins market, valued at $2480 million in 2025, is projected to experience robust growth, exhibiting a Compound Annual Growth Rate (CAGR) exceeding 7% from 2025 to 2033. This expansion is fueled by several key drivers. The burgeoning pharmaceutical and biotechnology industries are significantly increasing demand for high-purity compounds, driving the adoption of advanced chromatography resins for purification and separation processes. Furthermore, stringent regulatory requirements for drug quality and safety are pushing manufacturers to invest in more efficient and precise chromatography technologies. The growing focus on personalized medicine and the development of novel biologics further amplify market demand. Technological advancements, such as the development of highly selective and efficient resins with improved performance characteristics, contribute significantly to market growth. The market segmentation highlights the dominance of the pharmaceutical end-user industry, followed by the drug production and water & environmental agencies. Natural-based resins hold a significant market share currently, although synthetic-based dextran resins are witnessing rapid adoption due to their superior performance and scalability. Among technologies, ion exchange chromatography resins currently maintain a large market share, though affinity and size exclusion chromatography are gaining traction due to their suitability for specific applications. The North American and European regions currently represent the largest market shares, driven by established pharmaceutical and biotechnology sectors and robust regulatory frameworks. However, Asia-Pacific is poised for substantial growth fueled by increasing investments in healthcare infrastructure and a rapidly expanding pharmaceutical industry.
Chromatography Resins Market Market Size (In Billion)
Competition in the Chromatography Resins market is intense, with established players like Repligen Corporation, General Electric, Bio-Rad Laboratories, Merck KGaA, and others vying for market share. The market is characterized by continuous innovation, with companies focusing on developing novel resin materials, improving existing technologies, and expanding their product portfolios. Potential restraints include the high cost of advanced chromatography resins and the need for specialized expertise in their operation. However, the long-term growth prospects remain positive, driven by the persistent demand for high-purity compounds in various applications and the continuous advancements in chromatographic techniques. The market is expected to witness further consolidation through mergers and acquisitions, as companies strive to expand their market reach and offer comprehensive solutions to customers.
Chromatography Resins Market Company Market Share
Chromatography Resins Market: A Comprehensive Report (2019-2033)
This comprehensive report provides an in-depth analysis of the Chromatography Resins Market, offering invaluable insights for industry stakeholders, investors, and researchers. With a focus on market dynamics, leading players, and future trends, this report covers the period from 2019 to 2033, with a base year of 2025. The report projects a market value exceeding xx Million by 2033, presenting a compelling opportunity for growth and investment. The report leverages extensive market research and data analysis to provide actionable intelligence for strategic decision-making.
Chromatography Resins Market Market Dynamics & Concentration
The Chromatography Resins market is characterized by moderate concentration, with several key players holding significant market share. The market is witnessing continuous innovation driven by the increasing demand for high-performance separation techniques in various industries. Stringent regulatory frameworks, particularly within the pharmaceutical and biopharmaceutical sectors, significantly influence product development and adoption. The presence of substitute technologies, such as electrophoresis, poses a competitive challenge, while evolving end-user preferences towards automation and high-throughput solutions drive market growth. Mergers and acquisitions (M&A) activity is a key characteristic, with notable transactions impacting market consolidation.
- Market Share: The top five players hold an estimated xx% of the global market share in 2025.
- M&A Activity: The report documents xx M&A deals in the historical period (2019-2024), reflecting strategic consolidation within the industry. The acquisition of Pall Corporation's Chromatography and Filtration business by Repligen Corporation in 2021 is a prime example of this trend. This activity is expected to continue, shaping the competitive landscape in the forecast period.
- Innovation Drivers: The demand for advanced resins with improved selectivity, efficiency, and scalability drives innovation.
- Regulatory Frameworks: Stringent regulatory compliance requirements, particularly within the pharmaceutical sector, necessitate high-quality resins and robust manufacturing processes.
Chromatography Resins Market Industry Trends & Analysis
The Chromatography Resins market exhibits a robust Compound Annual Growth Rate (CAGR) of xx% during the forecast period (2025-2033). This growth is fueled by several key factors, including the expanding biopharmaceutical industry, increasing demand for high-purity products, and the rising adoption of chromatography techniques in various applications. Technological advancements, such as the development of novel resin materials and improved column designs, contribute to market expansion. Consumer preferences are shifting towards high-throughput, automated systems, impacting the demand for compatible resins. Competitive dynamics are characterized by ongoing innovation, strategic partnerships, and the emergence of new players. Market penetration of advanced chromatography techniques is steadily increasing across diverse end-user industries.
Leading Markets & Segments in Chromatography Resins Market
The Pharmaceutical industry is the dominant end-user segment, accounting for xx% of the total market value in 2025. This is followed by Drug Production, Water and Environmental Agencies, and Food and Beverages. Geographically, North America and Europe represent the leading markets due to a high concentration of pharmaceutical and biotechnology companies, strong regulatory frameworks, and significant investments in research and development.
Key Drivers by Segment:
- Pharmaceuticals: Stringent regulatory compliance, need for high-purity active pharmaceutical ingredients (APIs).
- Drug Production: Growing demand for biosimilars and biologics.
- Water and Environmental Agencies: Increasing stringent environmental regulations and water purification needs.
- Food and Beverages: Demand for quality control and analysis in food and beverage processing.
Origin: Synthetic-based resins dominate the market due to their superior performance and reproducibility.
Technology: Ion exchange chromatography resins hold the largest market share among the various technologies due to their versatility and wide range of applications. However, the affinity chromatography resins segment is projected to experience significant growth due to its increasing use in biopharmaceutical purification.
- Dominant Region: North America holds the largest market share due to the concentration of pharmaceutical and biotechnology companies and robust R&D infrastructure.
- Dominant Country: The United States is the largest national market due to the high concentration of pharmaceutical and biotechnology companies.
Chromatography Resins Market Product Developments
Recent years have witnessed significant advancements in chromatography resins, driven by the need for enhanced selectivity, higher resolution, and improved efficiency. Innovations include novel resin materials with tailored functionalities, improved column designs for optimized flow rates, and the integration of advanced automation technologies. These innovations have expanded the applicability of chromatography resins across various industries, offering enhanced product performance and cost-effectiveness. Companies are focused on providing customized solutions to meet specific application requirements, further enhancing market competitiveness.
Key Drivers of Chromatography Resins Market Growth
The growth of the chromatography resins market is driven by several key factors. The expanding biopharmaceutical industry, with increasing demand for high-purity biologics, is a major driver. Advances in resin technology, including the development of novel materials and improved column designs, enhance efficiency and performance. Stringent regulatory frameworks in various industries necessitate high-quality separation techniques, leading to greater adoption of chromatography. Lastly, the increasing demand for automation and high-throughput systems across different applications drives market growth.
Challenges in the Chromatography Resins Market Market
The Chromatography Resins market faces challenges such as price fluctuations in raw materials, impacting production costs. Competition from alternative separation technologies and potential supply chain disruptions due to geopolitical factors are concerns. Stringent regulatory approvals and compliance requirements also pose hurdles. These challenges necessitate strategic planning and adaptive approaches for companies operating in this market. Furthermore, the need for skilled labor and specialized expertise can limit market expansion in certain regions.
Emerging Opportunities in Chromatography Resins Market
Emerging opportunities are driven by technological advancements, particularly in the development of novel resin materials with improved selectivity and performance. The expansion into new applications, including advanced materials and environmental monitoring, presents a lucrative avenue for growth. Strategic partnerships and collaborations to improve the technological advancement of the resins and their application will unlock further potential. The market expansion into emerging economies presents significant opportunities for growth.
Leading Players in the Chromatography Resins Market Sector
- Repligen Corporation
- General Electric
- Bio-Rad Laboratories Inc
- Merck KGaA
- Mitsubishi Chemical Corporation
- Dupont
- Perkinelmer Inc
- Pall Corporation
- Tosoh Bioscience LLC
- Purolite
- Agilient Technologies
- Avantor Inc
- Thermo Fisher Scientific
Key Milestones in Chromatography Resins Market Industry
- 2021: Repligen Corporation acquired Pall Corporation's Chromatography and Filtration business, significantly impacting market consolidation.
- 2022: Thermo Fisher Scientific launched a new line of chromatography resins designed for high-throughput biopharmaceutical purification, enhancing product offerings and market competitiveness.
Strategic Outlook for Chromatography Resins Market Market
The Chromatography Resins market is poised for sustained growth, driven by technological innovations, expanding end-user industries, and increasing demand for high-purity products. Strategic partnerships, investments in R&D, and expansion into new geographical markets will be crucial for players to capitalize on future growth opportunities. Companies focused on developing sustainable and environmentally friendly resin technologies will gain a competitive advantage. The market's future success depends on continuous innovation and adaptation to meet the evolving needs of various industries.
Chromatography Resins Market Segmentation
-
1. Origin
-
1.1. Natural-based
- 1.1.1. Agarose
- 1.1.2. Dextran
-
1.2. Synthetic-based
- 1.2.1. Silica Gel
- 1.2.2. Aluminum Oxide
- 1.2.3. Polystyrene
- 1.2.4. Other Synthetic-based Resins
-
1.1. Natural-based
-
2. Technology
- 2.1. Ion Exchange Chromatography Resins
- 2.2. Affinity Chromatography Resins
- 2.3. Size Exclusion Chromatography Resins
- 2.4. Hydrophobic Interaction Chromatography Resins
- 2.5. Other Technologies
-
3. End-user Industry
-
3.1. Pharmaceuticals
- 3.1.1. Biotechnology
- 3.1.2. Drug Discovery
- 3.1.3. Drug Production
- 3.2. Water and Environmental Agencies
- 3.3. Food and Beverages
- 3.4. Other End-user Industries
-
3.1. Pharmaceuticals
Chromatography Resins Market Segmentation By Geography
-
1. Asia Pacific
- 1.1. China
- 1.2. India
- 1.3. Japan
- 1.4. Rest of Asia Pacific
-
2. North America
- 2.1. United States
- 2.2. Canada
- 2.3. Mexico
-
3. Europe
- 3.1. Germany
- 3.2. United Kingdom
- 3.3. Italy
- 3.4. France
- 3.5. Switzerland
- 3.6. Rest of Europe
-
4. Rest of the World
- 4.1. South America
- 4.2. Middle East and Africa
Chromatography Resins Market Regional Market Share
Geographic Coverage of Chromatography Resins Market
Chromatography Resins Market REPORT HIGHLIGHTS
| Aspects | Details |
|---|---|
| Study Period | 2020-2034 |
| Base Year | 2025 |
| Estimated Year | 2026 |
| Forecast Period | 2026-2034 |
| Historical Period | 2020-2025 |
| Growth Rate | CAGR of > 7.00% from 2020-2034 |
| Segmentation |
|
Table of Contents
- 1. Introduction
- 1.1. Research Scope
- 1.2. Market Segmentation
- 1.3. Research Objective
- 1.4. Definitions and Assumptions
- 2. Executive Summary
- 2.1. Market Snapshot
- 3. Market Dynamics
- 3.1. Market Drivers
- 3.2. Market Restrains
- 3.3. Market Trends
- 3.4. Market Opportunities
- 4. Market Factor Analysis
- 4.1. Porters Five Forces
- 4.1.1. Bargaining Power of Suppliers
- 4.1.2. Bargaining Power of Buyers
- 4.1.3. Threat of New Entrants
- 4.1.4. Threat of Substitutes
- 4.1.5. Competitive Rivalry
- 4.2. PESTEL analysis
- 4.3. BCG Analysis
- 4.3.1. Stars (High Growth, High Market Share)
- 4.3.2. Cash Cows (Low Growth, High Market Share)
- 4.3.3. Question Mark (High Growth, Low Market Share)
- 4.3.4. Dogs (Low Growth, Low Market Share)
- 4.4. Ansoff Matrix Analysis
- 4.5. Supply Chain Analysis
- 4.6. Regulatory Landscape
- 4.7. Current Market Potential and Opportunity Assessment (TAM–SAM–SOM Framework)
- 4.8. MDP Analyst Note
- 4.1. Porters Five Forces
- 5. Market Analysis, Insights and Forecast 2021-2033
- 5.1. Market Analysis, Insights and Forecast - by Origin
- 5.1.1. Natural-based
- 5.1.1.1. Agarose
- 5.1.1.2. Dextran
- 5.1.2. Synthetic-based
- 5.1.2.1. Silica Gel
- 5.1.2.2. Aluminum Oxide
- 5.1.2.3. Polystyrene
- 5.1.2.4. Other Synthetic-based Resins
- 5.1.1. Natural-based
- 5.2. Market Analysis, Insights and Forecast - by Technology
- 5.2.1. Ion Exchange Chromatography Resins
- 5.2.2. Affinity Chromatography Resins
- 5.2.3. Size Exclusion Chromatography Resins
- 5.2.4. Hydrophobic Interaction Chromatography Resins
- 5.2.5. Other Technologies
- 5.3. Market Analysis, Insights and Forecast - by End-user Industry
- 5.3.1. Pharmaceuticals
- 5.3.1.1. Biotechnology
- 5.3.1.2. Drug Discovery
- 5.3.1.3. Drug Production
- 5.3.2. Water and Environmental Agencies
- 5.3.3. Food and Beverages
- 5.3.4. Other End-user Industries
- 5.3.1. Pharmaceuticals
- 5.4. Market Analysis, Insights and Forecast - by Region
- 5.4.1. Asia Pacific
- 5.4.2. North America
- 5.4.3. Europe
- 5.4.4. Rest of the World
- 5.1. Market Analysis, Insights and Forecast - by Origin
- 6. Global Chromatography Resins Market Analysis, Insights and Forecast, 2021-2033
- 6.1. Market Analysis, Insights and Forecast - by Origin
- 6.1.1. Natural-based
- 6.1.1.1. Agarose
- 6.1.1.2. Dextran
- 6.1.2. Synthetic-based
- 6.1.2.1. Silica Gel
- 6.1.2.2. Aluminum Oxide
- 6.1.2.3. Polystyrene
- 6.1.2.4. Other Synthetic-based Resins
- 6.1.1. Natural-based
- 6.2. Market Analysis, Insights and Forecast - by Technology
- 6.2.1. Ion Exchange Chromatography Resins
- 6.2.2. Affinity Chromatography Resins
- 6.2.3. Size Exclusion Chromatography Resins
- 6.2.4. Hydrophobic Interaction Chromatography Resins
- 6.2.5. Other Technologies
- 6.3. Market Analysis, Insights and Forecast - by End-user Industry
- 6.3.1. Pharmaceuticals
- 6.3.1.1. Biotechnology
- 6.3.1.2. Drug Discovery
- 6.3.1.3. Drug Production
- 6.3.2. Water and Environmental Agencies
- 6.3.3. Food and Beverages
- 6.3.4. Other End-user Industries
- 6.3.1. Pharmaceuticals
- 6.1. Market Analysis, Insights and Forecast - by Origin
- 7. Asia Pacific Chromatography Resins Market Analysis, Insights and Forecast, 2020-2032
- 7.1. Market Analysis, Insights and Forecast - by Origin
- 7.1.1. Natural-based
- 7.1.1.1. Agarose
- 7.1.1.2. Dextran
- 7.1.2. Synthetic-based
- 7.1.2.1. Silica Gel
- 7.1.2.2. Aluminum Oxide
- 7.1.2.3. Polystyrene
- 7.1.2.4. Other Synthetic-based Resins
- 7.1.1. Natural-based
- 7.2. Market Analysis, Insights and Forecast - by Technology
- 7.2.1. Ion Exchange Chromatography Resins
- 7.2.2. Affinity Chromatography Resins
- 7.2.3. Size Exclusion Chromatography Resins
- 7.2.4. Hydrophobic Interaction Chromatography Resins
- 7.2.5. Other Technologies
- 7.3. Market Analysis, Insights and Forecast - by End-user Industry
- 7.3.1. Pharmaceuticals
- 7.3.1.1. Biotechnology
- 7.3.1.2. Drug Discovery
- 7.3.1.3. Drug Production
- 7.3.2. Water and Environmental Agencies
- 7.3.3. Food and Beverages
- 7.3.4. Other End-user Industries
- 7.3.1. Pharmaceuticals
- 7.1. Market Analysis, Insights and Forecast - by Origin
- 8. North America Chromatography Resins Market Analysis, Insights and Forecast, 2020-2032
- 8.1. Market Analysis, Insights and Forecast - by Origin
- 8.1.1. Natural-based
- 8.1.1.1. Agarose
- 8.1.1.2. Dextran
- 8.1.2. Synthetic-based
- 8.1.2.1. Silica Gel
- 8.1.2.2. Aluminum Oxide
- 8.1.2.3. Polystyrene
- 8.1.2.4. Other Synthetic-based Resins
- 8.1.1. Natural-based
- 8.2. Market Analysis, Insights and Forecast - by Technology
- 8.2.1. Ion Exchange Chromatography Resins
- 8.2.2. Affinity Chromatography Resins
- 8.2.3. Size Exclusion Chromatography Resins
- 8.2.4. Hydrophobic Interaction Chromatography Resins
- 8.2.5. Other Technologies
- 8.3. Market Analysis, Insights and Forecast - by End-user Industry
- 8.3.1. Pharmaceuticals
- 8.3.1.1. Biotechnology
- 8.3.1.2. Drug Discovery
- 8.3.1.3. Drug Production
- 8.3.2. Water and Environmental Agencies
- 8.3.3. Food and Beverages
- 8.3.4. Other End-user Industries
- 8.3.1. Pharmaceuticals
- 8.1. Market Analysis, Insights and Forecast - by Origin
- 9. Europe Chromatography Resins Market Analysis, Insights and Forecast, 2020-2032
- 9.1. Market Analysis, Insights and Forecast - by Origin
- 9.1.1. Natural-based
- 9.1.1.1. Agarose
- 9.1.1.2. Dextran
- 9.1.2. Synthetic-based
- 9.1.2.1. Silica Gel
- 9.1.2.2. Aluminum Oxide
- 9.1.2.3. Polystyrene
- 9.1.2.4. Other Synthetic-based Resins
- 9.1.1. Natural-based
- 9.2. Market Analysis, Insights and Forecast - by Technology
- 9.2.1. Ion Exchange Chromatography Resins
- 9.2.2. Affinity Chromatography Resins
- 9.2.3. Size Exclusion Chromatography Resins
- 9.2.4. Hydrophobic Interaction Chromatography Resins
- 9.2.5. Other Technologies
- 9.3. Market Analysis, Insights and Forecast - by End-user Industry
- 9.3.1. Pharmaceuticals
- 9.3.1.1. Biotechnology
- 9.3.1.2. Drug Discovery
- 9.3.1.3. Drug Production
- 9.3.2. Water and Environmental Agencies
- 9.3.3. Food and Beverages
- 9.3.4. Other End-user Industries
- 9.3.1. Pharmaceuticals
- 9.1. Market Analysis, Insights and Forecast - by Origin
- 10. Rest of the World Chromatography Resins Market Analysis, Insights and Forecast, 2020-2032
- 10.1. Market Analysis, Insights and Forecast - by Origin
- 10.1.1. Natural-based
- 10.1.1.1. Agarose
- 10.1.1.2. Dextran
- 10.1.2. Synthetic-based
- 10.1.2.1. Silica Gel
- 10.1.2.2. Aluminum Oxide
- 10.1.2.3. Polystyrene
- 10.1.2.4. Other Synthetic-based Resins
- 10.1.1. Natural-based
- 10.2. Market Analysis, Insights and Forecast - by Technology
- 10.2.1. Ion Exchange Chromatography Resins
- 10.2.2. Affinity Chromatography Resins
- 10.2.3. Size Exclusion Chromatography Resins
- 10.2.4. Hydrophobic Interaction Chromatography Resins
- 10.2.5. Other Technologies
- 10.3. Market Analysis, Insights and Forecast - by End-user Industry
- 10.3.1. Pharmaceuticals
- 10.3.1.1. Biotechnology
- 10.3.1.2. Drug Discovery
- 10.3.1.3. Drug Production
- 10.3.2. Water and Environmental Agencies
- 10.3.3. Food and Beverages
- 10.3.4. Other End-user Industries
- 10.3.1. Pharmaceuticals
- 10.1. Market Analysis, Insights and Forecast - by Origin
- 11. Competitive Analysis
- 11.1. Company Profiles
- 11.1.1 Repligen Corporation
- 11.1.1.1. Company Overview
- 11.1.1.2. Products
- 11.1.1.3. Company Financials
- 11.1.1.4. SWOT Analysis
- 11.1.2 General Electric
- 11.1.2.1. Company Overview
- 11.1.2.2. Products
- 11.1.2.3. Company Financials
- 11.1.2.4. SWOT Analysis
- 11.1.3 Bio-Rad Laboratories Inc
- 11.1.3.1. Company Overview
- 11.1.3.2. Products
- 11.1.3.3. Company Financials
- 11.1.3.4. SWOT Analysis
- 11.1.4 Merck KGaA
- 11.1.4.1. Company Overview
- 11.1.4.2. Products
- 11.1.4.3. Company Financials
- 11.1.4.4. SWOT Analysis
- 11.1.5 Mitsubishi Chemical Corporation
- 11.1.5.1. Company Overview
- 11.1.5.2. Products
- 11.1.5.3. Company Financials
- 11.1.5.4. SWOT Analysis
- 11.1.6 Dupont
- 11.1.6.1. Company Overview
- 11.1.6.2. Products
- 11.1.6.3. Company Financials
- 11.1.6.4. SWOT Analysis
- 11.1.7 Perkinelmer Inc
- 11.1.7.1. Company Overview
- 11.1.7.2. Products
- 11.1.7.3. Company Financials
- 11.1.7.4. SWOT Analysis
- 11.1.8 Pall Corporation
- 11.1.8.1. Company Overview
- 11.1.8.2. Products
- 11.1.8.3. Company Financials
- 11.1.8.4. SWOT Analysis
- 11.1.9 Tosoh Bioscience LLC*List Not Exhaustive
- 11.1.9.1. Company Overview
- 11.1.9.2. Products
- 11.1.9.3. Company Financials
- 11.1.9.4. SWOT Analysis
- 11.1.10 Purolite
- 11.1.10.1. Company Overview
- 11.1.10.2. Products
- 11.1.10.3. Company Financials
- 11.1.10.4. SWOT Analysis
- 11.1.11 Agilient Technologies
- 11.1.11.1. Company Overview
- 11.1.11.2. Products
- 11.1.11.3. Company Financials
- 11.1.11.4. SWOT Analysis
- 11.1.12 Avantor Inc
- 11.1.12.1. Company Overview
- 11.1.12.2. Products
- 11.1.12.3. Company Financials
- 11.1.12.4. SWOT Analysis
- 11.1.13 Thermo Fisher Scientific
- 11.1.13.1. Company Overview
- 11.1.13.2. Products
- 11.1.13.3. Company Financials
- 11.1.13.4. SWOT Analysis
- 11.1.1 Repligen Corporation
- 11.2. Market Entropy
- 11.2.1 Company's Key Areas Served
- 11.2.2 Recent Developments
- 11.3. Company Market Share Analysis 2025
- 11.3.1 Top 5 Companies Market Share Analysis
- 11.3.2 Top 3 Companies Market Share Analysis
- 11.4. List of Potential Customers
- 12. Research Methodology
List of Figures
- Figure 1: Global Chromatography Resins Market Revenue Breakdown (Million, %) by Region 2025 & 2033
- Figure 2: Global Chromatography Resins Market Volume Breakdown (K Tons, %) by Region 2025 & 2033
- Figure 3: Asia Pacific Chromatography Resins Market Revenue (Million), by Origin 2025 & 2033
- Figure 4: Asia Pacific Chromatography Resins Market Volume (K Tons), by Origin 2025 & 2033
- Figure 5: Asia Pacific Chromatography Resins Market Revenue Share (%), by Origin 2025 & 2033
- Figure 6: Asia Pacific Chromatography Resins Market Volume Share (%), by Origin 2025 & 2033
- Figure 7: Asia Pacific Chromatography Resins Market Revenue (Million), by Technology 2025 & 2033
- Figure 8: Asia Pacific Chromatography Resins Market Volume (K Tons), by Technology 2025 & 2033
- Figure 9: Asia Pacific Chromatography Resins Market Revenue Share (%), by Technology 2025 & 2033
- Figure 10: Asia Pacific Chromatography Resins Market Volume Share (%), by Technology 2025 & 2033
- Figure 11: Asia Pacific Chromatography Resins Market Revenue (Million), by End-user Industry 2025 & 2033
- Figure 12: Asia Pacific Chromatography Resins Market Volume (K Tons), by End-user Industry 2025 & 2033
- Figure 13: Asia Pacific Chromatography Resins Market Revenue Share (%), by End-user Industry 2025 & 2033
- Figure 14: Asia Pacific Chromatography Resins Market Volume Share (%), by End-user Industry 2025 & 2033
- Figure 15: Asia Pacific Chromatography Resins Market Revenue (Million), by Country 2025 & 2033
- Figure 16: Asia Pacific Chromatography Resins Market Volume (K Tons), by Country 2025 & 2033
- Figure 17: Asia Pacific Chromatography Resins Market Revenue Share (%), by Country 2025 & 2033
- Figure 18: Asia Pacific Chromatography Resins Market Volume Share (%), by Country 2025 & 2033
- Figure 19: North America Chromatography Resins Market Revenue (Million), by Origin 2025 & 2033
- Figure 20: North America Chromatography Resins Market Volume (K Tons), by Origin 2025 & 2033
- Figure 21: North America Chromatography Resins Market Revenue Share (%), by Origin 2025 & 2033
- Figure 22: North America Chromatography Resins Market Volume Share (%), by Origin 2025 & 2033
- Figure 23: North America Chromatography Resins Market Revenue (Million), by Technology 2025 & 2033
- Figure 24: North America Chromatography Resins Market Volume (K Tons), by Technology 2025 & 2033
- Figure 25: North America Chromatography Resins Market Revenue Share (%), by Technology 2025 & 2033
- Figure 26: North America Chromatography Resins Market Volume Share (%), by Technology 2025 & 2033
- Figure 27: North America Chromatography Resins Market Revenue (Million), by End-user Industry 2025 & 2033
- Figure 28: North America Chromatography Resins Market Volume (K Tons), by End-user Industry 2025 & 2033
- Figure 29: North America Chromatography Resins Market Revenue Share (%), by End-user Industry 2025 & 2033
- Figure 30: North America Chromatography Resins Market Volume Share (%), by End-user Industry 2025 & 2033
- Figure 31: North America Chromatography Resins Market Revenue (Million), by Country 2025 & 2033
- Figure 32: North America Chromatography Resins Market Volume (K Tons), by Country 2025 & 2033
- Figure 33: North America Chromatography Resins Market Revenue Share (%), by Country 2025 & 2033
- Figure 34: North America Chromatography Resins Market Volume Share (%), by Country 2025 & 2033
- Figure 35: Europe Chromatography Resins Market Revenue (Million), by Origin 2025 & 2033
- Figure 36: Europe Chromatography Resins Market Volume (K Tons), by Origin 2025 & 2033
- Figure 37: Europe Chromatography Resins Market Revenue Share (%), by Origin 2025 & 2033
- Figure 38: Europe Chromatography Resins Market Volume Share (%), by Origin 2025 & 2033
- Figure 39: Europe Chromatography Resins Market Revenue (Million), by Technology 2025 & 2033
- Figure 40: Europe Chromatography Resins Market Volume (K Tons), by Technology 2025 & 2033
- Figure 41: Europe Chromatography Resins Market Revenue Share (%), by Technology 2025 & 2033
- Figure 42: Europe Chromatography Resins Market Volume Share (%), by Technology 2025 & 2033
- Figure 43: Europe Chromatography Resins Market Revenue (Million), by End-user Industry 2025 & 2033
- Figure 44: Europe Chromatography Resins Market Volume (K Tons), by End-user Industry 2025 & 2033
- Figure 45: Europe Chromatography Resins Market Revenue Share (%), by End-user Industry 2025 & 2033
- Figure 46: Europe Chromatography Resins Market Volume Share (%), by End-user Industry 2025 & 2033
- Figure 47: Europe Chromatography Resins Market Revenue (Million), by Country 2025 & 2033
- Figure 48: Europe Chromatography Resins Market Volume (K Tons), by Country 2025 & 2033
- Figure 49: Europe Chromatography Resins Market Revenue Share (%), by Country 2025 & 2033
- Figure 50: Europe Chromatography Resins Market Volume Share (%), by Country 2025 & 2033
- Figure 51: Rest of the World Chromatography Resins Market Revenue (Million), by Origin 2025 & 2033
- Figure 52: Rest of the World Chromatography Resins Market Volume (K Tons), by Origin 2025 & 2033
- Figure 53: Rest of the World Chromatography Resins Market Revenue Share (%), by Origin 2025 & 2033
- Figure 54: Rest of the World Chromatography Resins Market Volume Share (%), by Origin 2025 & 2033
- Figure 55: Rest of the World Chromatography Resins Market Revenue (Million), by Technology 2025 & 2033
- Figure 56: Rest of the World Chromatography Resins Market Volume (K Tons), by Technology 2025 & 2033
- Figure 57: Rest of the World Chromatography Resins Market Revenue Share (%), by Technology 2025 & 2033
- Figure 58: Rest of the World Chromatography Resins Market Volume Share (%), by Technology 2025 & 2033
- Figure 59: Rest of the World Chromatography Resins Market Revenue (Million), by End-user Industry 2025 & 2033
- Figure 60: Rest of the World Chromatography Resins Market Volume (K Tons), by End-user Industry 2025 & 2033
- Figure 61: Rest of the World Chromatography Resins Market Revenue Share (%), by End-user Industry 2025 & 2033
- Figure 62: Rest of the World Chromatography Resins Market Volume Share (%), by End-user Industry 2025 & 2033
- Figure 63: Rest of the World Chromatography Resins Market Revenue (Million), by Country 2025 & 2033
- Figure 64: Rest of the World Chromatography Resins Market Volume (K Tons), by Country 2025 & 2033
- Figure 65: Rest of the World Chromatography Resins Market Revenue Share (%), by Country 2025 & 2033
- Figure 66: Rest of the World Chromatography Resins Market Volume Share (%), by Country 2025 & 2033
List of Tables
- Table 1: Global Chromatography Resins Market Revenue Million Forecast, by Origin 2020 & 2033
- Table 2: Global Chromatography Resins Market Volume K Tons Forecast, by Origin 2020 & 2033
- Table 3: Global Chromatography Resins Market Revenue Million Forecast, by Technology 2020 & 2033
- Table 4: Global Chromatography Resins Market Volume K Tons Forecast, by Technology 2020 & 2033
- Table 5: Global Chromatography Resins Market Revenue Million Forecast, by End-user Industry 2020 & 2033
- Table 6: Global Chromatography Resins Market Volume K Tons Forecast, by End-user Industry 2020 & 2033
- Table 7: Global Chromatography Resins Market Revenue Million Forecast, by Region 2020 & 2033
- Table 8: Global Chromatography Resins Market Volume K Tons Forecast, by Region 2020 & 2033
- Table 9: Global Chromatography Resins Market Revenue Million Forecast, by Origin 2020 & 2033
- Table 10: Global Chromatography Resins Market Volume K Tons Forecast, by Origin 2020 & 2033
- Table 11: Global Chromatography Resins Market Revenue Million Forecast, by Technology 2020 & 2033
- Table 12: Global Chromatography Resins Market Volume K Tons Forecast, by Technology 2020 & 2033
- Table 13: Global Chromatography Resins Market Revenue Million Forecast, by End-user Industry 2020 & 2033
- Table 14: Global Chromatography Resins Market Volume K Tons Forecast, by End-user Industry 2020 & 2033
- Table 15: Global Chromatography Resins Market Revenue Million Forecast, by Country 2020 & 2033
- Table 16: Global Chromatography Resins Market Volume K Tons Forecast, by Country 2020 & 2033
- Table 17: China Chromatography Resins Market Revenue (Million) Forecast, by Application 2020 & 2033
- Table 18: China Chromatography Resins Market Volume (K Tons) Forecast, by Application 2020 & 2033
- Table 19: India Chromatography Resins Market Revenue (Million) Forecast, by Application 2020 & 2033
- Table 20: India Chromatography Resins Market Volume (K Tons) Forecast, by Application 2020 & 2033
- Table 21: Japan Chromatography Resins Market Revenue (Million) Forecast, by Application 2020 & 2033
- Table 22: Japan Chromatography Resins Market Volume (K Tons) Forecast, by Application 2020 & 2033
- Table 23: Rest of Asia Pacific Chromatography Resins Market Revenue (Million) Forecast, by Application 2020 & 2033
- Table 24: Rest of Asia Pacific Chromatography Resins Market Volume (K Tons) Forecast, by Application 2020 & 2033
- Table 25: Global Chromatography Resins Market Revenue Million Forecast, by Origin 2020 & 2033
- Table 26: Global Chromatography Resins Market Volume K Tons Forecast, by Origin 2020 & 2033
- Table 27: Global Chromatography Resins Market Revenue Million Forecast, by Technology 2020 & 2033
- Table 28: Global Chromatography Resins Market Volume K Tons Forecast, by Technology 2020 & 2033
- Table 29: Global Chromatography Resins Market Revenue Million Forecast, by End-user Industry 2020 & 2033
- Table 30: Global Chromatography Resins Market Volume K Tons Forecast, by End-user Industry 2020 & 2033
- Table 31: Global Chromatography Resins Market Revenue Million Forecast, by Country 2020 & 2033
- Table 32: Global Chromatography Resins Market Volume K Tons Forecast, by Country 2020 & 2033
- Table 33: United States Chromatography Resins Market Revenue (Million) Forecast, by Application 2020 & 2033
- Table 34: United States Chromatography Resins Market Volume (K Tons) Forecast, by Application 2020 & 2033
- Table 35: Canada Chromatography Resins Market Revenue (Million) Forecast, by Application 2020 & 2033
- Table 36: Canada Chromatography Resins Market Volume (K Tons) Forecast, by Application 2020 & 2033
- Table 37: Mexico Chromatography Resins Market Revenue (Million) Forecast, by Application 2020 & 2033
- Table 38: Mexico Chromatography Resins Market Volume (K Tons) Forecast, by Application 2020 & 2033
- Table 39: Global Chromatography Resins Market Revenue Million Forecast, by Origin 2020 & 2033
- Table 40: Global Chromatography Resins Market Volume K Tons Forecast, by Origin 2020 & 2033
- Table 41: Global Chromatography Resins Market Revenue Million Forecast, by Technology 2020 & 2033
- Table 42: Global Chromatography Resins Market Volume K Tons Forecast, by Technology 2020 & 2033
- Table 43: Global Chromatography Resins Market Revenue Million Forecast, by End-user Industry 2020 & 2033
- Table 44: Global Chromatography Resins Market Volume K Tons Forecast, by End-user Industry 2020 & 2033
- Table 45: Global Chromatography Resins Market Revenue Million Forecast, by Country 2020 & 2033
- Table 46: Global Chromatography Resins Market Volume K Tons Forecast, by Country 2020 & 2033
- Table 47: Germany Chromatography Resins Market Revenue (Million) Forecast, by Application 2020 & 2033
- Table 48: Germany Chromatography Resins Market Volume (K Tons) Forecast, by Application 2020 & 2033
- Table 49: United Kingdom Chromatography Resins Market Revenue (Million) Forecast, by Application 2020 & 2033
- Table 50: United Kingdom Chromatography Resins Market Volume (K Tons) Forecast, by Application 2020 & 2033
- Table 51: Italy Chromatography Resins Market Revenue (Million) Forecast, by Application 2020 & 2033
- Table 52: Italy Chromatography Resins Market Volume (K Tons) Forecast, by Application 2020 & 2033
- Table 53: France Chromatography Resins Market Revenue (Million) Forecast, by Application 2020 & 2033
- Table 54: France Chromatography Resins Market Volume (K Tons) Forecast, by Application 2020 & 2033
- Table 55: Switzerland Chromatography Resins Market Revenue (Million) Forecast, by Application 2020 & 2033
- Table 56: Switzerland Chromatography Resins Market Volume (K Tons) Forecast, by Application 2020 & 2033
- Table 57: Rest of Europe Chromatography Resins Market Revenue (Million) Forecast, by Application 2020 & 2033
- Table 58: Rest of Europe Chromatography Resins Market Volume (K Tons) Forecast, by Application 2020 & 2033
- Table 59: Global Chromatography Resins Market Revenue Million Forecast, by Origin 2020 & 2033
- Table 60: Global Chromatography Resins Market Volume K Tons Forecast, by Origin 2020 & 2033
- Table 61: Global Chromatography Resins Market Revenue Million Forecast, by Technology 2020 & 2033
- Table 62: Global Chromatography Resins Market Volume K Tons Forecast, by Technology 2020 & 2033
- Table 63: Global Chromatography Resins Market Revenue Million Forecast, by End-user Industry 2020 & 2033
- Table 64: Global Chromatography Resins Market Volume K Tons Forecast, by End-user Industry 2020 & 2033
- Table 65: Global Chromatography Resins Market Revenue Million Forecast, by Country 2020 & 2033
- Table 66: Global Chromatography Resins Market Volume K Tons Forecast, by Country 2020 & 2033
- Table 67: South America Chromatography Resins Market Revenue (Million) Forecast, by Application 2020 & 2033
- Table 68: South America Chromatography Resins Market Volume (K Tons) Forecast, by Application 2020 & 2033
- Table 69: Middle East and Africa Chromatography Resins Market Revenue (Million) Forecast, by Application 2020 & 2033
- Table 70: Middle East and Africa Chromatography Resins Market Volume (K Tons) Forecast, by Application 2020 & 2033
Frequently Asked Questions
1. What is the projected Compound Annual Growth Rate (CAGR) of the Chromatography Resins Market?
The projected CAGR is approximately > 7.00%.
2. Which companies are prominent players in the Chromatography Resins Market?
Key companies in the market include Repligen Corporation, General Electric, Bio-Rad Laboratories Inc, Merck KGaA, Mitsubishi Chemical Corporation, Dupont, Perkinelmer Inc, Pall Corporation, Tosoh Bioscience LLC*List Not Exhaustive, Purolite, Agilient Technologies, Avantor Inc, Thermo Fisher Scientific.
3. What are the main segments of the Chromatography Resins Market?
The market segments include Origin, Technology, End-user Industry.
4. Can you provide details about the market size?
The market size is estimated to be USD 2480 Million as of 2022.
5. What are some drivers contributing to market growth?
; Rising Demand from the Pharmaceutical Sector; Technological Advancements in Chromatography Resins; Increasing Importance of Chromatography Tests in Drug Approvals.
6. What are the notable trends driving market growth?
Increasing Demand from Pharmaceutical Sector.
7. Are there any restraints impacting market growth?
; Lack of Professional Expertise in the Emerging Countries; High Costs vs. Productivity of Chromatography Systems.
8. Can you provide examples of recent developments in the market?
In 2021, Repligen Corporation acquired Pall Corporation's Chromatography and Filtration business. In 2022, Thermo Fisher Scientific launched a new line of chromatography resins designed for high-throughput biopharmaceutical purification.
9. What pricing options are available for accessing the report?
Pricing options include single-user, multi-user, and enterprise licenses priced at USD 4750, USD 5250, and USD 8750 respectively.
10. Is the market size provided in terms of value or volume?
The market size is provided in terms of value, measured in Million and volume, measured in K Tons.
11. Are there any specific market keywords associated with the report?
Yes, the market keyword associated with the report is "Chromatography Resins Market," which aids in identifying and referencing the specific market segment covered.
12. How do I determine which pricing option suits my needs best?
The pricing options vary based on user requirements and access needs. Individual users may opt for single-user licenses, while businesses requiring broader access may choose multi-user or enterprise licenses for cost-effective access to the report.
13. Are there any additional resources or data provided in the Chromatography Resins Market report?
While the report offers comprehensive insights, it's advisable to review the specific contents or supplementary materials provided to ascertain if additional resources or data are available.
14. How can I stay updated on further developments or reports in the Chromatography Resins Market?
To stay informed about further developments, trends, and reports in the Chromatography Resins Market, consider subscribing to industry newsletters, following relevant companies and organizations, or regularly checking reputable industry news sources and publications.
Methodology
Step 1 - Identification of Relevant Samples Size from Population Database


Step 2 - Approaches for Defining Global Market Size (Value, Volume* & Price*)

Note*: In applicable scenarios
Step 3 - Data Sources
Primary Research
- Web Analytics
- Survey Reports
- Research Institute
- Latest Research Reports
- Opinion Leaders
Secondary Research
- Annual Reports
- White Paper
- Latest Press Release
- Industry Association
- Paid Database
- Investor Presentations

Step 4 - Data Triangulation
Involves using different sources of information in order to increase the validity of a study
These sources are likely to be stakeholders in a program - participants, other researchers, program staff, other community members, and so on.
Then we put all data in single framework & apply various statistical tools to find out the dynamic on the market.
During the analysis stage, feedback from the stakeholder groups would be compared to determine areas of agreement as well as areas of divergence