

Key Insights
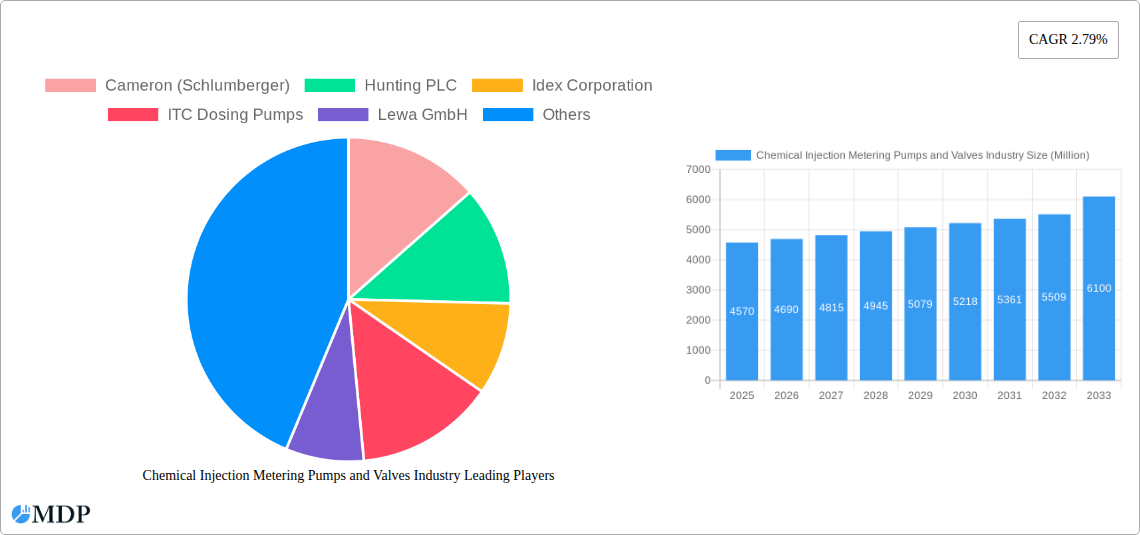
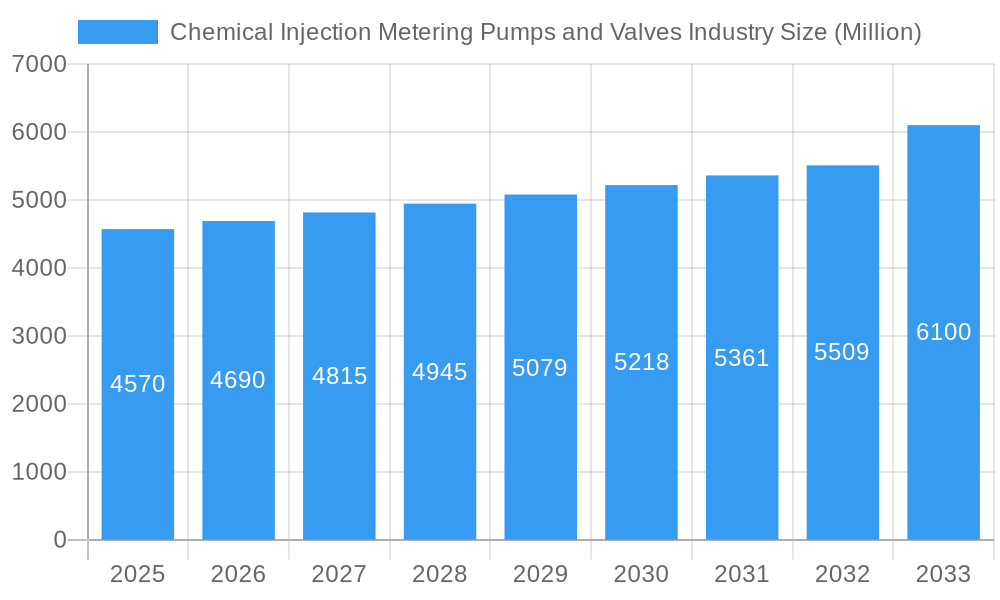
The Chemical Injection Metering Pumps and Valves market is a significant segment within the broader process automation and chemical processing industries, exhibiting steady growth. With a 2025 market size of $4.57 billion and a compound annual growth rate (CAGR) of 2.79% projected from 2025 to 2033, the market is expected to reach approximately $6.1 billion by 2033. This growth is fueled by several key factors. Increasing demand for precise chemical injection in various sectors, including oil and gas, water treatment, and power generation, drives adoption. Furthermore, stringent environmental regulations necessitate precise chemical dosing for emission control and waste management, contributing significantly to market expansion. Advancements in pump technology, including the development of smart pumps with improved accuracy, efficiency, and remote monitoring capabilities, are further propelling market growth. The market is segmented based on pump type (diaphragm, piston, peristaltic, etc.), valve type (ball, butterfly, globe, etc.), application (oil & gas, water treatment, chemical processing, etc.), and end-user industry. Competition is intense, with a mix of established multinational corporations and specialized manufacturers vying for market share. Companies like Cameron (Schlumberger), Hunting PLC, and others continuously innovate to offer advanced solutions.
Chemical Injection Metering Pumps and Valves Industry Market Size (In Billion)
Despite the positive growth outlook, market expansion faces certain challenges. Fluctuations in raw material prices and the economic cycles within the end-user industries can impact market demand. Furthermore, technological advancements require continuous investment in research and development to maintain competitiveness. Despite these restraints, the long-term outlook remains positive, driven by the sustained need for precise and reliable chemical injection across diverse sectors. The market’s growth trajectory is expected to remain consistent, propelled by ongoing technological innovations and increasing regulatory pressures. The market's growth will be geographically diverse, with regions experiencing varying rates of growth depending on industrial development and infrastructure investment.
Chemical Injection Metering Pumps and Valves Industry Company Market Share
Chemical Injection Metering Pumps and Valves Industry: A Comprehensive Market Report (2019-2033)
This in-depth report provides a comprehensive analysis of the Chemical Injection Metering Pumps and Valves industry, offering invaluable insights for stakeholders seeking to navigate this dynamic market. The study covers the period 2019-2033, with a focus on the forecast period 2025-2033 and a base year of 2025. The report leverages extensive data analysis to project a market size of $xx Million by 2033, revealing crucial growth trends and opportunities.
Chemical Injection Metering Pumps and Valves Industry Market Dynamics & Concentration
The Chemical Injection Metering Pumps and Valves market is characterized by a moderately concentrated landscape, with several key players vying for market share. The industry is experiencing significant innovation driven by the need for precise chemical injection in various applications, including oil & gas, water treatment, and chemical processing. Stringent regulatory frameworks regarding emissions and safety standards are shaping industry practices. The emergence of alternative technologies, while limited, presents a degree of substitutability. End-user trends indicate a growing preference for energy-efficient and digitally connected solutions. M&A activity in the sector has been moderate, with approximately xx deals recorded between 2019 and 2024, resulting in some shifts in market share. Key players such as Cameron (Schlumberger), Hunting PLC, and SPX FLOW Inc. maintain significant market positions, collectively holding an estimated xx% of the market share in 2024.
Chemical Injection Metering Pumps and Valves Industry Industry Trends & Analysis
The Chemical Injection Metering Pumps and Valves market is poised for robust growth, with a projected CAGR of xx% during the forecast period (2025-2033). This growth is fueled by several factors. The increasing demand for efficient and precise chemical injection across various industries is a major driver. Technological disruptions, particularly the integration of advanced automation and digital technologies, are enhancing pump performance, reliability, and operational efficiency. This trend is further supported by growing consumer preference for sustainable and environmentally friendly solutions. The market is also witnessing intensified competitive dynamics, with players focusing on product innovation, strategic partnerships, and geographical expansion to capture market share. The market penetration of smart metering pumps is steadily increasing, with an estimated xx% penetration rate in 2024, and expected to reach xx% by 2033.
Leading Markets & Segments in Chemical Injection Metering Pumps and Valves Industry
The North American region currently holds a dominant position in the Chemical Injection Metering Pumps and Valves market, driven by a robust industrial landscape, increasingly stringent environmental regulations, and substantial investments in critical infrastructure projects. This leadership is further bolstered by its advanced technological infrastructure and the established presence of key industry players.
- Key Drivers in North America:
- Sustained and strong demand from the vital oil and gas sector for efficient and precise chemical delivery.
- Mandatory compliance with stringent environmental regulations, necessitating advanced and reliable wastewater treatment solutions.
- Significant and ongoing investments in upgrading and expanding water infrastructure projects, ensuring safe and efficient water management.
While North America leads, the Asia-Pacific region is emerging as a powerhouse of rapid growth. This expansion is fueled by accelerating industrialization and urbanization across key economies like China and India. The region is poised for considerable market expansion in the coming years, underpinned by robust economic growth and significant capital infusion into infrastructure development. Within specific market segments, the demand for high-pressure pumps is witnessing a notable surge, primarily attributed to the dynamic needs of the energy sector.
Chemical Injection Metering Pumps and Valves Industry Product Developments
Recent product innovations have focused on enhancing precision, efficiency, and safety features in metering pumps and valves. The integration of advanced control systems, smart sensors, and predictive maintenance capabilities is becoming commonplace. These advancements improve operational efficiency, reduce downtime, and minimize environmental impact. New materials with enhanced corrosion resistance are also being used to extend the lifespan of these components and meet the demanding requirements of various applications.
Key Drivers of Chemical Injection Metering Pumps and Valves Industry Growth
The sustained growth trajectory of the Chemical Injection Metering Pumps and Valves industry is a result of a powerful interplay of diverse factors. At its core, the escalating demand for highly precise chemical injection across a broad spectrum of industrial processes, particularly within the demanding environments of oil and gas extraction and critical water treatment operations, serves as a primary growth catalyst. Furthermore, the imperative to comply with increasingly stringent environmental regulations, which mandate exact chemical dosing to minimize ecological impact, is actively contributing to market expansion. Technological advancements, including the widespread adoption of smart metering technologies for enhanced control and data acquisition, and the development of advanced materials for improved durability and performance, are significantly enhancing product efficiency and unwavering reliability. Lastly, substantial and ongoing investments in large-scale infrastructure projects across numerous global regions are consistently creating significant and lucrative opportunities for market growth.
Challenges in the Chemical Injection Metering Pumps and Valves Industry Market
The Chemical Injection Metering Pumps and Valves industry faces several challenges. Fluctuations in raw material prices and supply chain disruptions can significantly impact manufacturing costs and profitability. Intense competition from established and emerging players necessitates continuous innovation and cost optimization strategies. Moreover, stringent regulatory compliance requirements can impose additional financial burdens on manufacturers. The estimated impact of these challenges resulted in a xx% decrease in profit margins in 2024 compared to 2023.
Emerging Opportunities in Chemical Injection Metering Pumps and Valves Industry
Significant long-term growth opportunities exist for players who can leverage technological breakthroughs in areas like IoT integration and advanced materials science. Strategic partnerships with technology providers and end-users can create innovative solutions and access wider market segments. Furthermore, expansion into emerging markets with growing industrial sectors and infrastructure development presents lucrative avenues for future growth.
Leading Players in the Chemical Injection Metering Pumps and Valves Industry Sector
- Cameron (Schlumberger)
- Hunting PLC
- Idex Corporation
- ITC Dosing Pumps
- Lewa GmbH
- McFarland-Tritan LLC
- Milton Roy
- ProMinent
- Seepex GmbH
- Seko SpA
- SkoFlo Industries Inc
- SPX FLOW Inc
- Swelore Engineering Pvt Ltd
- List Not Exhaustive
Key Milestones in Chemical Injection Metering Pumps and Valves Industry Industry
- 2020: SPX FLOW Inc. unveiled an innovative new line of highly energy-efficient metering pumps, setting new benchmarks for operational cost savings and environmental responsibility.
- 2021: A significant strategic merger occurred between two prominent smaller players in the dynamic European market, consolidating expertise and expanding market reach.
- 2022: Lewa GmbH launched a groundbreaking digitally connected metering pump, integrating advanced predictive maintenance capabilities for enhanced uptime and reduced service intervals.
- 2023: ProMinent made substantial R&D investments specifically focused on the development and integration of sustainable materials, underscoring a commitment to environmental stewardship.
- 2024: New regulatory changes enacted in the United States began to impact the production methodologies and material sourcing for certain critical pump components, driving industry adaptation.
Strategic Outlook for Chemical Injection Metering Pumps and Valves Industry Market
The future trajectory for the Chemical Injection Metering Pumps and Valves market is exceptionally promising, marked by sustained growth and evolving industry dynamics. Continuous technological innovation, the strategic expansion into novel and emerging applications, and robust growth in developing economies are collectively anticipated to fuel significant market expansion. Companies that proactively prioritize sustainability initiatives, embrace digitalization for enhanced operational efficiency and data-driven decision-making, and forge strategic partnerships will be ideally positioned to not only capitalize on burgeoning opportunities but also to solidify and maintain a commanding competitive advantage within this rapidly evolving and dynamic industry landscape.
Chemical Injection Metering Pumps and Valves Industry Segmentation
-
1. Pump Type
- 1.1. Diaphragm
- 1.2. Piston/Plunger
- 1.3. Other Pump Types
-
2. End-user Industry
- 2.1. Energy, Power, and Chemicals
- 2.2. Oil and Gas
- 2.3. Water and Wastewater Treatment
- 2.4. Food and Beverage
- 2.5. Pharmaceutical
Chemical Injection Metering Pumps and Valves Industry Segmentation By Geography
-
1. Asia Pacific
- 1.1. China
- 1.2. India
- 1.3. Japan
- 1.4. South Korea
- 1.5. ASEAN Countries
- 1.6. Australia and New Zealand
- 1.7. Rest of Asia Pacific
-
2. North America
- 2.1. United States
- 2.2. Canada
- 2.3. Mexico
-
3. Europe
- 3.1. Germany
- 3.2. United Kingdom
- 3.3. Italy
- 3.4. France
- 3.5. Russia
- 3.6. Spain
- 3.7. Rest of Europe
-
4. South America
- 4.1. Brazil
- 4.2. Argentina
- 4.3. Rest of South America
-
5. Middle East and Africa
- 5.1. Saudi Arabia
- 5.2. South Africa
- 5.3. Rest of Middle East and Africa
Chemical Injection Metering Pumps and Valves Industry Regional Market Share
Geographic Coverage of Chemical Injection Metering Pumps and Valves Industry
Chemical Injection Metering Pumps and Valves Industry REPORT HIGHLIGHTS
| Aspects | Details |
|---|---|
| Study Period | 2020-2034 |
| Base Year | 2025 |
| Estimated Year | 2026 |
| Forecast Period | 2026-2034 |
| Historical Period | 2020-2025 |
| Growth Rate | CAGR of 2.79% from 2020-2034 |
| Segmentation |
|
Table of Contents
- 1. Introduction
- 1.1. Research Scope
- 1.2. Market Segmentation
- 1.3. Research Objective
- 1.4. Definitions and Assumptions
- 2. Executive Summary
- 2.1. Market Snapshot
- 3. Market Dynamics
- 3.1. Market Drivers
- 3.2. Market Restrains
- 3.3. Market Trends
- 3.4. Market Opportunities
- 4. Market Factor Analysis
- 4.1. Porters Five Forces
- 4.1.1. Bargaining Power of Suppliers
- 4.1.2. Bargaining Power of Buyers
- 4.1.3. Threat of New Entrants
- 4.1.4. Threat of Substitutes
- 4.1.5. Competitive Rivalry
- 4.2. PESTEL analysis
- 4.3. BCG Analysis
- 4.3.1. Stars (High Growth, High Market Share)
- 4.3.2. Cash Cows (Low Growth, High Market Share)
- 4.3.3. Question Mark (High Growth, Low Market Share)
- 4.3.4. Dogs (Low Growth, Low Market Share)
- 4.4. Ansoff Matrix Analysis
- 4.5. Supply Chain Analysis
- 4.6. Regulatory Landscape
- 4.7. Current Market Potential and Opportunity Assessment (TAM–SAM–SOM Framework)
- 4.8. MDP Analyst Note
- 4.1. Porters Five Forces
- 5. Market Analysis, Insights and Forecast 2021-2033
- 5.1. Market Analysis, Insights and Forecast - by Pump Type
- 5.1.1. Diaphragm
- 5.1.2. Piston/Plunger
- 5.1.3. Other Pump Types
- 5.2. Market Analysis, Insights and Forecast - by End-user Industry
- 5.2.1. Energy, Power, and Chemicals
- 5.2.2. Oil and Gas
- 5.2.3. Water and Wastewater Treatment
- 5.2.4. Food and Beverage
- 5.2.5. Pharmaceutical
- 5.3. Market Analysis, Insights and Forecast - by Region
- 5.3.1. Asia Pacific
- 5.3.2. North America
- 5.3.3. Europe
- 5.3.4. South America
- 5.3.5. Middle East and Africa
- 5.1. Market Analysis, Insights and Forecast - by Pump Type
- 6. Global Chemical Injection Metering Pumps and Valves Industry Analysis, Insights and Forecast, 2021-2033
- 6.1. Market Analysis, Insights and Forecast - by Pump Type
- 6.1.1. Diaphragm
- 6.1.2. Piston/Plunger
- 6.1.3. Other Pump Types
- 6.2. Market Analysis, Insights and Forecast - by End-user Industry
- 6.2.1. Energy, Power, and Chemicals
- 6.2.2. Oil and Gas
- 6.2.3. Water and Wastewater Treatment
- 6.2.4. Food and Beverage
- 6.2.5. Pharmaceutical
- 6.1. Market Analysis, Insights and Forecast - by Pump Type
- 7. Asia Pacific Chemical Injection Metering Pumps and Valves Industry Analysis, Insights and Forecast, 2020-2032
- 7.1. Market Analysis, Insights and Forecast - by Pump Type
- 7.1.1. Diaphragm
- 7.1.2. Piston/Plunger
- 7.1.3. Other Pump Types
- 7.2. Market Analysis, Insights and Forecast - by End-user Industry
- 7.2.1. Energy, Power, and Chemicals
- 7.2.2. Oil and Gas
- 7.2.3. Water and Wastewater Treatment
- 7.2.4. Food and Beverage
- 7.2.5. Pharmaceutical
- 7.1. Market Analysis, Insights and Forecast - by Pump Type
- 8. North America Chemical Injection Metering Pumps and Valves Industry Analysis, Insights and Forecast, 2020-2032
- 8.1. Market Analysis, Insights and Forecast - by Pump Type
- 8.1.1. Diaphragm
- 8.1.2. Piston/Plunger
- 8.1.3. Other Pump Types
- 8.2. Market Analysis, Insights and Forecast - by End-user Industry
- 8.2.1. Energy, Power, and Chemicals
- 8.2.2. Oil and Gas
- 8.2.3. Water and Wastewater Treatment
- 8.2.4. Food and Beverage
- 8.2.5. Pharmaceutical
- 8.1. Market Analysis, Insights and Forecast - by Pump Type
- 9. Europe Chemical Injection Metering Pumps and Valves Industry Analysis, Insights and Forecast, 2020-2032
- 9.1. Market Analysis, Insights and Forecast - by Pump Type
- 9.1.1. Diaphragm
- 9.1.2. Piston/Plunger
- 9.1.3. Other Pump Types
- 9.2. Market Analysis, Insights and Forecast - by End-user Industry
- 9.2.1. Energy, Power, and Chemicals
- 9.2.2. Oil and Gas
- 9.2.3. Water and Wastewater Treatment
- 9.2.4. Food and Beverage
- 9.2.5. Pharmaceutical
- 9.1. Market Analysis, Insights and Forecast - by Pump Type
- 10. South America Chemical Injection Metering Pumps and Valves Industry Analysis, Insights and Forecast, 2020-2032
- 10.1. Market Analysis, Insights and Forecast - by Pump Type
- 10.1.1. Diaphragm
- 10.1.2. Piston/Plunger
- 10.1.3. Other Pump Types
- 10.2. Market Analysis, Insights and Forecast - by End-user Industry
- 10.2.1. Energy, Power, and Chemicals
- 10.2.2. Oil and Gas
- 10.2.3. Water and Wastewater Treatment
- 10.2.4. Food and Beverage
- 10.2.5. Pharmaceutical
- 10.1. Market Analysis, Insights and Forecast - by Pump Type
- 11. Middle East and Africa Chemical Injection Metering Pumps and Valves Industry Analysis, Insights and Forecast, 2020-2032
- 11.1. Market Analysis, Insights and Forecast - by Pump Type
- 11.1.1. Diaphragm
- 11.1.2. Piston/Plunger
- 11.1.3. Other Pump Types
- 11.2. Market Analysis, Insights and Forecast - by End-user Industry
- 11.2.1. Energy, Power, and Chemicals
- 11.2.2. Oil and Gas
- 11.2.3. Water and Wastewater Treatment
- 11.2.4. Food and Beverage
- 11.2.5. Pharmaceutical
- 11.1. Market Analysis, Insights and Forecast - by Pump Type
- 12. Competitive Analysis
- 12.1. Company Profiles
- 12.1.1 Cameron (Schlumberger)
- 12.1.1.1. Company Overview
- 12.1.1.2. Products
- 12.1.1.3. Company Financials
- 12.1.1.4. SWOT Analysis
- 12.1.2 Hunting PLC
- 12.1.2.1. Company Overview
- 12.1.2.2. Products
- 12.1.2.3. Company Financials
- 12.1.2.4. SWOT Analysis
- 12.1.3 Idex Corporation
- 12.1.3.1. Company Overview
- 12.1.3.2. Products
- 12.1.3.3. Company Financials
- 12.1.3.4. SWOT Analysis
- 12.1.4 ITC Dosing Pumps
- 12.1.4.1. Company Overview
- 12.1.4.2. Products
- 12.1.4.3. Company Financials
- 12.1.4.4. SWOT Analysis
- 12.1.5 Lewa GmbH
- 12.1.5.1. Company Overview
- 12.1.5.2. Products
- 12.1.5.3. Company Financials
- 12.1.5.4. SWOT Analysis
- 12.1.6 McFarland-Tritan LLC
- 12.1.6.1. Company Overview
- 12.1.6.2. Products
- 12.1.6.3. Company Financials
- 12.1.6.4. SWOT Analysis
- 12.1.7 Milton Roy
- 12.1.7.1. Company Overview
- 12.1.7.2. Products
- 12.1.7.3. Company Financials
- 12.1.7.4. SWOT Analysis
- 12.1.8 ProMinent
- 12.1.8.1. Company Overview
- 12.1.8.2. Products
- 12.1.8.3. Company Financials
- 12.1.8.4. SWOT Analysis
- 12.1.9 Seepex GmbH
- 12.1.9.1. Company Overview
- 12.1.9.2. Products
- 12.1.9.3. Company Financials
- 12.1.9.4. SWOT Analysis
- 12.1.10 Seko SpA
- 12.1.10.1. Company Overview
- 12.1.10.2. Products
- 12.1.10.3. Company Financials
- 12.1.10.4. SWOT Analysis
- 12.1.11 SkoFlo Industries Inc
- 12.1.11.1. Company Overview
- 12.1.11.2. Products
- 12.1.11.3. Company Financials
- 12.1.11.4. SWOT Analysis
- 12.1.12 SPX FLOW Inc
- 12.1.12.1. Company Overview
- 12.1.12.2. Products
- 12.1.12.3. Company Financials
- 12.1.12.4. SWOT Analysis
- 12.1.13 Swelore Engineering Pvt Ltd *List Not Exhaustive
- 12.1.13.1. Company Overview
- 12.1.13.2. Products
- 12.1.13.3. Company Financials
- 12.1.13.4. SWOT Analysis
- 12.1.1 Cameron (Schlumberger)
- 12.2. Market Entropy
- 12.2.1 Company's Key Areas Served
- 12.2.2 Recent Developments
- 12.3. Company Market Share Analysis 2025
- 12.3.1 Top 5 Companies Market Share Analysis
- 12.3.2 Top 3 Companies Market Share Analysis
- 12.4. List of Potential Customers
- 13. Research Methodology
List of Figures
- Figure 1: Global Chemical Injection Metering Pumps and Valves Industry Revenue Breakdown (Million, %) by Region 2025 & 2033
- Figure 2: Global Chemical Injection Metering Pumps and Valves Industry Volume Breakdown (Billion, %) by Region 2025 & 2033
- Figure 3: Asia Pacific Chemical Injection Metering Pumps and Valves Industry Revenue (Million), by Pump Type 2025 & 2033
- Figure 4: Asia Pacific Chemical Injection Metering Pumps and Valves Industry Volume (Billion), by Pump Type 2025 & 2033
- Figure 5: Asia Pacific Chemical Injection Metering Pumps and Valves Industry Revenue Share (%), by Pump Type 2025 & 2033
- Figure 6: Asia Pacific Chemical Injection Metering Pumps and Valves Industry Volume Share (%), by Pump Type 2025 & 2033
- Figure 7: Asia Pacific Chemical Injection Metering Pumps and Valves Industry Revenue (Million), by End-user Industry 2025 & 2033
- Figure 8: Asia Pacific Chemical Injection Metering Pumps and Valves Industry Volume (Billion), by End-user Industry 2025 & 2033
- Figure 9: Asia Pacific Chemical Injection Metering Pumps and Valves Industry Revenue Share (%), by End-user Industry 2025 & 2033
- Figure 10: Asia Pacific Chemical Injection Metering Pumps and Valves Industry Volume Share (%), by End-user Industry 2025 & 2033
- Figure 11: Asia Pacific Chemical Injection Metering Pumps and Valves Industry Revenue (Million), by Country 2025 & 2033
- Figure 12: Asia Pacific Chemical Injection Metering Pumps and Valves Industry Volume (Billion), by Country 2025 & 2033
- Figure 13: Asia Pacific Chemical Injection Metering Pumps and Valves Industry Revenue Share (%), by Country 2025 & 2033
- Figure 14: Asia Pacific Chemical Injection Metering Pumps and Valves Industry Volume Share (%), by Country 2025 & 2033
- Figure 15: North America Chemical Injection Metering Pumps and Valves Industry Revenue (Million), by Pump Type 2025 & 2033
- Figure 16: North America Chemical Injection Metering Pumps and Valves Industry Volume (Billion), by Pump Type 2025 & 2033
- Figure 17: North America Chemical Injection Metering Pumps and Valves Industry Revenue Share (%), by Pump Type 2025 & 2033
- Figure 18: North America Chemical Injection Metering Pumps and Valves Industry Volume Share (%), by Pump Type 2025 & 2033
- Figure 19: North America Chemical Injection Metering Pumps and Valves Industry Revenue (Million), by End-user Industry 2025 & 2033
- Figure 20: North America Chemical Injection Metering Pumps and Valves Industry Volume (Billion), by End-user Industry 2025 & 2033
- Figure 21: North America Chemical Injection Metering Pumps and Valves Industry Revenue Share (%), by End-user Industry 2025 & 2033
- Figure 22: North America Chemical Injection Metering Pumps and Valves Industry Volume Share (%), by End-user Industry 2025 & 2033
- Figure 23: North America Chemical Injection Metering Pumps and Valves Industry Revenue (Million), by Country 2025 & 2033
- Figure 24: North America Chemical Injection Metering Pumps and Valves Industry Volume (Billion), by Country 2025 & 2033
- Figure 25: North America Chemical Injection Metering Pumps and Valves Industry Revenue Share (%), by Country 2025 & 2033
- Figure 26: North America Chemical Injection Metering Pumps and Valves Industry Volume Share (%), by Country 2025 & 2033
- Figure 27: Europe Chemical Injection Metering Pumps and Valves Industry Revenue (Million), by Pump Type 2025 & 2033
- Figure 28: Europe Chemical Injection Metering Pumps and Valves Industry Volume (Billion), by Pump Type 2025 & 2033
- Figure 29: Europe Chemical Injection Metering Pumps and Valves Industry Revenue Share (%), by Pump Type 2025 & 2033
- Figure 30: Europe Chemical Injection Metering Pumps and Valves Industry Volume Share (%), by Pump Type 2025 & 2033
- Figure 31: Europe Chemical Injection Metering Pumps and Valves Industry Revenue (Million), by End-user Industry 2025 & 2033
- Figure 32: Europe Chemical Injection Metering Pumps and Valves Industry Volume (Billion), by End-user Industry 2025 & 2033
- Figure 33: Europe Chemical Injection Metering Pumps and Valves Industry Revenue Share (%), by End-user Industry 2025 & 2033
- Figure 34: Europe Chemical Injection Metering Pumps and Valves Industry Volume Share (%), by End-user Industry 2025 & 2033
- Figure 35: Europe Chemical Injection Metering Pumps and Valves Industry Revenue (Million), by Country 2025 & 2033
- Figure 36: Europe Chemical Injection Metering Pumps and Valves Industry Volume (Billion), by Country 2025 & 2033
- Figure 37: Europe Chemical Injection Metering Pumps and Valves Industry Revenue Share (%), by Country 2025 & 2033
- Figure 38: Europe Chemical Injection Metering Pumps and Valves Industry Volume Share (%), by Country 2025 & 2033
- Figure 39: South America Chemical Injection Metering Pumps and Valves Industry Revenue (Million), by Pump Type 2025 & 2033
- Figure 40: South America Chemical Injection Metering Pumps and Valves Industry Volume (Billion), by Pump Type 2025 & 2033
- Figure 41: South America Chemical Injection Metering Pumps and Valves Industry Revenue Share (%), by Pump Type 2025 & 2033
- Figure 42: South America Chemical Injection Metering Pumps and Valves Industry Volume Share (%), by Pump Type 2025 & 2033
- Figure 43: South America Chemical Injection Metering Pumps and Valves Industry Revenue (Million), by End-user Industry 2025 & 2033
- Figure 44: South America Chemical Injection Metering Pumps and Valves Industry Volume (Billion), by End-user Industry 2025 & 2033
- Figure 45: South America Chemical Injection Metering Pumps and Valves Industry Revenue Share (%), by End-user Industry 2025 & 2033
- Figure 46: South America Chemical Injection Metering Pumps and Valves Industry Volume Share (%), by End-user Industry 2025 & 2033
- Figure 47: South America Chemical Injection Metering Pumps and Valves Industry Revenue (Million), by Country 2025 & 2033
- Figure 48: South America Chemical Injection Metering Pumps and Valves Industry Volume (Billion), by Country 2025 & 2033
- Figure 49: South America Chemical Injection Metering Pumps and Valves Industry Revenue Share (%), by Country 2025 & 2033
- Figure 50: South America Chemical Injection Metering Pumps and Valves Industry Volume Share (%), by Country 2025 & 2033
- Figure 51: Middle East and Africa Chemical Injection Metering Pumps and Valves Industry Revenue (Million), by Pump Type 2025 & 2033
- Figure 52: Middle East and Africa Chemical Injection Metering Pumps and Valves Industry Volume (Billion), by Pump Type 2025 & 2033
- Figure 53: Middle East and Africa Chemical Injection Metering Pumps and Valves Industry Revenue Share (%), by Pump Type 2025 & 2033
- Figure 54: Middle East and Africa Chemical Injection Metering Pumps and Valves Industry Volume Share (%), by Pump Type 2025 & 2033
- Figure 55: Middle East and Africa Chemical Injection Metering Pumps and Valves Industry Revenue (Million), by End-user Industry 2025 & 2033
- Figure 56: Middle East and Africa Chemical Injection Metering Pumps and Valves Industry Volume (Billion), by End-user Industry 2025 & 2033
- Figure 57: Middle East and Africa Chemical Injection Metering Pumps and Valves Industry Revenue Share (%), by End-user Industry 2025 & 2033
- Figure 58: Middle East and Africa Chemical Injection Metering Pumps and Valves Industry Volume Share (%), by End-user Industry 2025 & 2033
- Figure 59: Middle East and Africa Chemical Injection Metering Pumps and Valves Industry Revenue (Million), by Country 2025 & 2033
- Figure 60: Middle East and Africa Chemical Injection Metering Pumps and Valves Industry Volume (Billion), by Country 2025 & 2033
- Figure 61: Middle East and Africa Chemical Injection Metering Pumps and Valves Industry Revenue Share (%), by Country 2025 & 2033
- Figure 62: Middle East and Africa Chemical Injection Metering Pumps and Valves Industry Volume Share (%), by Country 2025 & 2033
List of Tables
- Table 1: Global Chemical Injection Metering Pumps and Valves Industry Revenue Million Forecast, by Pump Type 2020 & 2033
- Table 2: Global Chemical Injection Metering Pumps and Valves Industry Volume Billion Forecast, by Pump Type 2020 & 2033
- Table 3: Global Chemical Injection Metering Pumps and Valves Industry Revenue Million Forecast, by End-user Industry 2020 & 2033
- Table 4: Global Chemical Injection Metering Pumps and Valves Industry Volume Billion Forecast, by End-user Industry 2020 & 2033
- Table 5: Global Chemical Injection Metering Pumps and Valves Industry Revenue Million Forecast, by Region 2020 & 2033
- Table 6: Global Chemical Injection Metering Pumps and Valves Industry Volume Billion Forecast, by Region 2020 & 2033
- Table 7: Global Chemical Injection Metering Pumps and Valves Industry Revenue Million Forecast, by Pump Type 2020 & 2033
- Table 8: Global Chemical Injection Metering Pumps and Valves Industry Volume Billion Forecast, by Pump Type 2020 & 2033
- Table 9: Global Chemical Injection Metering Pumps and Valves Industry Revenue Million Forecast, by End-user Industry 2020 & 2033
- Table 10: Global Chemical Injection Metering Pumps and Valves Industry Volume Billion Forecast, by End-user Industry 2020 & 2033
- Table 11: Global Chemical Injection Metering Pumps and Valves Industry Revenue Million Forecast, by Country 2020 & 2033
- Table 12: Global Chemical Injection Metering Pumps and Valves Industry Volume Billion Forecast, by Country 2020 & 2033
- Table 13: China Chemical Injection Metering Pumps and Valves Industry Revenue (Million) Forecast, by Application 2020 & 2033
- Table 14: China Chemical Injection Metering Pumps and Valves Industry Volume (Billion) Forecast, by Application 2020 & 2033
- Table 15: India Chemical Injection Metering Pumps and Valves Industry Revenue (Million) Forecast, by Application 2020 & 2033
- Table 16: India Chemical Injection Metering Pumps and Valves Industry Volume (Billion) Forecast, by Application 2020 & 2033
- Table 17: Japan Chemical Injection Metering Pumps and Valves Industry Revenue (Million) Forecast, by Application 2020 & 2033
- Table 18: Japan Chemical Injection Metering Pumps and Valves Industry Volume (Billion) Forecast, by Application 2020 & 2033
- Table 19: South Korea Chemical Injection Metering Pumps and Valves Industry Revenue (Million) Forecast, by Application 2020 & 2033
- Table 20: South Korea Chemical Injection Metering Pumps and Valves Industry Volume (Billion) Forecast, by Application 2020 & 2033
- Table 21: ASEAN Countries Chemical Injection Metering Pumps and Valves Industry Revenue (Million) Forecast, by Application 2020 & 2033
- Table 22: ASEAN Countries Chemical Injection Metering Pumps and Valves Industry Volume (Billion) Forecast, by Application 2020 & 2033
- Table 23: Australia and New Zealand Chemical Injection Metering Pumps and Valves Industry Revenue (Million) Forecast, by Application 2020 & 2033
- Table 24: Australia and New Zealand Chemical Injection Metering Pumps and Valves Industry Volume (Billion) Forecast, by Application 2020 & 2033
- Table 25: Rest of Asia Pacific Chemical Injection Metering Pumps and Valves Industry Revenue (Million) Forecast, by Application 2020 & 2033
- Table 26: Rest of Asia Pacific Chemical Injection Metering Pumps and Valves Industry Volume (Billion) Forecast, by Application 2020 & 2033
- Table 27: Global Chemical Injection Metering Pumps and Valves Industry Revenue Million Forecast, by Pump Type 2020 & 2033
- Table 28: Global Chemical Injection Metering Pumps and Valves Industry Volume Billion Forecast, by Pump Type 2020 & 2033
- Table 29: Global Chemical Injection Metering Pumps and Valves Industry Revenue Million Forecast, by End-user Industry 2020 & 2033
- Table 30: Global Chemical Injection Metering Pumps and Valves Industry Volume Billion Forecast, by End-user Industry 2020 & 2033
- Table 31: Global Chemical Injection Metering Pumps and Valves Industry Revenue Million Forecast, by Country 2020 & 2033
- Table 32: Global Chemical Injection Metering Pumps and Valves Industry Volume Billion Forecast, by Country 2020 & 2033
- Table 33: United States Chemical Injection Metering Pumps and Valves Industry Revenue (Million) Forecast, by Application 2020 & 2033
- Table 34: United States Chemical Injection Metering Pumps and Valves Industry Volume (Billion) Forecast, by Application 2020 & 2033
- Table 35: Canada Chemical Injection Metering Pumps and Valves Industry Revenue (Million) Forecast, by Application 2020 & 2033
- Table 36: Canada Chemical Injection Metering Pumps and Valves Industry Volume (Billion) Forecast, by Application 2020 & 2033
- Table 37: Mexico Chemical Injection Metering Pumps and Valves Industry Revenue (Million) Forecast, by Application 2020 & 2033
- Table 38: Mexico Chemical Injection Metering Pumps and Valves Industry Volume (Billion) Forecast, by Application 2020 & 2033
- Table 39: Global Chemical Injection Metering Pumps and Valves Industry Revenue Million Forecast, by Pump Type 2020 & 2033
- Table 40: Global Chemical Injection Metering Pumps and Valves Industry Volume Billion Forecast, by Pump Type 2020 & 2033
- Table 41: Global Chemical Injection Metering Pumps and Valves Industry Revenue Million Forecast, by End-user Industry 2020 & 2033
- Table 42: Global Chemical Injection Metering Pumps and Valves Industry Volume Billion Forecast, by End-user Industry 2020 & 2033
- Table 43: Global Chemical Injection Metering Pumps and Valves Industry Revenue Million Forecast, by Country 2020 & 2033
- Table 44: Global Chemical Injection Metering Pumps and Valves Industry Volume Billion Forecast, by Country 2020 & 2033
- Table 45: Germany Chemical Injection Metering Pumps and Valves Industry Revenue (Million) Forecast, by Application 2020 & 2033
- Table 46: Germany Chemical Injection Metering Pumps and Valves Industry Volume (Billion) Forecast, by Application 2020 & 2033
- Table 47: United Kingdom Chemical Injection Metering Pumps and Valves Industry Revenue (Million) Forecast, by Application 2020 & 2033
- Table 48: United Kingdom Chemical Injection Metering Pumps and Valves Industry Volume (Billion) Forecast, by Application 2020 & 2033
- Table 49: Italy Chemical Injection Metering Pumps and Valves Industry Revenue (Million) Forecast, by Application 2020 & 2033
- Table 50: Italy Chemical Injection Metering Pumps and Valves Industry Volume (Billion) Forecast, by Application 2020 & 2033
- Table 51: France Chemical Injection Metering Pumps and Valves Industry Revenue (Million) Forecast, by Application 2020 & 2033
- Table 52: France Chemical Injection Metering Pumps and Valves Industry Volume (Billion) Forecast, by Application 2020 & 2033
- Table 53: Russia Chemical Injection Metering Pumps and Valves Industry Revenue (Million) Forecast, by Application 2020 & 2033
- Table 54: Russia Chemical Injection Metering Pumps and Valves Industry Volume (Billion) Forecast, by Application 2020 & 2033
- Table 55: Spain Chemical Injection Metering Pumps and Valves Industry Revenue (Million) Forecast, by Application 2020 & 2033
- Table 56: Spain Chemical Injection Metering Pumps and Valves Industry Volume (Billion) Forecast, by Application 2020 & 2033
- Table 57: Rest of Europe Chemical Injection Metering Pumps and Valves Industry Revenue (Million) Forecast, by Application 2020 & 2033
- Table 58: Rest of Europe Chemical Injection Metering Pumps and Valves Industry Volume (Billion) Forecast, by Application 2020 & 2033
- Table 59: Global Chemical Injection Metering Pumps and Valves Industry Revenue Million Forecast, by Pump Type 2020 & 2033
- Table 60: Global Chemical Injection Metering Pumps and Valves Industry Volume Billion Forecast, by Pump Type 2020 & 2033
- Table 61: Global Chemical Injection Metering Pumps and Valves Industry Revenue Million Forecast, by End-user Industry 2020 & 2033
- Table 62: Global Chemical Injection Metering Pumps and Valves Industry Volume Billion Forecast, by End-user Industry 2020 & 2033
- Table 63: Global Chemical Injection Metering Pumps and Valves Industry Revenue Million Forecast, by Country 2020 & 2033
- Table 64: Global Chemical Injection Metering Pumps and Valves Industry Volume Billion Forecast, by Country 2020 & 2033
- Table 65: Brazil Chemical Injection Metering Pumps and Valves Industry Revenue (Million) Forecast, by Application 2020 & 2033
- Table 66: Brazil Chemical Injection Metering Pumps and Valves Industry Volume (Billion) Forecast, by Application 2020 & 2033
- Table 67: Argentina Chemical Injection Metering Pumps and Valves Industry Revenue (Million) Forecast, by Application 2020 & 2033
- Table 68: Argentina Chemical Injection Metering Pumps and Valves Industry Volume (Billion) Forecast, by Application 2020 & 2033
- Table 69: Rest of South America Chemical Injection Metering Pumps and Valves Industry Revenue (Million) Forecast, by Application 2020 & 2033
- Table 70: Rest of South America Chemical Injection Metering Pumps and Valves Industry Volume (Billion) Forecast, by Application 2020 & 2033
- Table 71: Global Chemical Injection Metering Pumps and Valves Industry Revenue Million Forecast, by Pump Type 2020 & 2033
- Table 72: Global Chemical Injection Metering Pumps and Valves Industry Volume Billion Forecast, by Pump Type 2020 & 2033
- Table 73: Global Chemical Injection Metering Pumps and Valves Industry Revenue Million Forecast, by End-user Industry 2020 & 2033
- Table 74: Global Chemical Injection Metering Pumps and Valves Industry Volume Billion Forecast, by End-user Industry 2020 & 2033
- Table 75: Global Chemical Injection Metering Pumps and Valves Industry Revenue Million Forecast, by Country 2020 & 2033
- Table 76: Global Chemical Injection Metering Pumps and Valves Industry Volume Billion Forecast, by Country 2020 & 2033
- Table 77: Saudi Arabia Chemical Injection Metering Pumps and Valves Industry Revenue (Million) Forecast, by Application 2020 & 2033
- Table 78: Saudi Arabia Chemical Injection Metering Pumps and Valves Industry Volume (Billion) Forecast, by Application 2020 & 2033
- Table 79: South Africa Chemical Injection Metering Pumps and Valves Industry Revenue (Million) Forecast, by Application 2020 & 2033
- Table 80: South Africa Chemical Injection Metering Pumps and Valves Industry Volume (Billion) Forecast, by Application 2020 & 2033
- Table 81: Rest of Middle East and Africa Chemical Injection Metering Pumps and Valves Industry Revenue (Million) Forecast, by Application 2020 & 2033
- Table 82: Rest of Middle East and Africa Chemical Injection Metering Pumps and Valves Industry Volume (Billion) Forecast, by Application 2020 & 2033
Frequently Asked Questions
1. What is the projected Compound Annual Growth Rate (CAGR) of the Chemical Injection Metering Pumps and Valves Industry?
The projected CAGR is approximately 2.79%.
2. Which companies are prominent players in the Chemical Injection Metering Pumps and Valves Industry?
Key companies in the market include Cameron (Schlumberger), Hunting PLC, Idex Corporation, ITC Dosing Pumps, Lewa GmbH, McFarland-Tritan LLC, Milton Roy, ProMinent, Seepex GmbH, Seko SpA, SkoFlo Industries Inc, SPX FLOW Inc, Swelore Engineering Pvt Ltd *List Not Exhaustive.
3. What are the main segments of the Chemical Injection Metering Pumps and Valves Industry?
The market segments include Pump Type, End-user Industry.
4. Can you provide details about the market size?
The market size is estimated to be USD 4.57 Million as of 2022.
5. What are some drivers contributing to market growth?
Accelerating Demand from Wastewater Treatment Applications; Robust Operational Procedures for Regulating Environmental Concerns; Other Drivers.
6. What are the notable trends driving market growth?
Energy. Power. and Chemicals to Dominate the Market.
7. Are there any restraints impacting market growth?
Accelerating Demand from Wastewater Treatment Applications; Robust Operational Procedures for Regulating Environmental Concerns; Other Drivers.
8. Can you provide examples of recent developments in the market?
9. What pricing options are available for accessing the report?
Pricing options include single-user, multi-user, and enterprise licenses priced at USD 4750, USD 5250, and USD 8750 respectively.
10. Is the market size provided in terms of value or volume?
The market size is provided in terms of value, measured in Million and volume, measured in Billion.
11. Are there any specific market keywords associated with the report?
Yes, the market keyword associated with the report is "Chemical Injection Metering Pumps and Valves Industry," which aids in identifying and referencing the specific market segment covered.
12. How do I determine which pricing option suits my needs best?
The pricing options vary based on user requirements and access needs. Individual users may opt for single-user licenses, while businesses requiring broader access may choose multi-user or enterprise licenses for cost-effective access to the report.
13. Are there any additional resources or data provided in the Chemical Injection Metering Pumps and Valves Industry report?
While the report offers comprehensive insights, it's advisable to review the specific contents or supplementary materials provided to ascertain if additional resources or data are available.
14. How can I stay updated on further developments or reports in the Chemical Injection Metering Pumps and Valves Industry?
To stay informed about further developments, trends, and reports in the Chemical Injection Metering Pumps and Valves Industry, consider subscribing to industry newsletters, following relevant companies and organizations, or regularly checking reputable industry news sources and publications.
Methodology
Step 1 - Identification of Relevant Samples Size from Population Database


Step 2 - Approaches for Defining Global Market Size (Value, Volume* & Price*)

Note*: In applicable scenarios
Step 3 - Data Sources
Primary Research
- Web Analytics
- Survey Reports
- Research Institute
- Latest Research Reports
- Opinion Leaders
Secondary Research
- Annual Reports
- White Paper
- Latest Press Release
- Industry Association
- Paid Database
- Investor Presentations

Step 4 - Data Triangulation
Involves using different sources of information in order to increase the validity of a study
These sources are likely to be stakeholders in a program - participants, other researchers, program staff, other community members, and so on.
Then we put all data in single framework & apply various statistical tools to find out the dynamic on the market.
During the analysis stage, feedback from the stakeholder groups would be compared to determine areas of agreement as well as areas of divergence