

Key Insights
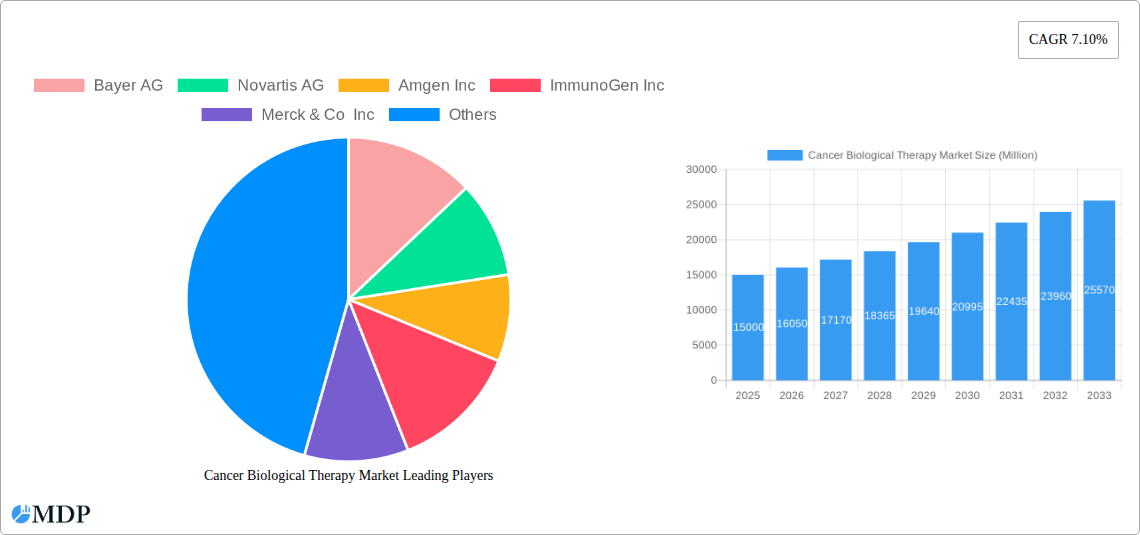
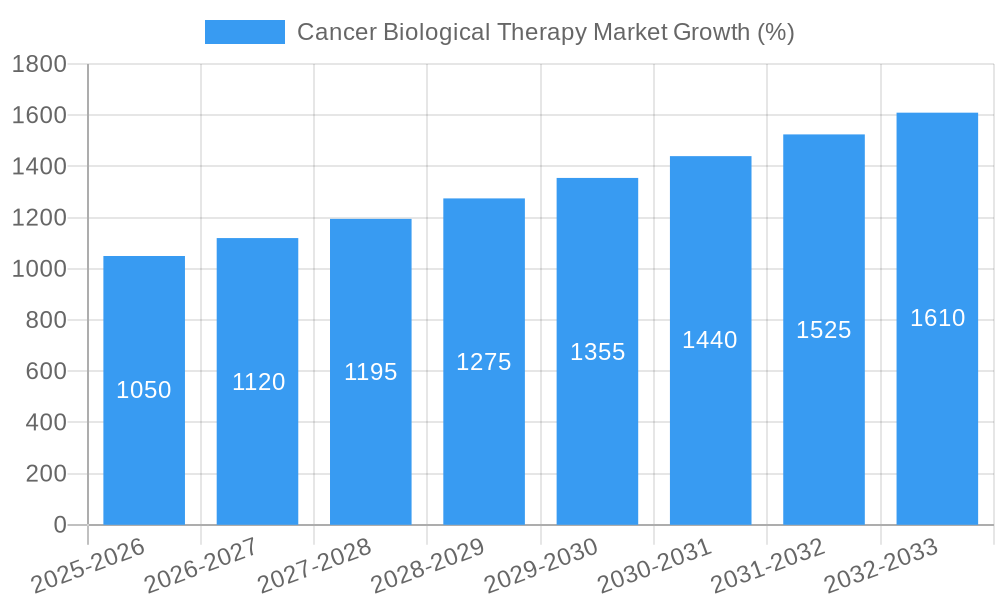
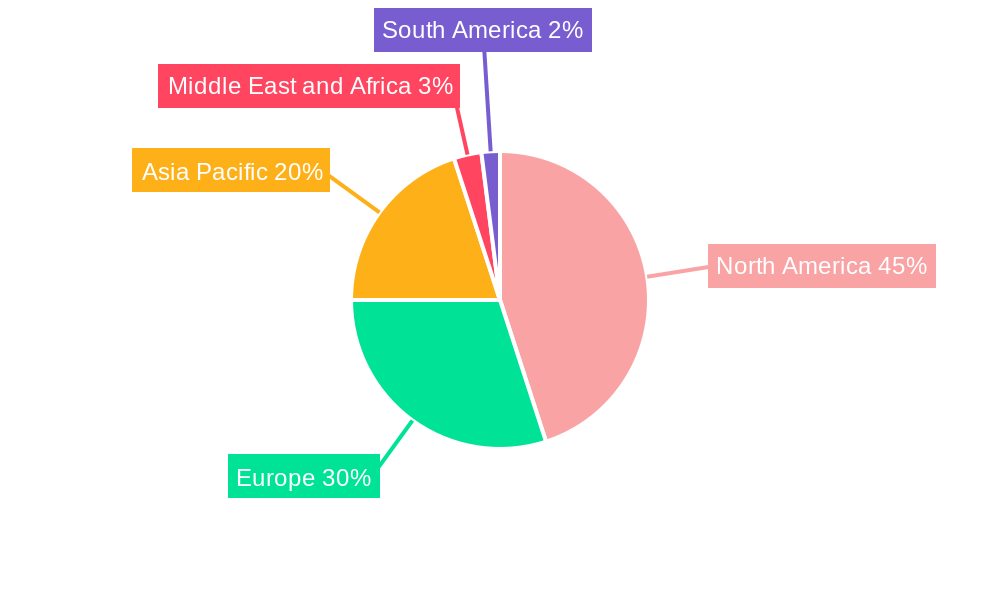
The global cancer biological therapy market is experiencing robust growth, driven by rising cancer incidence rates, an aging population, and the increasing prevalence of advanced cancers requiring sophisticated treatment options. The market's Compound Annual Growth Rate (CAGR) of 7.10% from 2019 to 2024 suggests a significant expansion, projected to continue into the forecast period (2025-2033). Key therapeutic segments include small molecule drugs, monoclonal antibodies, and immunotherapies, each exhibiting substantial growth potential due to continuous advancements in research and development leading to improved efficacy and safety profiles. Lung, breast, and colorectal cancers represent the largest segments by cancer type, reflecting their high prevalence and the effectiveness of biological therapies in these areas. Major players such as Bayer AG, Novartis AG, and Amgen Inc. are driving innovation and market competition through extensive R&D investments and strategic partnerships. The North American market currently holds a significant share, attributed to advanced healthcare infrastructure, high adoption rates of novel therapies, and substantial investments in cancer research. However, Asia-Pacific is anticipated to witness significant growth in the coming years, fueled by increasing healthcare expenditure and rising awareness regarding advanced cancer treatments. The market faces certain restraints, including high treatment costs, potential side effects, and varying reimbursement policies across different regions. Nevertheless, ongoing research efforts focused on personalized medicine and targeted therapies are poised to mitigate these challenges and further propel market expansion.
The competitive landscape is marked by both large pharmaceutical companies and emerging biotech firms, contributing to a dynamic market characterized by continuous innovation and expanding therapeutic options. Growth is further supported by government initiatives promoting cancer research and improved access to advanced medical care. The forecast period of 2025-2033 anticipates sustained market expansion, driven by several factors including increased investment in R&D, expansion into emerging markets, and the development of novel combination therapies offering improved patient outcomes. Segmentation by end-user (hospitals, cancer centers, specialty clinics) reflects the diverse settings where these therapies are administered, each contributing to the overall market growth trajectory. While precise market size figures for 2025 and beyond require more specific data, extrapolating from the provided CAGR and considering industry trends allows for a reasonable estimation of continuous growth within the market.
Cancer Biological Therapy Market: A Comprehensive Report (2019-2033)
This comprehensive report provides an in-depth analysis of the global Cancer Biological Therapy market, offering valuable insights for stakeholders across the pharmaceutical, healthcare, and investment sectors. The market is projected to reach xx Million by 2033, exhibiting a CAGR of xx% during the forecast period (2025-2033). This report covers the historical period (2019-2024), with 2025 serving as the base and estimated year. Key players such as Bayer AG, Novartis AG, Amgen Inc, and others are analyzed for their market strategies and competitive landscape. This study segments the market by therapy type (Small Molecule Drugs, Monoclonal Antibodies, Immunotherapies, Others), cancer type (Lung Cancer, Breast Cancer, Colorectal Cancer, Blood Cancer, Gynecologic Cancer, Others), and end-user (Hospitals, Cancer and Radiation Therapy Centers, Specialty Clinics).
Cancer Biological Therapy Market Market Dynamics & Concentration
The Cancer Biological Therapy market is characterized by high concentration among a few major players, with the top 5 companies holding approximately xx% of the market share in 2025. Market dynamics are shaped by continuous innovation in drug development, stringent regulatory frameworks demanding rigorous clinical trials, and the emergence of targeted therapies and immunotherapies as substitutes for traditional chemotherapy. End-user trends show a shift towards personalized medicine, driving demand for advanced diagnostic tools and tailored treatment plans. The historical period (2019-2024) witnessed xx M&A deals, primarily focused on acquiring promising pipeline assets and expanding geographical reach. This trend is anticipated to continue, further consolidating the market landscape.
- Market Concentration: High, with top 5 players controlling xx% of the market share (2025).
- Innovation Drivers: Development of targeted therapies, immunotherapies, and personalized medicine approaches.
- Regulatory Frameworks: Stringent FDA approvals and global regulatory landscapes impact market entry and timelines.
- Product Substitutes: Traditional chemotherapy, radiation therapy, and surgery remain competitive alternatives.
- End-User Trends: Increasing demand for personalized medicine and advanced treatment options.
- M&A Activities: xx M&A deals in 2019-2024, driven by portfolio expansion and technology acquisition.
Cancer Biological Therapy Market Industry Trends & Analysis
The Cancer Biological Therapy market is experiencing robust growth, driven by increasing cancer incidence globally, rising healthcare expenditure, and advancements in biotechnology. The market's growth trajectory is influenced by technological disruptions, including the development of novel drug delivery systems, AI-driven drug discovery, and advanced diagnostic tools. Consumer preferences are increasingly aligned with personalized treatment plans offering minimal side effects and improved efficacy. Competitive dynamics are characterized by intense R&D investments, strategic partnerships, and the introduction of first-in-class therapies. This market is expected to witness a compound annual growth rate (CAGR) of xx% between 2025 and 2033, with a significant market penetration rate for novel therapies in developed countries.
Leading Markets & Segments in Cancer Biological Therapy Market
The North American region dominates the Cancer Biological Therapy market, driven by higher healthcare expenditure, advanced healthcare infrastructure, and a larger patient pool. Within therapy types, monoclonal antibodies hold the largest market share due to their high efficacy and targeted action. Among cancer types, lung cancer presents the most significant segment, owing to its high prevalence and unmet medical needs. Key drivers for regional dominance include:
North America: High healthcare spending, robust healthcare infrastructure, and early adoption of new therapies.
Europe: Growing awareness of cancer, improving healthcare systems, and increased R&D activities.
Asia-Pacific: Rising incidence rates, expanding healthcare infrastructure, and increasing affordability of treatment.
Therapy Type: Monoclonal antibodies lead the market due to high efficacy.
Cancer Type: Lung Cancer exhibits the largest segment due to high prevalence.
End-User: Hospitals are the primary end-users due to comprehensive infrastructure.
Cancer Biological Therapy Market Product Developments
Recent years have witnessed significant advancements in cancer biological therapies, including the development of antibody-drug conjugates (ADCs), CAR T-cell therapies, and oncolytic viruses. These innovations offer targeted drug delivery, improved efficacy, and reduced side effects compared to conventional chemotherapy. The market is witnessing increasing adoption of personalized medicine approaches, where treatment is tailored to an individual's genetic profile. This trend is supported by ongoing R&D focusing on precision oncology, biomarker discovery, and combination therapies.
Key Drivers of Cancer Biological Therapy Market Growth
Several factors drive market expansion. Firstly, the increasing incidence of cancer globally, particularly in developing countries, fuels demand. Secondly, advancements in biotechnology lead to improved treatment efficacy, targeted drug delivery, and reduced side effects. Thirdly, favorable regulatory environments encourage innovation and market entry of novel therapies. Lastly, rising healthcare expenditure and increased government funding for cancer research support market growth.
Challenges in the Cancer Biological Therapy Market Market
Challenges include high drug development costs, stringent regulatory requirements, and the complexities of clinical trials. The need for prolonged testing, expensive treatments, and potential side effects also limit market penetration. Supply chain disruptions can impact drug availability, while the emergence of biosimilars adds competitive pressure. These factors contribute to high treatment costs and access limitations for many patients.
Emerging Opportunities in Cancer Biological Therapy Market
Emerging opportunities include technological breakthroughs in personalized medicine, immunotherapy, and targeted therapies. Strategic partnerships between pharmaceutical companies and biotech firms accelerate drug discovery and development. Market expansion into untapped regions, particularly in developing economies with rising cancer rates, presents significant growth potential. These factors position the market for sustained, long-term growth.
Leading Players in the Cancer Biological Therapy Market Sector
- Bayer AG
- Novartis AG
- Amgen Inc
- ImmunoGen Inc
- Merck & Co Inc
- F Hoffmann-La Roche Ltd
- Mirati Therapeutics Inc
- GlaxoSmithKline plc
- AstraZeneca plc
- Johnson & Johnson
- Bristol-Myers Squibb Company
- Pfizer Inc
Key Milestones in Cancer Biological Therapy Market Industry
- August 2022: AstraZeneca and Daiichi Sankyo's Enhertu (trastuzumab deruxtecan) received US FDA approval for treating HER2-mutated non-small cell lung cancer (NSCLC). This broadened treatment options for a significant patient population.
- December 2022: Genentech, Inc. received US FDA approval for Tecentriq (atezolizumab) to treat alveolar soft part sarcoma (ASPS) in adults and children. This marked a significant advancement in treating a rare and aggressive cancer.
Strategic Outlook for Cancer Biological Therapy Market Market
The Cancer Biological Therapy market shows strong potential for continued growth, driven by technological advancements, strategic partnerships, and expanding access to treatment. Focusing on personalized medicine, early detection, and novel combination therapies will be key to unlocking further market potential. Companies must invest in R&D, build strategic alliances, and ensure timely market entry to capture opportunities in this dynamic landscape.
Cancer Biological Therapy Market Segmentation
-
1. Therapy Type
- 1.1. Small Molecule Drugs
- 1.2. Monoclonal Antibodies
- 1.3. Immunotherapies
- 1.4. Others
-
2. Cancer Type
- 2.1. Lung Cancer
- 2.2. Breast Cancer
- 2.3. Colorectal Cancer
- 2.4. Blood Cancer
- 2.5. Gynecologic Cancer
- 2.6. Others
-
3. End User
- 3.1. Hospitals
- 3.2. Cancer and Radiation Therapy Centers
- 3.3. Specialty Clinics
Cancer Biological Therapy Market Segmentation By Geography
-
1. North America
- 1.1. United States
- 1.2. Canada
- 1.3. Mexico
-
2. Europe
- 2.1. Germany
- 2.2. United Kingdom
- 2.3. France
- 2.4. Italy
- 2.5. Spain
- 2.6. Rest of Europe
-
3. Asia Pacific
- 3.1. China
- 3.2. Japan
- 3.3. India
- 3.4. Australia
- 3.5. South Korea
- 3.6. Rest of Asia Pacific
-
4. Middle East and Africa
- 4.1. GCC
- 4.2. South Africa
- 4.3. Rest of Middle East and Africa
-
5. South America
- 5.1. Brazil
- 5.2. Argentina
- 5.3. Rest of South America
Cancer Biological Therapy Market REPORT HIGHLIGHTS
| Aspects | Details |
|---|---|
| Study Period | 2019-2033 |
| Base Year | 2024 |
| Estimated Year | 2025 |
| Forecast Period | 2025-2033 |
| Historical Period | 2019-2024 |
| Growth Rate | CAGR of 7.10% from 2019-2033 |
| Segmentation |
|
Table of Contents
- 1. Introduction
- 1.1. Research Scope
- 1.2. Market Segmentation
- 1.3. Research Methodology
- 1.4. Definitions and Assumptions
- 2. Executive Summary
- 2.1. Introduction
- 3. Market Dynamics
- 3.1. Introduction
- 3.2. Market Drivers
- 3.2.1. Increasing Prevalence of Various Type of Cancers; Increasing Investment in Research and Development
- 3.3. Market Restrains
- 3.3.1. High Cost and Side Effects Associated with the Targeted Therapies
- 3.4. Market Trends
- 3.4.1. Breast Cancer Segment is Expected to Register a High CAGR in the Market Over the Forecast Period
- 4. Market Factor Analysis
- 4.1. Porters Five Forces
- 4.2. Supply/Value Chain
- 4.3. PESTEL analysis
- 4.4. Market Entropy
- 4.5. Patent/Trademark Analysis
- 5. Global Cancer Biological Therapy Market Analysis, Insights and Forecast, 2019-2031
- 5.1. Market Analysis, Insights and Forecast - by Therapy Type
- 5.1.1. Small Molecule Drugs
- 5.1.2. Monoclonal Antibodies
- 5.1.3. Immunotherapies
- 5.1.4. Others
- 5.2. Market Analysis, Insights and Forecast - by Cancer Type
- 5.2.1. Lung Cancer
- 5.2.2. Breast Cancer
- 5.2.3. Colorectal Cancer
- 5.2.4. Blood Cancer
- 5.2.5. Gynecologic Cancer
- 5.2.6. Others
- 5.3. Market Analysis, Insights and Forecast - by End User
- 5.3.1. Hospitals
- 5.3.2. Cancer and Radiation Therapy Centers
- 5.3.3. Specialty Clinics
- 5.4. Market Analysis, Insights and Forecast - by Region
- 5.4.1. North America
- 5.4.2. Europe
- 5.4.3. Asia Pacific
- 5.4.4. Middle East and Africa
- 5.4.5. South America
- 5.1. Market Analysis, Insights and Forecast - by Therapy Type
- 6. North America Cancer Biological Therapy Market Analysis, Insights and Forecast, 2019-2031
- 6.1. Market Analysis, Insights and Forecast - by Therapy Type
- 6.1.1. Small Molecule Drugs
- 6.1.2. Monoclonal Antibodies
- 6.1.3. Immunotherapies
- 6.1.4. Others
- 6.2. Market Analysis, Insights and Forecast - by Cancer Type
- 6.2.1. Lung Cancer
- 6.2.2. Breast Cancer
- 6.2.3. Colorectal Cancer
- 6.2.4. Blood Cancer
- 6.2.5. Gynecologic Cancer
- 6.2.6. Others
- 6.3. Market Analysis, Insights and Forecast - by End User
- 6.3.1. Hospitals
- 6.3.2. Cancer and Radiation Therapy Centers
- 6.3.3. Specialty Clinics
- 6.1. Market Analysis, Insights and Forecast - by Therapy Type
- 7. Europe Cancer Biological Therapy Market Analysis, Insights and Forecast, 2019-2031
- 7.1. Market Analysis, Insights and Forecast - by Therapy Type
- 7.1.1. Small Molecule Drugs
- 7.1.2. Monoclonal Antibodies
- 7.1.3. Immunotherapies
- 7.1.4. Others
- 7.2. Market Analysis, Insights and Forecast - by Cancer Type
- 7.2.1. Lung Cancer
- 7.2.2. Breast Cancer
- 7.2.3. Colorectal Cancer
- 7.2.4. Blood Cancer
- 7.2.5. Gynecologic Cancer
- 7.2.6. Others
- 7.3. Market Analysis, Insights and Forecast - by End User
- 7.3.1. Hospitals
- 7.3.2. Cancer and Radiation Therapy Centers
- 7.3.3. Specialty Clinics
- 7.1. Market Analysis, Insights and Forecast - by Therapy Type
- 8. Asia Pacific Cancer Biological Therapy Market Analysis, Insights and Forecast, 2019-2031
- 8.1. Market Analysis, Insights and Forecast - by Therapy Type
- 8.1.1. Small Molecule Drugs
- 8.1.2. Monoclonal Antibodies
- 8.1.3. Immunotherapies
- 8.1.4. Others
- 8.2. Market Analysis, Insights and Forecast - by Cancer Type
- 8.2.1. Lung Cancer
- 8.2.2. Breast Cancer
- 8.2.3. Colorectal Cancer
- 8.2.4. Blood Cancer
- 8.2.5. Gynecologic Cancer
- 8.2.6. Others
- 8.3. Market Analysis, Insights and Forecast - by End User
- 8.3.1. Hospitals
- 8.3.2. Cancer and Radiation Therapy Centers
- 8.3.3. Specialty Clinics
- 8.1. Market Analysis, Insights and Forecast - by Therapy Type
- 9. Middle East and Africa Cancer Biological Therapy Market Analysis, Insights and Forecast, 2019-2031
- 9.1. Market Analysis, Insights and Forecast - by Therapy Type
- 9.1.1. Small Molecule Drugs
- 9.1.2. Monoclonal Antibodies
- 9.1.3. Immunotherapies
- 9.1.4. Others
- 9.2. Market Analysis, Insights and Forecast - by Cancer Type
- 9.2.1. Lung Cancer
- 9.2.2. Breast Cancer
- 9.2.3. Colorectal Cancer
- 9.2.4. Blood Cancer
- 9.2.5. Gynecologic Cancer
- 9.2.6. Others
- 9.3. Market Analysis, Insights and Forecast - by End User
- 9.3.1. Hospitals
- 9.3.2. Cancer and Radiation Therapy Centers
- 9.3.3. Specialty Clinics
- 9.1. Market Analysis, Insights and Forecast - by Therapy Type
- 10. South America Cancer Biological Therapy Market Analysis, Insights and Forecast, 2019-2031
- 10.1. Market Analysis, Insights and Forecast - by Therapy Type
- 10.1.1. Small Molecule Drugs
- 10.1.2. Monoclonal Antibodies
- 10.1.3. Immunotherapies
- 10.1.4. Others
- 10.2. Market Analysis, Insights and Forecast - by Cancer Type
- 10.2.1. Lung Cancer
- 10.2.2. Breast Cancer
- 10.2.3. Colorectal Cancer
- 10.2.4. Blood Cancer
- 10.2.5. Gynecologic Cancer
- 10.2.6. Others
- 10.3. Market Analysis, Insights and Forecast - by End User
- 10.3.1. Hospitals
- 10.3.2. Cancer and Radiation Therapy Centers
- 10.3.3. Specialty Clinics
- 10.1. Market Analysis, Insights and Forecast - by Therapy Type
- 11. North America Cancer Biological Therapy Market Analysis, Insights and Forecast, 2019-2031
- 11.1. Market Analysis, Insights and Forecast - By Country/Sub-region
- 11.1.1 United States
- 11.1.2 Canada
- 11.1.3 Mexico
- 12. Europe Cancer Biological Therapy Market Analysis, Insights and Forecast, 2019-2031
- 12.1. Market Analysis, Insights and Forecast - By Country/Sub-region
- 12.1.1 Germany
- 12.1.2 United Kingdom
- 12.1.3 France
- 12.1.4 Italy
- 12.1.5 Spain
- 12.1.6 Rest of Europe
- 13. Asia Pacific Cancer Biological Therapy Market Analysis, Insights and Forecast, 2019-2031
- 13.1. Market Analysis, Insights and Forecast - By Country/Sub-region
- 13.1.1 China
- 13.1.2 Japan
- 13.1.3 India
- 13.1.4 Australia
- 13.1.5 South Korea
- 13.1.6 Rest of Asia Pacific
- 14. Middle East and Africa Cancer Biological Therapy Market Analysis, Insights and Forecast, 2019-2031
- 14.1. Market Analysis, Insights and Forecast - By Country/Sub-region
- 14.1.1 GCC
- 14.1.2 South Africa
- 14.1.3 Rest of Middle East and Africa
- 15. South America Cancer Biological Therapy Market Analysis, Insights and Forecast, 2019-2031
- 15.1. Market Analysis, Insights and Forecast - By Country/Sub-region
- 15.1.1 Brazil
- 15.1.2 Argentina
- 15.1.3 Rest of South America
- 16. Competitive Analysis
- 16.1. Global Market Share Analysis 2024
- 16.2. Company Profiles
- 16.2.1 Bayer AG
- 16.2.1.1. Overview
- 16.2.1.2. Products
- 16.2.1.3. SWOT Analysis
- 16.2.1.4. Recent Developments
- 16.2.1.5. Financials (Based on Availability)
- 16.2.2 Novartis AG
- 16.2.2.1. Overview
- 16.2.2.2. Products
- 16.2.2.3. SWOT Analysis
- 16.2.2.4. Recent Developments
- 16.2.2.5. Financials (Based on Availability)
- 16.2.3 Amgen Inc
- 16.2.3.1. Overview
- 16.2.3.2. Products
- 16.2.3.3. SWOT Analysis
- 16.2.3.4. Recent Developments
- 16.2.3.5. Financials (Based on Availability)
- 16.2.4 ImmunoGen Inc
- 16.2.4.1. Overview
- 16.2.4.2. Products
- 16.2.4.3. SWOT Analysis
- 16.2.4.4. Recent Developments
- 16.2.4.5. Financials (Based on Availability)
- 16.2.5 Merck & Co Inc
- 16.2.5.1. Overview
- 16.2.5.2. Products
- 16.2.5.3. SWOT Analysis
- 16.2.5.4. Recent Developments
- 16.2.5.5. Financials (Based on Availability)
- 16.2.6 F Hoffmann-La Roche Ltd
- 16.2.6.1. Overview
- 16.2.6.2. Products
- 16.2.6.3. SWOT Analysis
- 16.2.6.4. Recent Developments
- 16.2.6.5. Financials (Based on Availability)
- 16.2.7 Mirati Therapeutics Inc
- 16.2.7.1. Overview
- 16.2.7.2. Products
- 16.2.7.3. SWOT Analysis
- 16.2.7.4. Recent Developments
- 16.2.7.5. Financials (Based on Availability)
- 16.2.8 GlaxoSmithKline plc
- 16.2.8.1. Overview
- 16.2.8.2. Products
- 16.2.8.3. SWOT Analysis
- 16.2.8.4. Recent Developments
- 16.2.8.5. Financials (Based on Availability)
- 16.2.9 AstraZeneca plc
- 16.2.9.1. Overview
- 16.2.9.2. Products
- 16.2.9.3. SWOT Analysis
- 16.2.9.4. Recent Developments
- 16.2.9.5. Financials (Based on Availability)
- 16.2.10 Johnson & Johnson
- 16.2.10.1. Overview
- 16.2.10.2. Products
- 16.2.10.3. SWOT Analysis
- 16.2.10.4. Recent Developments
- 16.2.10.5. Financials (Based on Availability)
- 16.2.11 Bristol-Myers Squibb Company
- 16.2.11.1. Overview
- 16.2.11.2. Products
- 16.2.11.3. SWOT Analysis
- 16.2.11.4. Recent Developments
- 16.2.11.5. Financials (Based on Availability)
- 16.2.12 Pfizer Inc
- 16.2.12.1. Overview
- 16.2.12.2. Products
- 16.2.12.3. SWOT Analysis
- 16.2.12.4. Recent Developments
- 16.2.12.5. Financials (Based on Availability)
- 16.2.1 Bayer AG
List of Figures
- Figure 1: Global Cancer Biological Therapy Market Revenue Breakdown (Million, %) by Region 2024 & 2032
- Figure 2: Global Cancer Biological Therapy Market Volume Breakdown (K Unit, %) by Region 2024 & 2032
- Figure 3: North America Cancer Biological Therapy Market Revenue (Million), by Country 2024 & 2032
- Figure 4: North America Cancer Biological Therapy Market Volume (K Unit), by Country 2024 & 2032
- Figure 5: North America Cancer Biological Therapy Market Revenue Share (%), by Country 2024 & 2032
- Figure 6: North America Cancer Biological Therapy Market Volume Share (%), by Country 2024 & 2032
- Figure 7: Europe Cancer Biological Therapy Market Revenue (Million), by Country 2024 & 2032
- Figure 8: Europe Cancer Biological Therapy Market Volume (K Unit), by Country 2024 & 2032
- Figure 9: Europe Cancer Biological Therapy Market Revenue Share (%), by Country 2024 & 2032
- Figure 10: Europe Cancer Biological Therapy Market Volume Share (%), by Country 2024 & 2032
- Figure 11: Asia Pacific Cancer Biological Therapy Market Revenue (Million), by Country 2024 & 2032
- Figure 12: Asia Pacific Cancer Biological Therapy Market Volume (K Unit), by Country 2024 & 2032
- Figure 13: Asia Pacific Cancer Biological Therapy Market Revenue Share (%), by Country 2024 & 2032
- Figure 14: Asia Pacific Cancer Biological Therapy Market Volume Share (%), by Country 2024 & 2032
- Figure 15: Middle East and Africa Cancer Biological Therapy Market Revenue (Million), by Country 2024 & 2032
- Figure 16: Middle East and Africa Cancer Biological Therapy Market Volume (K Unit), by Country 2024 & 2032
- Figure 17: Middle East and Africa Cancer Biological Therapy Market Revenue Share (%), by Country 2024 & 2032
- Figure 18: Middle East and Africa Cancer Biological Therapy Market Volume Share (%), by Country 2024 & 2032
- Figure 19: South America Cancer Biological Therapy Market Revenue (Million), by Country 2024 & 2032
- Figure 20: South America Cancer Biological Therapy Market Volume (K Unit), by Country 2024 & 2032
- Figure 21: South America Cancer Biological Therapy Market Revenue Share (%), by Country 2024 & 2032
- Figure 22: South America Cancer Biological Therapy Market Volume Share (%), by Country 2024 & 2032
- Figure 23: North America Cancer Biological Therapy Market Revenue (Million), by Therapy Type 2024 & 2032
- Figure 24: North America Cancer Biological Therapy Market Volume (K Unit), by Therapy Type 2024 & 2032
- Figure 25: North America Cancer Biological Therapy Market Revenue Share (%), by Therapy Type 2024 & 2032
- Figure 26: North America Cancer Biological Therapy Market Volume Share (%), by Therapy Type 2024 & 2032
- Figure 27: North America Cancer Biological Therapy Market Revenue (Million), by Cancer Type 2024 & 2032
- Figure 28: North America Cancer Biological Therapy Market Volume (K Unit), by Cancer Type 2024 & 2032
- Figure 29: North America Cancer Biological Therapy Market Revenue Share (%), by Cancer Type 2024 & 2032
- Figure 30: North America Cancer Biological Therapy Market Volume Share (%), by Cancer Type 2024 & 2032
- Figure 31: North America Cancer Biological Therapy Market Revenue (Million), by End User 2024 & 2032
- Figure 32: North America Cancer Biological Therapy Market Volume (K Unit), by End User 2024 & 2032
- Figure 33: North America Cancer Biological Therapy Market Revenue Share (%), by End User 2024 & 2032
- Figure 34: North America Cancer Biological Therapy Market Volume Share (%), by End User 2024 & 2032
- Figure 35: North America Cancer Biological Therapy Market Revenue (Million), by Country 2024 & 2032
- Figure 36: North America Cancer Biological Therapy Market Volume (K Unit), by Country 2024 & 2032
- Figure 37: North America Cancer Biological Therapy Market Revenue Share (%), by Country 2024 & 2032
- Figure 38: North America Cancer Biological Therapy Market Volume Share (%), by Country 2024 & 2032
- Figure 39: Europe Cancer Biological Therapy Market Revenue (Million), by Therapy Type 2024 & 2032
- Figure 40: Europe Cancer Biological Therapy Market Volume (K Unit), by Therapy Type 2024 & 2032
- Figure 41: Europe Cancer Biological Therapy Market Revenue Share (%), by Therapy Type 2024 & 2032
- Figure 42: Europe Cancer Biological Therapy Market Volume Share (%), by Therapy Type 2024 & 2032
- Figure 43: Europe Cancer Biological Therapy Market Revenue (Million), by Cancer Type 2024 & 2032
- Figure 44: Europe Cancer Biological Therapy Market Volume (K Unit), by Cancer Type 2024 & 2032
- Figure 45: Europe Cancer Biological Therapy Market Revenue Share (%), by Cancer Type 2024 & 2032
- Figure 46: Europe Cancer Biological Therapy Market Volume Share (%), by Cancer Type 2024 & 2032
- Figure 47: Europe Cancer Biological Therapy Market Revenue (Million), by End User 2024 & 2032
- Figure 48: Europe Cancer Biological Therapy Market Volume (K Unit), by End User 2024 & 2032
- Figure 49: Europe Cancer Biological Therapy Market Revenue Share (%), by End User 2024 & 2032
- Figure 50: Europe Cancer Biological Therapy Market Volume Share (%), by End User 2024 & 2032
- Figure 51: Europe Cancer Biological Therapy Market Revenue (Million), by Country 2024 & 2032
- Figure 52: Europe Cancer Biological Therapy Market Volume (K Unit), by Country 2024 & 2032
- Figure 53: Europe Cancer Biological Therapy Market Revenue Share (%), by Country 2024 & 2032
- Figure 54: Europe Cancer Biological Therapy Market Volume Share (%), by Country 2024 & 2032
- Figure 55: Asia Pacific Cancer Biological Therapy Market Revenue (Million), by Therapy Type 2024 & 2032
- Figure 56: Asia Pacific Cancer Biological Therapy Market Volume (K Unit), by Therapy Type 2024 & 2032
- Figure 57: Asia Pacific Cancer Biological Therapy Market Revenue Share (%), by Therapy Type 2024 & 2032
- Figure 58: Asia Pacific Cancer Biological Therapy Market Volume Share (%), by Therapy Type 2024 & 2032
- Figure 59: Asia Pacific Cancer Biological Therapy Market Revenue (Million), by Cancer Type 2024 & 2032
- Figure 60: Asia Pacific Cancer Biological Therapy Market Volume (K Unit), by Cancer Type 2024 & 2032
- Figure 61: Asia Pacific Cancer Biological Therapy Market Revenue Share (%), by Cancer Type 2024 & 2032
- Figure 62: Asia Pacific Cancer Biological Therapy Market Volume Share (%), by Cancer Type 2024 & 2032
- Figure 63: Asia Pacific Cancer Biological Therapy Market Revenue (Million), by End User 2024 & 2032
- Figure 64: Asia Pacific Cancer Biological Therapy Market Volume (K Unit), by End User 2024 & 2032
- Figure 65: Asia Pacific Cancer Biological Therapy Market Revenue Share (%), by End User 2024 & 2032
- Figure 66: Asia Pacific Cancer Biological Therapy Market Volume Share (%), by End User 2024 & 2032
- Figure 67: Asia Pacific Cancer Biological Therapy Market Revenue (Million), by Country 2024 & 2032
- Figure 68: Asia Pacific Cancer Biological Therapy Market Volume (K Unit), by Country 2024 & 2032
- Figure 69: Asia Pacific Cancer Biological Therapy Market Revenue Share (%), by Country 2024 & 2032
- Figure 70: Asia Pacific Cancer Biological Therapy Market Volume Share (%), by Country 2024 & 2032
- Figure 71: Middle East and Africa Cancer Biological Therapy Market Revenue (Million), by Therapy Type 2024 & 2032
- Figure 72: Middle East and Africa Cancer Biological Therapy Market Volume (K Unit), by Therapy Type 2024 & 2032
- Figure 73: Middle East and Africa Cancer Biological Therapy Market Revenue Share (%), by Therapy Type 2024 & 2032
- Figure 74: Middle East and Africa Cancer Biological Therapy Market Volume Share (%), by Therapy Type 2024 & 2032
- Figure 75: Middle East and Africa Cancer Biological Therapy Market Revenue (Million), by Cancer Type 2024 & 2032
- Figure 76: Middle East and Africa Cancer Biological Therapy Market Volume (K Unit), by Cancer Type 2024 & 2032
- Figure 77: Middle East and Africa Cancer Biological Therapy Market Revenue Share (%), by Cancer Type 2024 & 2032
- Figure 78: Middle East and Africa Cancer Biological Therapy Market Volume Share (%), by Cancer Type 2024 & 2032
- Figure 79: Middle East and Africa Cancer Biological Therapy Market Revenue (Million), by End User 2024 & 2032
- Figure 80: Middle East and Africa Cancer Biological Therapy Market Volume (K Unit), by End User 2024 & 2032
- Figure 81: Middle East and Africa Cancer Biological Therapy Market Revenue Share (%), by End User 2024 & 2032
- Figure 82: Middle East and Africa Cancer Biological Therapy Market Volume Share (%), by End User 2024 & 2032
- Figure 83: Middle East and Africa Cancer Biological Therapy Market Revenue (Million), by Country 2024 & 2032
- Figure 84: Middle East and Africa Cancer Biological Therapy Market Volume (K Unit), by Country 2024 & 2032
- Figure 85: Middle East and Africa Cancer Biological Therapy Market Revenue Share (%), by Country 2024 & 2032
- Figure 86: Middle East and Africa Cancer Biological Therapy Market Volume Share (%), by Country 2024 & 2032
- Figure 87: South America Cancer Biological Therapy Market Revenue (Million), by Therapy Type 2024 & 2032
- Figure 88: South America Cancer Biological Therapy Market Volume (K Unit), by Therapy Type 2024 & 2032
- Figure 89: South America Cancer Biological Therapy Market Revenue Share (%), by Therapy Type 2024 & 2032
- Figure 90: South America Cancer Biological Therapy Market Volume Share (%), by Therapy Type 2024 & 2032
- Figure 91: South America Cancer Biological Therapy Market Revenue (Million), by Cancer Type 2024 & 2032
- Figure 92: South America Cancer Biological Therapy Market Volume (K Unit), by Cancer Type 2024 & 2032
- Figure 93: South America Cancer Biological Therapy Market Revenue Share (%), by Cancer Type 2024 & 2032
- Figure 94: South America Cancer Biological Therapy Market Volume Share (%), by Cancer Type 2024 & 2032
- Figure 95: South America Cancer Biological Therapy Market Revenue (Million), by End User 2024 & 2032
- Figure 96: South America Cancer Biological Therapy Market Volume (K Unit), by End User 2024 & 2032
- Figure 97: South America Cancer Biological Therapy Market Revenue Share (%), by End User 2024 & 2032
- Figure 98: South America Cancer Biological Therapy Market Volume Share (%), by End User 2024 & 2032
- Figure 99: South America Cancer Biological Therapy Market Revenue (Million), by Country 2024 & 2032
- Figure 100: South America Cancer Biological Therapy Market Volume (K Unit), by Country 2024 & 2032
- Figure 101: South America Cancer Biological Therapy Market Revenue Share (%), by Country 2024 & 2032
- Figure 102: South America Cancer Biological Therapy Market Volume Share (%), by Country 2024 & 2032
List of Tables
- Table 1: Global Cancer Biological Therapy Market Revenue Million Forecast, by Region 2019 & 2032
- Table 2: Global Cancer Biological Therapy Market Volume K Unit Forecast, by Region 2019 & 2032
- Table 3: Global Cancer Biological Therapy Market Revenue Million Forecast, by Therapy Type 2019 & 2032
- Table 4: Global Cancer Biological Therapy Market Volume K Unit Forecast, by Therapy Type 2019 & 2032
- Table 5: Global Cancer Biological Therapy Market Revenue Million Forecast, by Cancer Type 2019 & 2032
- Table 6: Global Cancer Biological Therapy Market Volume K Unit Forecast, by Cancer Type 2019 & 2032
- Table 7: Global Cancer Biological Therapy Market Revenue Million Forecast, by End User 2019 & 2032
- Table 8: Global Cancer Biological Therapy Market Volume K Unit Forecast, by End User 2019 & 2032
- Table 9: Global Cancer Biological Therapy Market Revenue Million Forecast, by Region 2019 & 2032
- Table 10: Global Cancer Biological Therapy Market Volume K Unit Forecast, by Region 2019 & 2032
- Table 11: Global Cancer Biological Therapy Market Revenue Million Forecast, by Country 2019 & 2032
- Table 12: Global Cancer Biological Therapy Market Volume K Unit Forecast, by Country 2019 & 2032
- Table 13: United States Cancer Biological Therapy Market Revenue (Million) Forecast, by Application 2019 & 2032
- Table 14: United States Cancer Biological Therapy Market Volume (K Unit) Forecast, by Application 2019 & 2032
- Table 15: Canada Cancer Biological Therapy Market Revenue (Million) Forecast, by Application 2019 & 2032
- Table 16: Canada Cancer Biological Therapy Market Volume (K Unit) Forecast, by Application 2019 & 2032
- Table 17: Mexico Cancer Biological Therapy Market Revenue (Million) Forecast, by Application 2019 & 2032
- Table 18: Mexico Cancer Biological Therapy Market Volume (K Unit) Forecast, by Application 2019 & 2032
- Table 19: Global Cancer Biological Therapy Market Revenue Million Forecast, by Country 2019 & 2032
- Table 20: Global Cancer Biological Therapy Market Volume K Unit Forecast, by Country 2019 & 2032
- Table 21: Germany Cancer Biological Therapy Market Revenue (Million) Forecast, by Application 2019 & 2032
- Table 22: Germany Cancer Biological Therapy Market Volume (K Unit) Forecast, by Application 2019 & 2032
- Table 23: United Kingdom Cancer Biological Therapy Market Revenue (Million) Forecast, by Application 2019 & 2032
- Table 24: United Kingdom Cancer Biological Therapy Market Volume (K Unit) Forecast, by Application 2019 & 2032
- Table 25: France Cancer Biological Therapy Market Revenue (Million) Forecast, by Application 2019 & 2032
- Table 26: France Cancer Biological Therapy Market Volume (K Unit) Forecast, by Application 2019 & 2032
- Table 27: Italy Cancer Biological Therapy Market Revenue (Million) Forecast, by Application 2019 & 2032
- Table 28: Italy Cancer Biological Therapy Market Volume (K Unit) Forecast, by Application 2019 & 2032
- Table 29: Spain Cancer Biological Therapy Market Revenue (Million) Forecast, by Application 2019 & 2032
- Table 30: Spain Cancer Biological Therapy Market Volume (K Unit) Forecast, by Application 2019 & 2032
- Table 31: Rest of Europe Cancer Biological Therapy Market Revenue (Million) Forecast, by Application 2019 & 2032
- Table 32: Rest of Europe Cancer Biological Therapy Market Volume (K Unit) Forecast, by Application 2019 & 2032
- Table 33: Global Cancer Biological Therapy Market Revenue Million Forecast, by Country 2019 & 2032
- Table 34: Global Cancer Biological Therapy Market Volume K Unit Forecast, by Country 2019 & 2032
- Table 35: China Cancer Biological Therapy Market Revenue (Million) Forecast, by Application 2019 & 2032
- Table 36: China Cancer Biological Therapy Market Volume (K Unit) Forecast, by Application 2019 & 2032
- Table 37: Japan Cancer Biological Therapy Market Revenue (Million) Forecast, by Application 2019 & 2032
- Table 38: Japan Cancer Biological Therapy Market Volume (K Unit) Forecast, by Application 2019 & 2032
- Table 39: India Cancer Biological Therapy Market Revenue (Million) Forecast, by Application 2019 & 2032
- Table 40: India Cancer Biological Therapy Market Volume (K Unit) Forecast, by Application 2019 & 2032
- Table 41: Australia Cancer Biological Therapy Market Revenue (Million) Forecast, by Application 2019 & 2032
- Table 42: Australia Cancer Biological Therapy Market Volume (K Unit) Forecast, by Application 2019 & 2032
- Table 43: South Korea Cancer Biological Therapy Market Revenue (Million) Forecast, by Application 2019 & 2032
- Table 44: South Korea Cancer Biological Therapy Market Volume (K Unit) Forecast, by Application 2019 & 2032
- Table 45: Rest of Asia Pacific Cancer Biological Therapy Market Revenue (Million) Forecast, by Application 2019 & 2032
- Table 46: Rest of Asia Pacific Cancer Biological Therapy Market Volume (K Unit) Forecast, by Application 2019 & 2032
- Table 47: Global Cancer Biological Therapy Market Revenue Million Forecast, by Country 2019 & 2032
- Table 48: Global Cancer Biological Therapy Market Volume K Unit Forecast, by Country 2019 & 2032
- Table 49: GCC Cancer Biological Therapy Market Revenue (Million) Forecast, by Application 2019 & 2032
- Table 50: GCC Cancer Biological Therapy Market Volume (K Unit) Forecast, by Application 2019 & 2032
- Table 51: South Africa Cancer Biological Therapy Market Revenue (Million) Forecast, by Application 2019 & 2032
- Table 52: South Africa Cancer Biological Therapy Market Volume (K Unit) Forecast, by Application 2019 & 2032
- Table 53: Rest of Middle East and Africa Cancer Biological Therapy Market Revenue (Million) Forecast, by Application 2019 & 2032
- Table 54: Rest of Middle East and Africa Cancer Biological Therapy Market Volume (K Unit) Forecast, by Application 2019 & 2032
- Table 55: Global Cancer Biological Therapy Market Revenue Million Forecast, by Country 2019 & 2032
- Table 56: Global Cancer Biological Therapy Market Volume K Unit Forecast, by Country 2019 & 2032
- Table 57: Brazil Cancer Biological Therapy Market Revenue (Million) Forecast, by Application 2019 & 2032
- Table 58: Brazil Cancer Biological Therapy Market Volume (K Unit) Forecast, by Application 2019 & 2032
- Table 59: Argentina Cancer Biological Therapy Market Revenue (Million) Forecast, by Application 2019 & 2032
- Table 60: Argentina Cancer Biological Therapy Market Volume (K Unit) Forecast, by Application 2019 & 2032
- Table 61: Rest of South America Cancer Biological Therapy Market Revenue (Million) Forecast, by Application 2019 & 2032
- Table 62: Rest of South America Cancer Biological Therapy Market Volume (K Unit) Forecast, by Application 2019 & 2032
- Table 63: Global Cancer Biological Therapy Market Revenue Million Forecast, by Therapy Type 2019 & 2032
- Table 64: Global Cancer Biological Therapy Market Volume K Unit Forecast, by Therapy Type 2019 & 2032
- Table 65: Global Cancer Biological Therapy Market Revenue Million Forecast, by Cancer Type 2019 & 2032
- Table 66: Global Cancer Biological Therapy Market Volume K Unit Forecast, by Cancer Type 2019 & 2032
- Table 67: Global Cancer Biological Therapy Market Revenue Million Forecast, by End User 2019 & 2032
- Table 68: Global Cancer Biological Therapy Market Volume K Unit Forecast, by End User 2019 & 2032
- Table 69: Global Cancer Biological Therapy Market Revenue Million Forecast, by Country 2019 & 2032
- Table 70: Global Cancer Biological Therapy Market Volume K Unit Forecast, by Country 2019 & 2032
- Table 71: United States Cancer Biological Therapy Market Revenue (Million) Forecast, by Application 2019 & 2032
- Table 72: United States Cancer Biological Therapy Market Volume (K Unit) Forecast, by Application 2019 & 2032
- Table 73: Canada Cancer Biological Therapy Market Revenue (Million) Forecast, by Application 2019 & 2032
- Table 74: Canada Cancer Biological Therapy Market Volume (K Unit) Forecast, by Application 2019 & 2032
- Table 75: Mexico Cancer Biological Therapy Market Revenue (Million) Forecast, by Application 2019 & 2032
- Table 76: Mexico Cancer Biological Therapy Market Volume (K Unit) Forecast, by Application 2019 & 2032
- Table 77: Global Cancer Biological Therapy Market Revenue Million Forecast, by Therapy Type 2019 & 2032
- Table 78: Global Cancer Biological Therapy Market Volume K Unit Forecast, by Therapy Type 2019 & 2032
- Table 79: Global Cancer Biological Therapy Market Revenue Million Forecast, by Cancer Type 2019 & 2032
- Table 80: Global Cancer Biological Therapy Market Volume K Unit Forecast, by Cancer Type 2019 & 2032
- Table 81: Global Cancer Biological Therapy Market Revenue Million Forecast, by End User 2019 & 2032
- Table 82: Global Cancer Biological Therapy Market Volume K Unit Forecast, by End User 2019 & 2032
- Table 83: Global Cancer Biological Therapy Market Revenue Million Forecast, by Country 2019 & 2032
- Table 84: Global Cancer Biological Therapy Market Volume K Unit Forecast, by Country 2019 & 2032
- Table 85: Germany Cancer Biological Therapy Market Revenue (Million) Forecast, by Application 2019 & 2032
- Table 86: Germany Cancer Biological Therapy Market Volume (K Unit) Forecast, by Application 2019 & 2032
- Table 87: United Kingdom Cancer Biological Therapy Market Revenue (Million) Forecast, by Application 2019 & 2032
- Table 88: United Kingdom Cancer Biological Therapy Market Volume (K Unit) Forecast, by Application 2019 & 2032
- Table 89: France Cancer Biological Therapy Market Revenue (Million) Forecast, by Application 2019 & 2032
- Table 90: France Cancer Biological Therapy Market Volume (K Unit) Forecast, by Application 2019 & 2032
- Table 91: Italy Cancer Biological Therapy Market Revenue (Million) Forecast, by Application 2019 & 2032
- Table 92: Italy Cancer Biological Therapy Market Volume (K Unit) Forecast, by Application 2019 & 2032
- Table 93: Spain Cancer Biological Therapy Market Revenue (Million) Forecast, by Application 2019 & 2032
- Table 94: Spain Cancer Biological Therapy Market Volume (K Unit) Forecast, by Application 2019 & 2032
- Table 95: Rest of Europe Cancer Biological Therapy Market Revenue (Million) Forecast, by Application 2019 & 2032
- Table 96: Rest of Europe Cancer Biological Therapy Market Volume (K Unit) Forecast, by Application 2019 & 2032
- Table 97: Global Cancer Biological Therapy Market Revenue Million Forecast, by Therapy Type 2019 & 2032
- Table 98: Global Cancer Biological Therapy Market Volume K Unit Forecast, by Therapy Type 2019 & 2032
- Table 99: Global Cancer Biological Therapy Market Revenue Million Forecast, by Cancer Type 2019 & 2032
- Table 100: Global Cancer Biological Therapy Market Volume K Unit Forecast, by Cancer Type 2019 & 2032
- Table 101: Global Cancer Biological Therapy Market Revenue Million Forecast, by End User 2019 & 2032
- Table 102: Global Cancer Biological Therapy Market Volume K Unit Forecast, by End User 2019 & 2032
- Table 103: Global Cancer Biological Therapy Market Revenue Million Forecast, by Country 2019 & 2032
- Table 104: Global Cancer Biological Therapy Market Volume K Unit Forecast, by Country 2019 & 2032
- Table 105: China Cancer Biological Therapy Market Revenue (Million) Forecast, by Application 2019 & 2032
- Table 106: China Cancer Biological Therapy Market Volume (K Unit) Forecast, by Application 2019 & 2032
- Table 107: Japan Cancer Biological Therapy Market Revenue (Million) Forecast, by Application 2019 & 2032
- Table 108: Japan Cancer Biological Therapy Market Volume (K Unit) Forecast, by Application 2019 & 2032
- Table 109: India Cancer Biological Therapy Market Revenue (Million) Forecast, by Application 2019 & 2032
- Table 110: India Cancer Biological Therapy Market Volume (K Unit) Forecast, by Application 2019 & 2032
- Table 111: Australia Cancer Biological Therapy Market Revenue (Million) Forecast, by Application 2019 & 2032
- Table 112: Australia Cancer Biological Therapy Market Volume (K Unit) Forecast, by Application 2019 & 2032
- Table 113: South Korea Cancer Biological Therapy Market Revenue (Million) Forecast, by Application 2019 & 2032
- Table 114: South Korea Cancer Biological Therapy Market Volume (K Unit) Forecast, by Application 2019 & 2032
- Table 115: Rest of Asia Pacific Cancer Biological Therapy Market Revenue (Million) Forecast, by Application 2019 & 2032
- Table 116: Rest of Asia Pacific Cancer Biological Therapy Market Volume (K Unit) Forecast, by Application 2019 & 2032
- Table 117: Global Cancer Biological Therapy Market Revenue Million Forecast, by Therapy Type 2019 & 2032
- Table 118: Global Cancer Biological Therapy Market Volume K Unit Forecast, by Therapy Type 2019 & 2032
- Table 119: Global Cancer Biological Therapy Market Revenue Million Forecast, by Cancer Type 2019 & 2032
- Table 120: Global Cancer Biological Therapy Market Volume K Unit Forecast, by Cancer Type 2019 & 2032
- Table 121: Global Cancer Biological Therapy Market Revenue Million Forecast, by End User 2019 & 2032
- Table 122: Global Cancer Biological Therapy Market Volume K Unit Forecast, by End User 2019 & 2032
- Table 123: Global Cancer Biological Therapy Market Revenue Million Forecast, by Country 2019 & 2032
- Table 124: Global Cancer Biological Therapy Market Volume K Unit Forecast, by Country 2019 & 2032
- Table 125: GCC Cancer Biological Therapy Market Revenue (Million) Forecast, by Application 2019 & 2032
- Table 126: GCC Cancer Biological Therapy Market Volume (K Unit) Forecast, by Application 2019 & 2032
- Table 127: South Africa Cancer Biological Therapy Market Revenue (Million) Forecast, by Application 2019 & 2032
- Table 128: South Africa Cancer Biological Therapy Market Volume (K Unit) Forecast, by Application 2019 & 2032
- Table 129: Rest of Middle East and Africa Cancer Biological Therapy Market Revenue (Million) Forecast, by Application 2019 & 2032
- Table 130: Rest of Middle East and Africa Cancer Biological Therapy Market Volume (K Unit) Forecast, by Application 2019 & 2032
- Table 131: Global Cancer Biological Therapy Market Revenue Million Forecast, by Therapy Type 2019 & 2032
- Table 132: Global Cancer Biological Therapy Market Volume K Unit Forecast, by Therapy Type 2019 & 2032
- Table 133: Global Cancer Biological Therapy Market Revenue Million Forecast, by Cancer Type 2019 & 2032
- Table 134: Global Cancer Biological Therapy Market Volume K Unit Forecast, by Cancer Type 2019 & 2032
- Table 135: Global Cancer Biological Therapy Market Revenue Million Forecast, by End User 2019 & 2032
- Table 136: Global Cancer Biological Therapy Market Volume K Unit Forecast, by End User 2019 & 2032
- Table 137: Global Cancer Biological Therapy Market Revenue Million Forecast, by Country 2019 & 2032
- Table 138: Global Cancer Biological Therapy Market Volume K Unit Forecast, by Country 2019 & 2032
- Table 139: Brazil Cancer Biological Therapy Market Revenue (Million) Forecast, by Application 2019 & 2032
- Table 140: Brazil Cancer Biological Therapy Market Volume (K Unit) Forecast, by Application 2019 & 2032
- Table 141: Argentina Cancer Biological Therapy Market Revenue (Million) Forecast, by Application 2019 & 2032
- Table 142: Argentina Cancer Biological Therapy Market Volume (K Unit) Forecast, by Application 2019 & 2032
- Table 143: Rest of South America Cancer Biological Therapy Market Revenue (Million) Forecast, by Application 2019 & 2032
- Table 144: Rest of South America Cancer Biological Therapy Market Volume (K Unit) Forecast, by Application 2019 & 2032
Frequently Asked Questions
1. What is the projected Compound Annual Growth Rate (CAGR) of the Cancer Biological Therapy Market?
The projected CAGR is approximately 7.10%.
2. Which companies are prominent players in the Cancer Biological Therapy Market?
Key companies in the market include Bayer AG, Novartis AG, Amgen Inc, ImmunoGen Inc, Merck & Co Inc, F Hoffmann-La Roche Ltd, Mirati Therapeutics Inc, GlaxoSmithKline plc, AstraZeneca plc, Johnson & Johnson, Bristol-Myers Squibb Company, Pfizer Inc.
3. What are the main segments of the Cancer Biological Therapy Market?
The market segments include Therapy Type, Cancer Type, End User.
4. Can you provide details about the market size?
The market size is estimated to be USD XX Million as of 2022.
5. What are some drivers contributing to market growth?
Increasing Prevalence of Various Type of Cancers; Increasing Investment in Research and Development.
6. What are the notable trends driving market growth?
Breast Cancer Segment is Expected to Register a High CAGR in the Market Over the Forecast Period.
7. Are there any restraints impacting market growth?
High Cost and Side Effects Associated with the Targeted Therapies.
8. Can you provide examples of recent developments in the market?
December 2022: Genentech, Inc received approval from United States FDA for Tecentriq (atezolizumab) for adult and pediatric patients two years of age and older with unresectable or metastatic alveolar soft part sarcoma (ASPS).
9. What pricing options are available for accessing the report?
Pricing options include single-user, multi-user, and enterprise licenses priced at USD 4750, USD 5250, and USD 8750 respectively.
10. Is the market size provided in terms of value or volume?
The market size is provided in terms of value, measured in Million and volume, measured in K Unit.
11. Are there any specific market keywords associated with the report?
Yes, the market keyword associated with the report is "Cancer Biological Therapy Market," which aids in identifying and referencing the specific market segment covered.
12. How do I determine which pricing option suits my needs best?
The pricing options vary based on user requirements and access needs. Individual users may opt for single-user licenses, while businesses requiring broader access may choose multi-user or enterprise licenses for cost-effective access to the report.
13. Are there any additional resources or data provided in the Cancer Biological Therapy Market report?
While the report offers comprehensive insights, it's advisable to review the specific contents or supplementary materials provided to ascertain if additional resources or data are available.
14. How can I stay updated on further developments or reports in the Cancer Biological Therapy Market?
To stay informed about further developments, trends, and reports in the Cancer Biological Therapy Market, consider subscribing to industry newsletters, following relevant companies and organizations, or regularly checking reputable industry news sources and publications.
Methodology
Step 1 - Identification of Relevant Samples Size from Population Database


Step 2 - Approaches for Defining Global Market Size (Value, Volume* & Price*)

Note*: In applicable scenarios
Step 3 - Data Sources
Primary Research
- Web Analytics
- Survey Reports
- Research Institute
- Latest Research Reports
- Opinion Leaders
Secondary Research
- Annual Reports
- White Paper
- Latest Press Release
- Industry Association
- Paid Database
- Investor Presentations

Step 4 - Data Triangulation
Involves using different sources of information in order to increase the validity of a study
These sources are likely to be stakeholders in a program - participants, other researchers, program staff, other community members, and so on.
Then we put all data in single framework & apply various statistical tools to find out the dynamic on the market.
During the analysis stage, feedback from the stakeholder groups would be compared to determine areas of agreement as well as areas of divergence
