

Key Insights
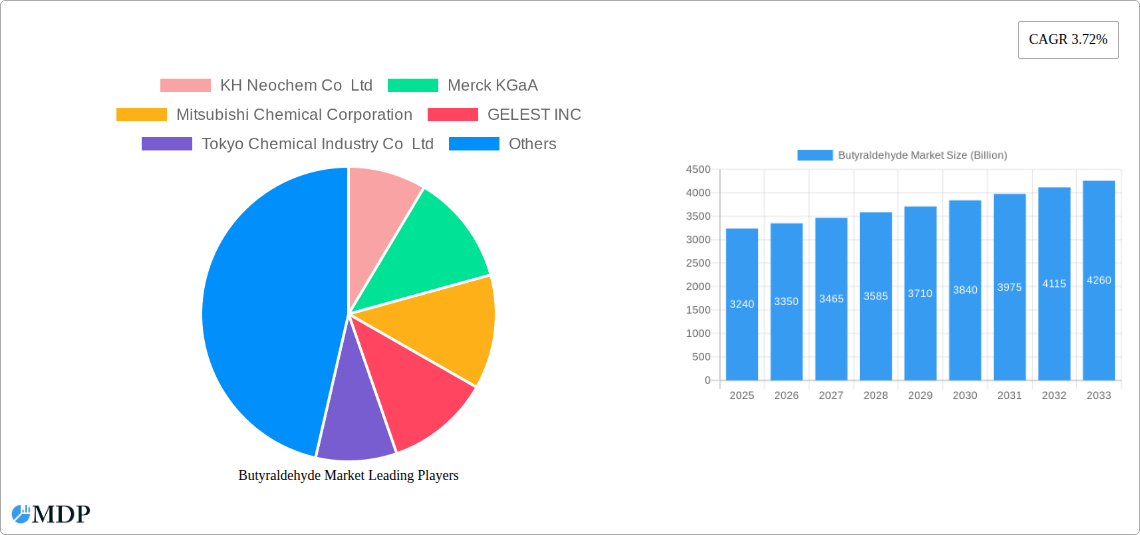
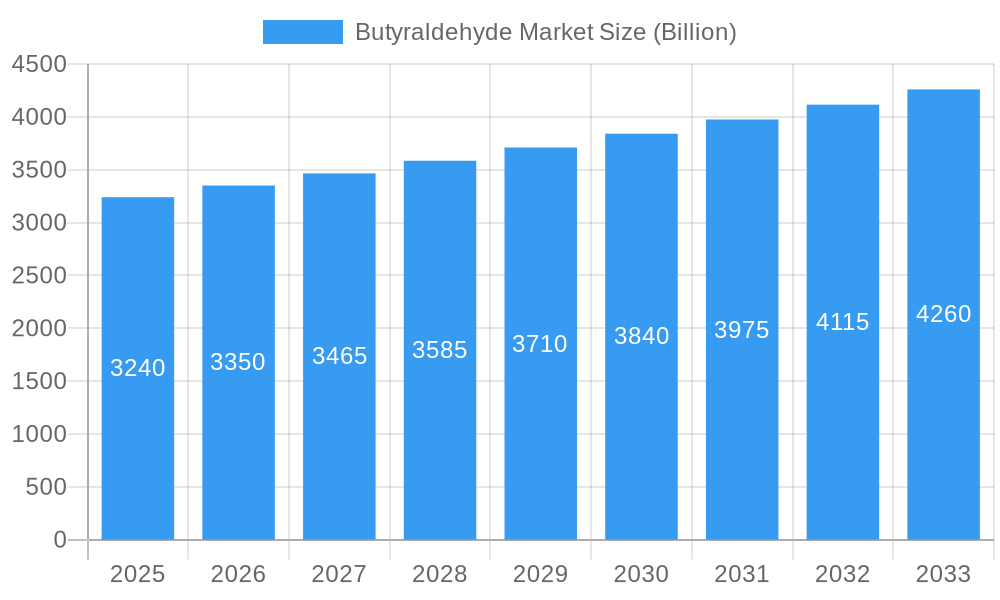
The global butyraldehyde market, valued at $3.24 billion in 2025, is projected to experience steady growth, driven by increasing demand across diverse sectors. A compound annual growth rate (CAGR) of 3.72% from 2025 to 2033 indicates a significant expansion, primarily fueled by the robust growth in the paints and coatings industry, which utilizes butyraldehyde derivatives extensively. The pharmaceutical and agrochemical sectors also contribute significantly to market growth, as butyraldehyde serves as a crucial intermediate in the synthesis of various pharmaceutical compounds and agrochemicals. Expanding applications in polymers and other specialized chemicals further bolster market demand. While production capacity expansions and technological advancements contribute to growth, potential price fluctuations in raw materials and stringent environmental regulations could present challenges. The market segmentation reveals that N-Butanol and 2-Ethylhexanol, key butyraldehyde derivatives, hold substantial market shares within the product type segment. Geographically, North America and Asia-Pacific are key regions driving market expansion due to significant industrial activity and rising consumption in these areas. Competitive dynamics among key players, including BASF SE, DuPont, and Eastman Chemical Company, are characterized by continuous innovation and strategic partnerships to enhance market position and access expanding global markets.
Butyraldehyde Market Market Size (In Billion)
The future outlook for the butyraldehyde market remains promising, however, challenges exist. Sustained growth is anticipated, particularly in developing economies where industrialization is driving demand for paints, coatings, and other related products. Technological advancements in production processes are likely to improve efficiency and reduce costs, further enhancing market competitiveness. Companies are focusing on developing sustainable and eco-friendly butyraldehyde derivatives to comply with stricter environmental regulations. Regional variations in market growth will likely persist, with Asia-Pacific potentially witnessing faster growth due to its rapidly developing industrial sector and burgeoning construction industry. A diversified product portfolio and strategic expansion into new markets will be crucial for industry participants to maintain a competitive edge in this dynamic market landscape.
Butyraldehyde Market Company Market Share
Dive Deep into the Thriving Butyraldehyde Market: A Comprehensive Report (2019-2033)
This in-depth report provides a comprehensive analysis of the global Butyraldehyde market, projecting a valuation of xx Billion by 2033. It offers invaluable insights for industry stakeholders, investors, and strategic decision-makers seeking to navigate this dynamic market landscape. The study period spans 2019-2033, with 2025 serving as the base and estimated year. The report meticulously examines market dynamics, leading players, emerging trends, and future growth potential.
Butyraldehyde Market Market Dynamics & Concentration
This section delves into the competitive landscape of the Butyraldehyde market, analyzing market concentration, innovation drivers, regulatory frameworks, and key market dynamics. The analysis considers factors influencing market growth, including the impact of mergers and acquisitions (M&A) activity and the role of substitute products.
Market Concentration: The Butyraldehyde market exhibits a moderately concentrated structure, with a few major players holding significant market share. The top five players collectively account for approximately xx% of the global market, as of 2024. This concentration is expected to slightly decrease by 2033 due to the entry of new players and increased competition.
Innovation Drivers: Continuous R&D efforts focused on developing more efficient and sustainable production processes drive innovation. The development of new applications for Butyraldehyde in various industries also contributes to market growth.
Regulatory Frameworks: Government regulations concerning chemical safety and environmental protection influence production and usage practices. Stringent environmental standards are driving the adoption of cleaner and more sustainable manufacturing techniques.
Product Substitutes: The availability of alternative chemicals with similar functionalities presents a challenge to market growth. The report analyzes the competitive threat posed by these substitutes and assesses their impact on market share.
End-User Trends: Shifting preferences and demands from end-user industries (e.g., Paints and Coatings, Pharmaceuticals) shape market trends. Growing construction and infrastructure development, coupled with increased demand for advanced materials, is expected to boost demand for Butyraldehyde.
M&A Activities: The report analyzes past M&A activity and predicts future consolidation based on industry trends. In 2023, there were approximately xx M&A deals within the Butyraldehyde industry. This number is projected to increase to xx by 2028.
Butyraldehyde Market Industry Trends & Analysis
This section provides a detailed analysis of industry trends, growth drivers, and challenges shaping the Butyraldehyde market. It examines various aspects, including technological advancements, consumer preferences, and competitive dynamics to forecast future market growth.
The Butyraldehyde market is projected to witness a Compound Annual Growth Rate (CAGR) of xx% during the forecast period (2025-2033). This growth is driven primarily by increasing demand from various end-use sectors, especially the paints and coatings industry. Technological advancements, leading to more efficient and cost-effective production processes, also contribute significantly. Market penetration in developing economies, particularly in Asia-Pacific, presents a substantial growth opportunity. However, fluctuations in raw material prices and stringent environmental regulations pose challenges to sustainable growth. The competitive landscape is characterized by both large multinational corporations and smaller specialized chemical manufacturers, each adopting different strategies to enhance market share.
Leading Markets & Segments in Butyraldehyde Market
This section identifies the dominant segments within the Butyraldehyde market, highlighting key regional and application-specific drivers.
Product Type:
N-Butanol: This segment is currently the largest, dominating xx% of the market in 2024. Its widespread use in various applications, coupled with strong demand growth from the paints and coatings sector, contributes significantly to market share.
2-Ethylhexanol: This segment shows steady growth, driven by its applications in plasticizers and other chemical intermediates. Its market share is projected to reach xx% by 2033.
Polyvinyl Butyral: Market growth is relatively stable, supported by its indispensable use in safety glass and other specialized applications.
Others: This segment includes various minor products, exhibiting varied growth rates based on specific application demands.
Application:
Paints and Coatings: This segment accounts for the largest share of the Butyraldehyde market. The increasing demand for paints and coatings in the construction, automotive, and industrial sectors is the primary driver.
Pharmaceutical: This segment shows moderate growth, driven by the use of Butyraldehyde in the production of various pharmaceutical intermediates and formulations.
Agrochemical: Market growth is influenced by the use of Butyraldehyde in certain pesticide and herbicide formulations, making it a moderately significant segment.
Polymer: The application of Butyraldehyde in the polymer industry exhibits steady growth, influenced by the expanding polymer market.
Others: This segment encompasses various other applications of Butyraldehyde.
Regional Dominance: The Asia-Pacific region currently dominates the Butyraldehyde market, driven by rapid industrialization and increasing demand from end-use industries. Key factors include robust economic growth, expanding infrastructure development, and a large manufacturing base. Strong government support for infrastructure projects and favorable economic policies further fuel market growth. Europe and North America follow, showing relatively stable growth.
Butyraldehyde Market Product Developments
Recent product innovations focus on enhancing the efficiency and sustainability of Butyraldehyde production. Companies are investing in advanced technologies to reduce environmental impact and improve product quality. New applications of Butyraldehyde are being explored in various niche markets, creating opportunities for market expansion. The competitive advantage lies in offering high-quality products at competitive prices, combined with innovative solutions for specific customer needs.
Key Drivers of Butyraldehyde Market Growth
Several factors drive the growth of the Butyraldehyde market:
Increasing demand from end-use industries: The construction boom and growth of the automotive sector boost demand for paints and coatings, a major application of Butyraldehyde.
Technological advancements: Improvements in production processes enhance efficiency and reduce costs, fostering market expansion.
Favorable government policies: Government initiatives promoting industrial growth and infrastructure development create favorable conditions for market growth.
Challenges in the Butyraldehyde Market Market
The Butyraldehyde market faces several challenges:
Fluctuations in raw material prices: Volatility in the prices of raw materials impacts production costs and profitability.
Stringent environmental regulations: Compliance with stringent environmental standards can increase production costs.
Intense competition: Competition from established players and new entrants can put pressure on prices and profit margins.
Emerging Opportunities in Butyraldehyde Market
Emerging opportunities lie in exploring new applications for Butyraldehyde in specialized markets. Strategic partnerships and collaborations between companies can facilitate market expansion. Investing in R&D to develop sustainable production processes and exploring new geographic markets are key strategies for long-term growth.
Leading Players in the Butyraldehyde Market Sector
- KH Neochem Co Ltd
- Merck KGaA
- Mitsubishi Chemical Corporation
- GELEST INC
- Tokyo Chemical Industry Co Ltd
- Toronto Research Chemicals
- BASF SE
- DuPont
- Eastman Chemical Company
- Alfa Aesar Thermo Fisher Scientific
- Aurochemicals
- LobaChemie Pvt Ltd
Key Milestones in Butyraldehyde Market Industry
- 2020: Company X launched a new, sustainable Butyraldehyde production process.
- 2021: A significant merger between two key players reshaped the market landscape.
- 2022: New regulations regarding Butyraldehyde usage impacted market dynamics.
- 2023: Company Y introduced a new application of Butyraldehyde in the automotive sector.
- 2024: Increased investment in R&D led to improved production efficiency.
Strategic Outlook for Butyraldehyde Market Market
The Butyraldehyde market presents significant growth potential, driven by increasing demand, technological advancements, and strategic partnerships. Focusing on sustainability, exploring new applications, and expanding into emerging markets will be crucial for long-term success. Companies that prioritize innovation and adapt to evolving market needs are poised for substantial growth in the coming years.
Butyraldehyde Market Segmentation
-
1. Product Type
- 1.1. N-Butanol
- 1.2. 2-Ethylhexanol
- 1.3. Polyvinyl Buthyral
- 1.4. Others
-
2. Application
- 2.1. Paints and Coatings
- 2.2. Pharmaceutical
- 2.3. Agrochemical
- 2.4. Polymer
- 2.5. Others
Butyraldehyde Market Segmentation By Geography
-
1. Asia Pacific
- 1.1. China
- 1.2. India
- 1.3. Japan
- 1.4. South Korea
- 1.5. Rest of Asia Pacific
-
2. North America
- 2.1. United States
- 2.2. Canada
- 2.3. Mexico
-
3. Europe
- 3.1. Germany
- 3.2. United Kingdom
- 3.3. France
- 3.4. Italy
- 3.5. Rest of Europe
-
4. South America
- 4.1. Brazil
- 4.2. Argentina
- 4.3. Rest of South America
-
5. Middle East and Africa
- 5.1. Saudi Arabia
- 5.2. South Africa
- 5.3. Rest of Middle East and Africa
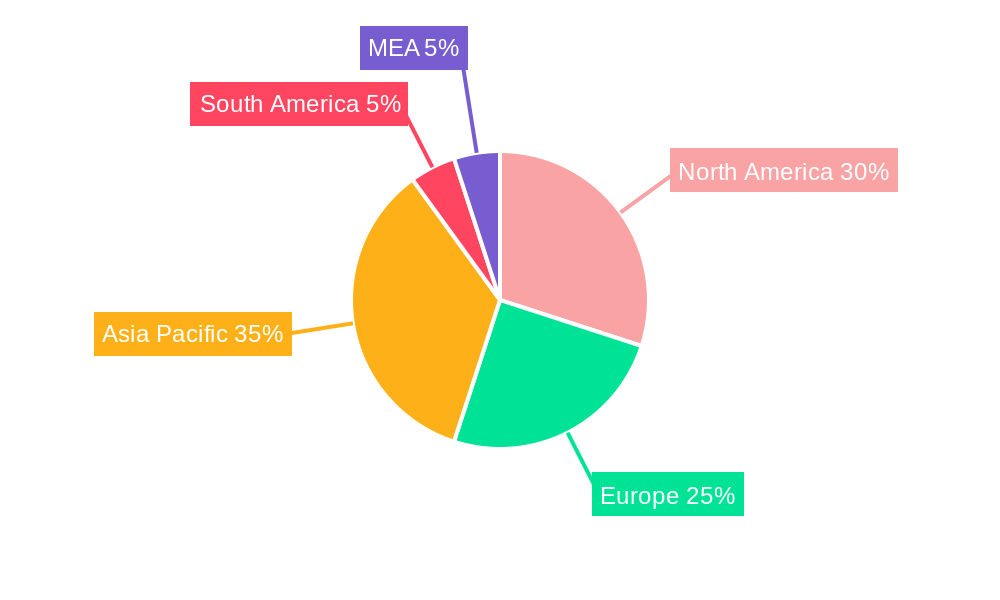
Butyraldehyde Market Regional Market Share
Geographic Coverage of Butyraldehyde Market
Butyraldehyde Market REPORT HIGHLIGHTS
| Aspects | Details |
|---|---|
| Study Period | 2020-2034 |
| Base Year | 2025 |
| Estimated Year | 2026 |
| Forecast Period | 2026-2034 |
| Historical Period | 2020-2025 |
| Growth Rate | CAGR of 3.72% from 2020-2034 |
| Segmentation |
|
Table of Contents
- 1. Introduction
- 1.1. Research Scope
- 1.2. Market Segmentation
- 1.3. Research Objective
- 1.4. Definitions and Assumptions
- 2. Executive Summary
- 2.1. Market Snapshot
- 3. Market Dynamics
- 3.1. Market Drivers
- 3.2. Market Restrains
- 3.3. Market Trends
- 3.4. Market Opportunities
- 4. Market Factor Analysis
- 4.1. Porters Five Forces
- 4.1.1. Bargaining Power of Suppliers
- 4.1.2. Bargaining Power of Buyers
- 4.1.3. Threat of New Entrants
- 4.1.4. Threat of Substitutes
- 4.1.5. Competitive Rivalry
- 4.2. PESTEL analysis
- 4.3. BCG Analysis
- 4.3.1. Stars (High Growth, High Market Share)
- 4.3.2. Cash Cows (Low Growth, High Market Share)
- 4.3.3. Question Mark (High Growth, Low Market Share)
- 4.3.4. Dogs (Low Growth, Low Market Share)
- 4.4. Ansoff Matrix Analysis
- 4.5. Supply Chain Analysis
- 4.6. Regulatory Landscape
- 4.7. Current Market Potential and Opportunity Assessment (TAM–SAM–SOM Framework)
- 4.8. MDP Analyst Note
- 4.1. Porters Five Forces
- 5. Market Analysis, Insights and Forecast 2021-2033
- 5.1. Market Analysis, Insights and Forecast - by Product Type
- 5.1.1. N-Butanol
- 5.1.2. 2-Ethylhexanol
- 5.1.3. Polyvinyl Buthyral
- 5.1.4. Others
- 5.2. Market Analysis, Insights and Forecast - by Application
- 5.2.1. Paints and Coatings
- 5.2.2. Pharmaceutical
- 5.2.3. Agrochemical
- 5.2.4. Polymer
- 5.2.5. Others
- 5.3. Market Analysis, Insights and Forecast - by Region
- 5.3.1. Asia Pacific
- 5.3.2. North America
- 5.3.3. Europe
- 5.3.4. South America
- 5.3.5. Middle East and Africa
- 5.1. Market Analysis, Insights and Forecast - by Product Type
- 6. Global Butyraldehyde Market Analysis, Insights and Forecast, 2021-2033
- 6.1. Market Analysis, Insights and Forecast - by Product Type
- 6.1.1. N-Butanol
- 6.1.2. 2-Ethylhexanol
- 6.1.3. Polyvinyl Buthyral
- 6.1.4. Others
- 6.2. Market Analysis, Insights and Forecast - by Application
- 6.2.1. Paints and Coatings
- 6.2.2. Pharmaceutical
- 6.2.3. Agrochemical
- 6.2.4. Polymer
- 6.2.5. Others
- 6.1. Market Analysis, Insights and Forecast - by Product Type
- 7. Asia Pacific Butyraldehyde Market Analysis, Insights and Forecast, 2020-2032
- 7.1. Market Analysis, Insights and Forecast - by Product Type
- 7.1.1. N-Butanol
- 7.1.2. 2-Ethylhexanol
- 7.1.3. Polyvinyl Buthyral
- 7.1.4. Others
- 7.2. Market Analysis, Insights and Forecast - by Application
- 7.2.1. Paints and Coatings
- 7.2.2. Pharmaceutical
- 7.2.3. Agrochemical
- 7.2.4. Polymer
- 7.2.5. Others
- 7.1. Market Analysis, Insights and Forecast - by Product Type
- 8. North America Butyraldehyde Market Analysis, Insights and Forecast, 2020-2032
- 8.1. Market Analysis, Insights and Forecast - by Product Type
- 8.1.1. N-Butanol
- 8.1.2. 2-Ethylhexanol
- 8.1.3. Polyvinyl Buthyral
- 8.1.4. Others
- 8.2. Market Analysis, Insights and Forecast - by Application
- 8.2.1. Paints and Coatings
- 8.2.2. Pharmaceutical
- 8.2.3. Agrochemical
- 8.2.4. Polymer
- 8.2.5. Others
- 8.1. Market Analysis, Insights and Forecast - by Product Type
- 9. Europe Butyraldehyde Market Analysis, Insights and Forecast, 2020-2032
- 9.1. Market Analysis, Insights and Forecast - by Product Type
- 9.1.1. N-Butanol
- 9.1.2. 2-Ethylhexanol
- 9.1.3. Polyvinyl Buthyral
- 9.1.4. Others
- 9.2. Market Analysis, Insights and Forecast - by Application
- 9.2.1. Paints and Coatings
- 9.2.2. Pharmaceutical
- 9.2.3. Agrochemical
- 9.2.4. Polymer
- 9.2.5. Others
- 9.1. Market Analysis, Insights and Forecast - by Product Type
- 10. South America Butyraldehyde Market Analysis, Insights and Forecast, 2020-2032
- 10.1. Market Analysis, Insights and Forecast - by Product Type
- 10.1.1. N-Butanol
- 10.1.2. 2-Ethylhexanol
- 10.1.3. Polyvinyl Buthyral
- 10.1.4. Others
- 10.2. Market Analysis, Insights and Forecast - by Application
- 10.2.1. Paints and Coatings
- 10.2.2. Pharmaceutical
- 10.2.3. Agrochemical
- 10.2.4. Polymer
- 10.2.5. Others
- 10.1. Market Analysis, Insights and Forecast - by Product Type
- 11. Middle East and Africa Butyraldehyde Market Analysis, Insights and Forecast, 2020-2032
- 11.1. Market Analysis, Insights and Forecast - by Product Type
- 11.1.1. N-Butanol
- 11.1.2. 2-Ethylhexanol
- 11.1.3. Polyvinyl Buthyral
- 11.1.4. Others
- 11.2. Market Analysis, Insights and Forecast - by Application
- 11.2.1. Paints and Coatings
- 11.2.2. Pharmaceutical
- 11.2.3. Agrochemical
- 11.2.4. Polymer
- 11.2.5. Others
- 11.1. Market Analysis, Insights and Forecast - by Product Type
- 12. Competitive Analysis
- 12.1. Company Profiles
- 12.1.1 KH Neochem Co Ltd
- 12.1.1.1. Company Overview
- 12.1.1.2. Products
- 12.1.1.3. Company Financials
- 12.1.1.4. SWOT Analysis
- 12.1.2 Merck KGaA
- 12.1.2.1. Company Overview
- 12.1.2.2. Products
- 12.1.2.3. Company Financials
- 12.1.2.4. SWOT Analysis
- 12.1.3 Mitsubishi Chemical Corporation
- 12.1.3.1. Company Overview
- 12.1.3.2. Products
- 12.1.3.3. Company Financials
- 12.1.3.4. SWOT Analysis
- 12.1.4 GELEST INC
- 12.1.4.1. Company Overview
- 12.1.4.2. Products
- 12.1.4.3. Company Financials
- 12.1.4.4. SWOT Analysis
- 12.1.5 Tokyo Chemical Industry Co Ltd
- 12.1.5.1. Company Overview
- 12.1.5.2. Products
- 12.1.5.3. Company Financials
- 12.1.5.4. SWOT Analysis
- 12.1.6 Toronto Research Chemicals
- 12.1.6.1. Company Overview
- 12.1.6.2. Products
- 12.1.6.3. Company Financials
- 12.1.6.4. SWOT Analysis
- 12.1.7 BASF SE
- 12.1.7.1. Company Overview
- 12.1.7.2. Products
- 12.1.7.3. Company Financials
- 12.1.7.4. SWOT Analysis
- 12.1.8 DuPont
- 12.1.8.1. Company Overview
- 12.1.8.2. Products
- 12.1.8.3. Company Financials
- 12.1.8.4. SWOT Analysis
- 12.1.9 Eastman Chemical Company
- 12.1.9.1. Company Overview
- 12.1.9.2. Products
- 12.1.9.3. Company Financials
- 12.1.9.4. SWOT Analysis
- 12.1.10 Alfa Aesar Thermo Fisher Scientific
- 12.1.10.1. Company Overview
- 12.1.10.2. Products
- 12.1.10.3. Company Financials
- 12.1.10.4. SWOT Analysis
- 12.1.11 Aurochemicals
- 12.1.11.1. Company Overview
- 12.1.11.2. Products
- 12.1.11.3. Company Financials
- 12.1.11.4. SWOT Analysis
- 12.1.12 LobaChemie Pvt Ltd
- 12.1.12.1. Company Overview
- 12.1.12.2. Products
- 12.1.12.3. Company Financials
- 12.1.12.4. SWOT Analysis
- 12.1.1 KH Neochem Co Ltd
- 12.2. Market Entropy
- 12.2.1 Company's Key Areas Served
- 12.2.2 Recent Developments
- 12.3. Company Market Share Analysis 2025
- 12.3.1 Top 5 Companies Market Share Analysis
- 12.3.2 Top 3 Companies Market Share Analysis
- 12.4. List of Potential Customers
- 13. Research Methodology
List of Figures
- Figure 1: Global Butyraldehyde Market Revenue Breakdown (Billion, %) by Region 2025 & 2033
- Figure 2: Global Butyraldehyde Market Volume Breakdown (K Tons, %) by Region 2025 & 2033
- Figure 3: Asia Pacific Butyraldehyde Market Revenue (Billion), by Product Type 2025 & 2033
- Figure 4: Asia Pacific Butyraldehyde Market Volume (K Tons), by Product Type 2025 & 2033
- Figure 5: Asia Pacific Butyraldehyde Market Revenue Share (%), by Product Type 2025 & 2033
- Figure 6: Asia Pacific Butyraldehyde Market Volume Share (%), by Product Type 2025 & 2033
- Figure 7: Asia Pacific Butyraldehyde Market Revenue (Billion), by Application 2025 & 2033
- Figure 8: Asia Pacific Butyraldehyde Market Volume (K Tons), by Application 2025 & 2033
- Figure 9: Asia Pacific Butyraldehyde Market Revenue Share (%), by Application 2025 & 2033
- Figure 10: Asia Pacific Butyraldehyde Market Volume Share (%), by Application 2025 & 2033
- Figure 11: Asia Pacific Butyraldehyde Market Revenue (Billion), by Country 2025 & 2033
- Figure 12: Asia Pacific Butyraldehyde Market Volume (K Tons), by Country 2025 & 2033
- Figure 13: Asia Pacific Butyraldehyde Market Revenue Share (%), by Country 2025 & 2033
- Figure 14: Asia Pacific Butyraldehyde Market Volume Share (%), by Country 2025 & 2033
- Figure 15: North America Butyraldehyde Market Revenue (Billion), by Product Type 2025 & 2033
- Figure 16: North America Butyraldehyde Market Volume (K Tons), by Product Type 2025 & 2033
- Figure 17: North America Butyraldehyde Market Revenue Share (%), by Product Type 2025 & 2033
- Figure 18: North America Butyraldehyde Market Volume Share (%), by Product Type 2025 & 2033
- Figure 19: North America Butyraldehyde Market Revenue (Billion), by Application 2025 & 2033
- Figure 20: North America Butyraldehyde Market Volume (K Tons), by Application 2025 & 2033
- Figure 21: North America Butyraldehyde Market Revenue Share (%), by Application 2025 & 2033
- Figure 22: North America Butyraldehyde Market Volume Share (%), by Application 2025 & 2033
- Figure 23: North America Butyraldehyde Market Revenue (Billion), by Country 2025 & 2033
- Figure 24: North America Butyraldehyde Market Volume (K Tons), by Country 2025 & 2033
- Figure 25: North America Butyraldehyde Market Revenue Share (%), by Country 2025 & 2033
- Figure 26: North America Butyraldehyde Market Volume Share (%), by Country 2025 & 2033
- Figure 27: Europe Butyraldehyde Market Revenue (Billion), by Product Type 2025 & 2033
- Figure 28: Europe Butyraldehyde Market Volume (K Tons), by Product Type 2025 & 2033
- Figure 29: Europe Butyraldehyde Market Revenue Share (%), by Product Type 2025 & 2033
- Figure 30: Europe Butyraldehyde Market Volume Share (%), by Product Type 2025 & 2033
- Figure 31: Europe Butyraldehyde Market Revenue (Billion), by Application 2025 & 2033
- Figure 32: Europe Butyraldehyde Market Volume (K Tons), by Application 2025 & 2033
- Figure 33: Europe Butyraldehyde Market Revenue Share (%), by Application 2025 & 2033
- Figure 34: Europe Butyraldehyde Market Volume Share (%), by Application 2025 & 2033
- Figure 35: Europe Butyraldehyde Market Revenue (Billion), by Country 2025 & 2033
- Figure 36: Europe Butyraldehyde Market Volume (K Tons), by Country 2025 & 2033
- Figure 37: Europe Butyraldehyde Market Revenue Share (%), by Country 2025 & 2033
- Figure 38: Europe Butyraldehyde Market Volume Share (%), by Country 2025 & 2033
- Figure 39: South America Butyraldehyde Market Revenue (Billion), by Product Type 2025 & 2033
- Figure 40: South America Butyraldehyde Market Volume (K Tons), by Product Type 2025 & 2033
- Figure 41: South America Butyraldehyde Market Revenue Share (%), by Product Type 2025 & 2033
- Figure 42: South America Butyraldehyde Market Volume Share (%), by Product Type 2025 & 2033
- Figure 43: South America Butyraldehyde Market Revenue (Billion), by Application 2025 & 2033
- Figure 44: South America Butyraldehyde Market Volume (K Tons), by Application 2025 & 2033
- Figure 45: South America Butyraldehyde Market Revenue Share (%), by Application 2025 & 2033
- Figure 46: South America Butyraldehyde Market Volume Share (%), by Application 2025 & 2033
- Figure 47: South America Butyraldehyde Market Revenue (Billion), by Country 2025 & 2033
- Figure 48: South America Butyraldehyde Market Volume (K Tons), by Country 2025 & 2033
- Figure 49: South America Butyraldehyde Market Revenue Share (%), by Country 2025 & 2033
- Figure 50: South America Butyraldehyde Market Volume Share (%), by Country 2025 & 2033
- Figure 51: Middle East and Africa Butyraldehyde Market Revenue (Billion), by Product Type 2025 & 2033
- Figure 52: Middle East and Africa Butyraldehyde Market Volume (K Tons), by Product Type 2025 & 2033
- Figure 53: Middle East and Africa Butyraldehyde Market Revenue Share (%), by Product Type 2025 & 2033
- Figure 54: Middle East and Africa Butyraldehyde Market Volume Share (%), by Product Type 2025 & 2033
- Figure 55: Middle East and Africa Butyraldehyde Market Revenue (Billion), by Application 2025 & 2033
- Figure 56: Middle East and Africa Butyraldehyde Market Volume (K Tons), by Application 2025 & 2033
- Figure 57: Middle East and Africa Butyraldehyde Market Revenue Share (%), by Application 2025 & 2033
- Figure 58: Middle East and Africa Butyraldehyde Market Volume Share (%), by Application 2025 & 2033
- Figure 59: Middle East and Africa Butyraldehyde Market Revenue (Billion), by Country 2025 & 2033
- Figure 60: Middle East and Africa Butyraldehyde Market Volume (K Tons), by Country 2025 & 2033
- Figure 61: Middle East and Africa Butyraldehyde Market Revenue Share (%), by Country 2025 & 2033
- Figure 62: Middle East and Africa Butyraldehyde Market Volume Share (%), by Country 2025 & 2033
List of Tables
- Table 1: Global Butyraldehyde Market Revenue Billion Forecast, by Product Type 2020 & 2033
- Table 2: Global Butyraldehyde Market Volume K Tons Forecast, by Product Type 2020 & 2033
- Table 3: Global Butyraldehyde Market Revenue Billion Forecast, by Application 2020 & 2033
- Table 4: Global Butyraldehyde Market Volume K Tons Forecast, by Application 2020 & 2033
- Table 5: Global Butyraldehyde Market Revenue Billion Forecast, by Region 2020 & 2033
- Table 6: Global Butyraldehyde Market Volume K Tons Forecast, by Region 2020 & 2033
- Table 7: Global Butyraldehyde Market Revenue Billion Forecast, by Product Type 2020 & 2033
- Table 8: Global Butyraldehyde Market Volume K Tons Forecast, by Product Type 2020 & 2033
- Table 9: Global Butyraldehyde Market Revenue Billion Forecast, by Application 2020 & 2033
- Table 10: Global Butyraldehyde Market Volume K Tons Forecast, by Application 2020 & 2033
- Table 11: Global Butyraldehyde Market Revenue Billion Forecast, by Country 2020 & 2033
- Table 12: Global Butyraldehyde Market Volume K Tons Forecast, by Country 2020 & 2033
- Table 13: China Butyraldehyde Market Revenue (Billion) Forecast, by Application 2020 & 2033
- Table 14: China Butyraldehyde Market Volume (K Tons) Forecast, by Application 2020 & 2033
- Table 15: India Butyraldehyde Market Revenue (Billion) Forecast, by Application 2020 & 2033
- Table 16: India Butyraldehyde Market Volume (K Tons) Forecast, by Application 2020 & 2033
- Table 17: Japan Butyraldehyde Market Revenue (Billion) Forecast, by Application 2020 & 2033
- Table 18: Japan Butyraldehyde Market Volume (K Tons) Forecast, by Application 2020 & 2033
- Table 19: South Korea Butyraldehyde Market Revenue (Billion) Forecast, by Application 2020 & 2033
- Table 20: South Korea Butyraldehyde Market Volume (K Tons) Forecast, by Application 2020 & 2033
- Table 21: Rest of Asia Pacific Butyraldehyde Market Revenue (Billion) Forecast, by Application 2020 & 2033
- Table 22: Rest of Asia Pacific Butyraldehyde Market Volume (K Tons) Forecast, by Application 2020 & 2033
- Table 23: Global Butyraldehyde Market Revenue Billion Forecast, by Product Type 2020 & 2033
- Table 24: Global Butyraldehyde Market Volume K Tons Forecast, by Product Type 2020 & 2033
- Table 25: Global Butyraldehyde Market Revenue Billion Forecast, by Application 2020 & 2033
- Table 26: Global Butyraldehyde Market Volume K Tons Forecast, by Application 2020 & 2033
- Table 27: Global Butyraldehyde Market Revenue Billion Forecast, by Country 2020 & 2033
- Table 28: Global Butyraldehyde Market Volume K Tons Forecast, by Country 2020 & 2033
- Table 29: United States Butyraldehyde Market Revenue (Billion) Forecast, by Application 2020 & 2033
- Table 30: United States Butyraldehyde Market Volume (K Tons) Forecast, by Application 2020 & 2033
- Table 31: Canada Butyraldehyde Market Revenue (Billion) Forecast, by Application 2020 & 2033
- Table 32: Canada Butyraldehyde Market Volume (K Tons) Forecast, by Application 2020 & 2033
- Table 33: Mexico Butyraldehyde Market Revenue (Billion) Forecast, by Application 2020 & 2033
- Table 34: Mexico Butyraldehyde Market Volume (K Tons) Forecast, by Application 2020 & 2033
- Table 35: Global Butyraldehyde Market Revenue Billion Forecast, by Product Type 2020 & 2033
- Table 36: Global Butyraldehyde Market Volume K Tons Forecast, by Product Type 2020 & 2033
- Table 37: Global Butyraldehyde Market Revenue Billion Forecast, by Application 2020 & 2033
- Table 38: Global Butyraldehyde Market Volume K Tons Forecast, by Application 2020 & 2033
- Table 39: Global Butyraldehyde Market Revenue Billion Forecast, by Country 2020 & 2033
- Table 40: Global Butyraldehyde Market Volume K Tons Forecast, by Country 2020 & 2033
- Table 41: Germany Butyraldehyde Market Revenue (Billion) Forecast, by Application 2020 & 2033
- Table 42: Germany Butyraldehyde Market Volume (K Tons) Forecast, by Application 2020 & 2033
- Table 43: United Kingdom Butyraldehyde Market Revenue (Billion) Forecast, by Application 2020 & 2033
- Table 44: United Kingdom Butyraldehyde Market Volume (K Tons) Forecast, by Application 2020 & 2033
- Table 45: France Butyraldehyde Market Revenue (Billion) Forecast, by Application 2020 & 2033
- Table 46: France Butyraldehyde Market Volume (K Tons) Forecast, by Application 2020 & 2033
- Table 47: Italy Butyraldehyde Market Revenue (Billion) Forecast, by Application 2020 & 2033
- Table 48: Italy Butyraldehyde Market Volume (K Tons) Forecast, by Application 2020 & 2033
- Table 49: Rest of Europe Butyraldehyde Market Revenue (Billion) Forecast, by Application 2020 & 2033
- Table 50: Rest of Europe Butyraldehyde Market Volume (K Tons) Forecast, by Application 2020 & 2033
- Table 51: Global Butyraldehyde Market Revenue Billion Forecast, by Product Type 2020 & 2033
- Table 52: Global Butyraldehyde Market Volume K Tons Forecast, by Product Type 2020 & 2033
- Table 53: Global Butyraldehyde Market Revenue Billion Forecast, by Application 2020 & 2033
- Table 54: Global Butyraldehyde Market Volume K Tons Forecast, by Application 2020 & 2033
- Table 55: Global Butyraldehyde Market Revenue Billion Forecast, by Country 2020 & 2033
- Table 56: Global Butyraldehyde Market Volume K Tons Forecast, by Country 2020 & 2033
- Table 57: Brazil Butyraldehyde Market Revenue (Billion) Forecast, by Application 2020 & 2033
- Table 58: Brazil Butyraldehyde Market Volume (K Tons) Forecast, by Application 2020 & 2033
- Table 59: Argentina Butyraldehyde Market Revenue (Billion) Forecast, by Application 2020 & 2033
- Table 60: Argentina Butyraldehyde Market Volume (K Tons) Forecast, by Application 2020 & 2033
- Table 61: Rest of South America Butyraldehyde Market Revenue (Billion) Forecast, by Application 2020 & 2033
- Table 62: Rest of South America Butyraldehyde Market Volume (K Tons) Forecast, by Application 2020 & 2033
- Table 63: Global Butyraldehyde Market Revenue Billion Forecast, by Product Type 2020 & 2033
- Table 64: Global Butyraldehyde Market Volume K Tons Forecast, by Product Type 2020 & 2033
- Table 65: Global Butyraldehyde Market Revenue Billion Forecast, by Application 2020 & 2033
- Table 66: Global Butyraldehyde Market Volume K Tons Forecast, by Application 2020 & 2033
- Table 67: Global Butyraldehyde Market Revenue Billion Forecast, by Country 2020 & 2033
- Table 68: Global Butyraldehyde Market Volume K Tons Forecast, by Country 2020 & 2033
- Table 69: Saudi Arabia Butyraldehyde Market Revenue (Billion) Forecast, by Application 2020 & 2033
- Table 70: Saudi Arabia Butyraldehyde Market Volume (K Tons) Forecast, by Application 2020 & 2033
- Table 71: South Africa Butyraldehyde Market Revenue (Billion) Forecast, by Application 2020 & 2033
- Table 72: South Africa Butyraldehyde Market Volume (K Tons) Forecast, by Application 2020 & 2033
- Table 73: Rest of Middle East and Africa Butyraldehyde Market Revenue (Billion) Forecast, by Application 2020 & 2033
- Table 74: Rest of Middle East and Africa Butyraldehyde Market Volume (K Tons) Forecast, by Application 2020 & 2033
Frequently Asked Questions
1. What is the projected Compound Annual Growth Rate (CAGR) of the Butyraldehyde Market?
The projected CAGR is approximately 3.72%.
2. Which companies are prominent players in the Butyraldehyde Market?
Key companies in the market include KH Neochem Co Ltd, Merck KGaA, Mitsubishi Chemical Corporation, GELEST INC, Tokyo Chemical Industry Co Ltd, Toronto Research Chemicals, BASF SE, DuPont, Eastman Chemical Company, Alfa Aesar Thermo Fisher Scientific, Aurochemicals, LobaChemie Pvt Ltd.
3. What are the main segments of the Butyraldehyde Market?
The market segments include Product Type, Application.
4. Can you provide details about the market size?
The market size is estimated to be USD 3.24 Billion as of 2022.
5. What are some drivers contributing to market growth?
; Increasing Demand from Paints and Coatings Sector; Other Drivers.
6. What are the notable trends driving market growth?
N-Butanol to Dominate the Market.
7. Are there any restraints impacting market growth?
; Health and Environmental Hazard of Butyraldehyde; Unfavorable Conditions Arising Due to COVID-19 Outbreak.
8. Can you provide examples of recent developments in the market?
N/A
9. What pricing options are available for accessing the report?
Pricing options include single-user, multi-user, and enterprise licenses priced at USD 4750, USD 5250, and USD 8750 respectively.
10. Is the market size provided in terms of value or volume?
The market size is provided in terms of value, measured in Billion and volume, measured in K Tons.
11. Are there any specific market keywords associated with the report?
Yes, the market keyword associated with the report is "Butyraldehyde Market," which aids in identifying and referencing the specific market segment covered.
12. How do I determine which pricing option suits my needs best?
The pricing options vary based on user requirements and access needs. Individual users may opt for single-user licenses, while businesses requiring broader access may choose multi-user or enterprise licenses for cost-effective access to the report.
13. Are there any additional resources or data provided in the Butyraldehyde Market report?
While the report offers comprehensive insights, it's advisable to review the specific contents or supplementary materials provided to ascertain if additional resources or data are available.
14. How can I stay updated on further developments or reports in the Butyraldehyde Market?
To stay informed about further developments, trends, and reports in the Butyraldehyde Market, consider subscribing to industry newsletters, following relevant companies and organizations, or regularly checking reputable industry news sources and publications.
Methodology
Step 1 - Identification of Relevant Samples Size from Population Database


Step 2 - Approaches for Defining Global Market Size (Value, Volume* & Price*)

Note*: In applicable scenarios
Step 3 - Data Sources
Primary Research
- Web Analytics
- Survey Reports
- Research Institute
- Latest Research Reports
- Opinion Leaders
Secondary Research
- Annual Reports
- White Paper
- Latest Press Release
- Industry Association
- Paid Database
- Investor Presentations

Step 4 - Data Triangulation
Involves using different sources of information in order to increase the validity of a study
These sources are likely to be stakeholders in a program - participants, other researchers, program staff, other community members, and so on.
Then we put all data in single framework & apply various statistical tools to find out the dynamic on the market.
During the analysis stage, feedback from the stakeholder groups would be compared to determine areas of agreement as well as areas of divergence