

Key Insights
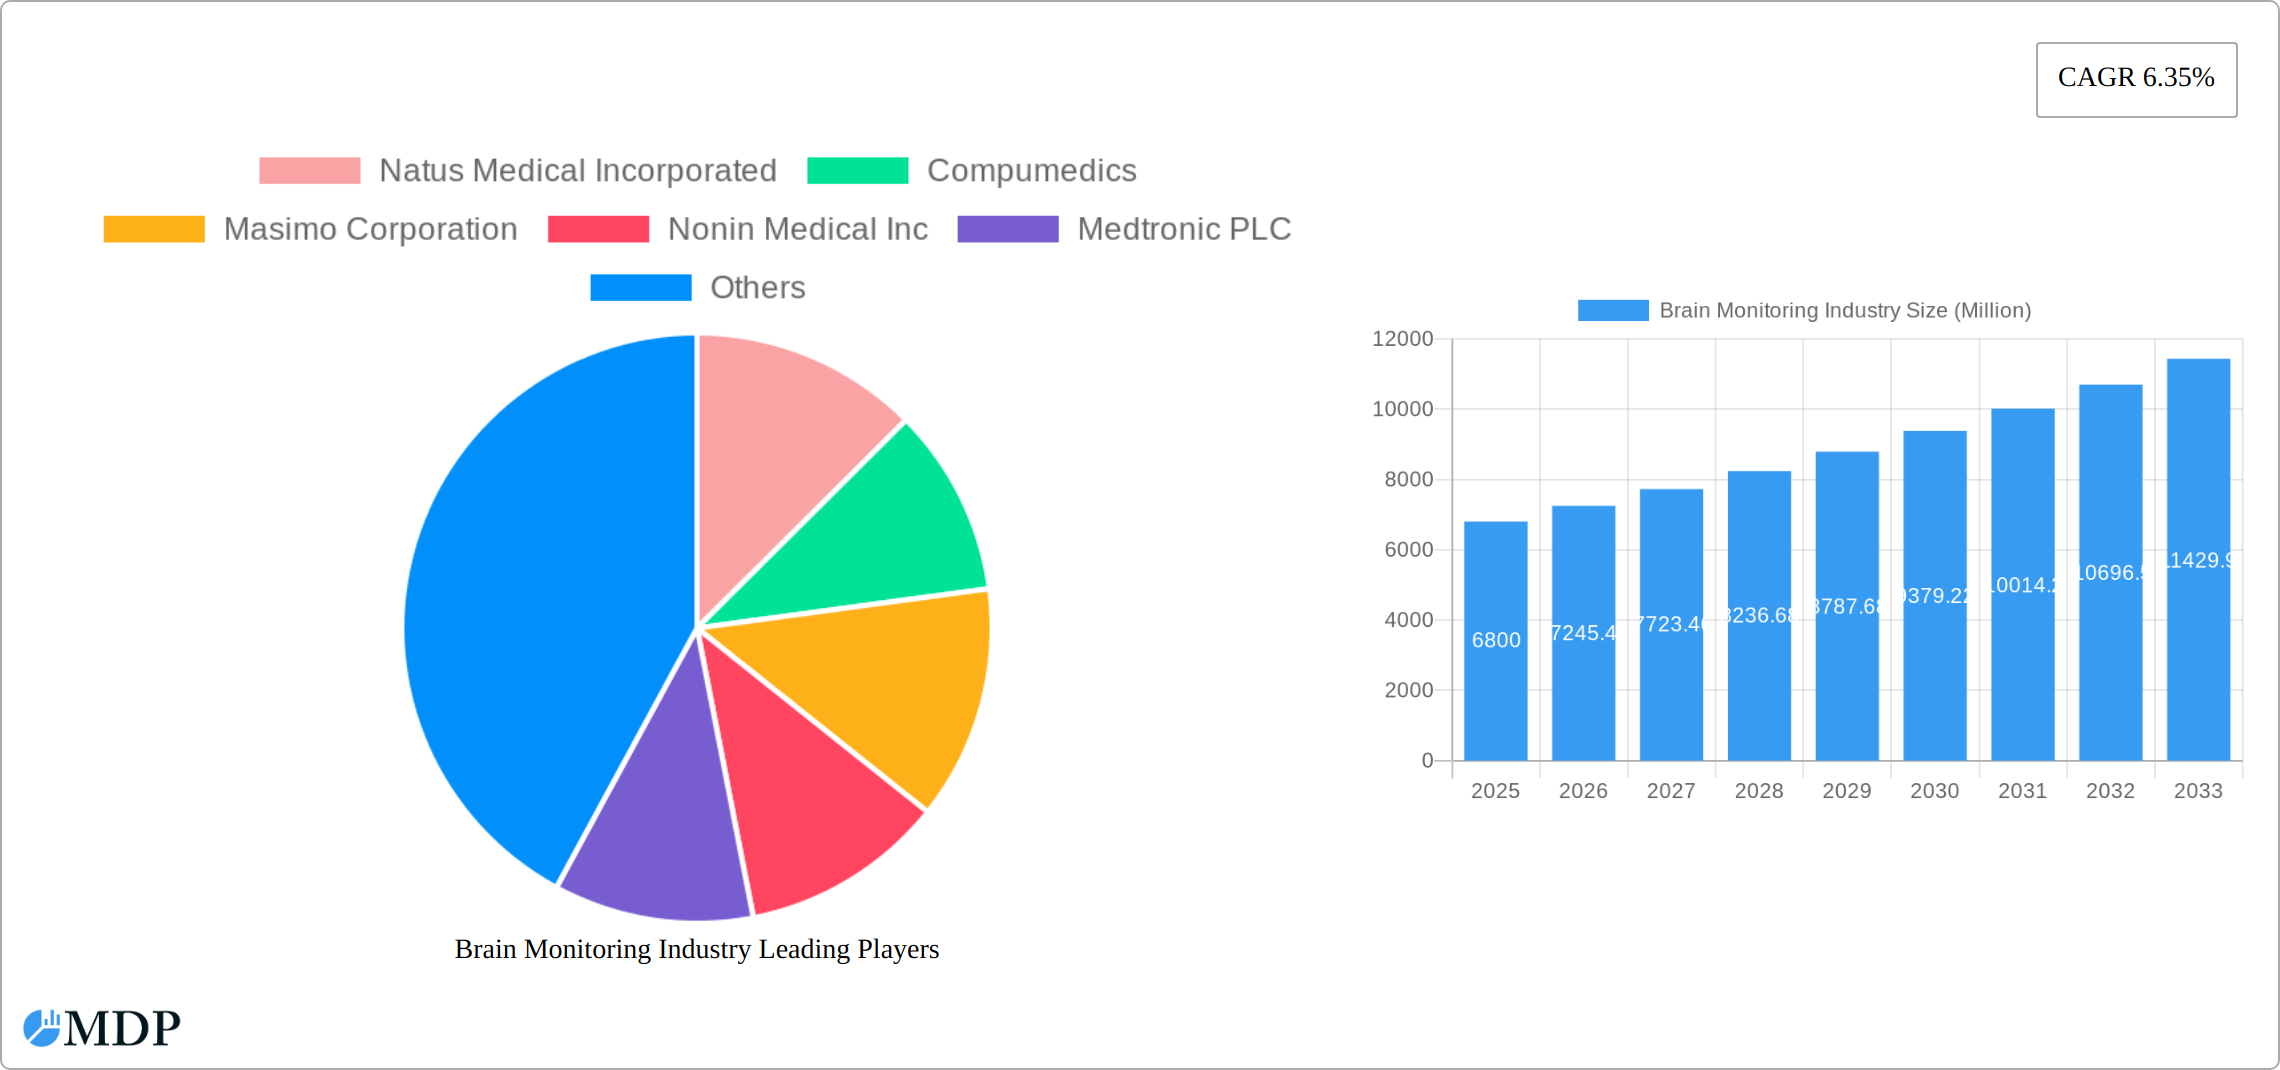
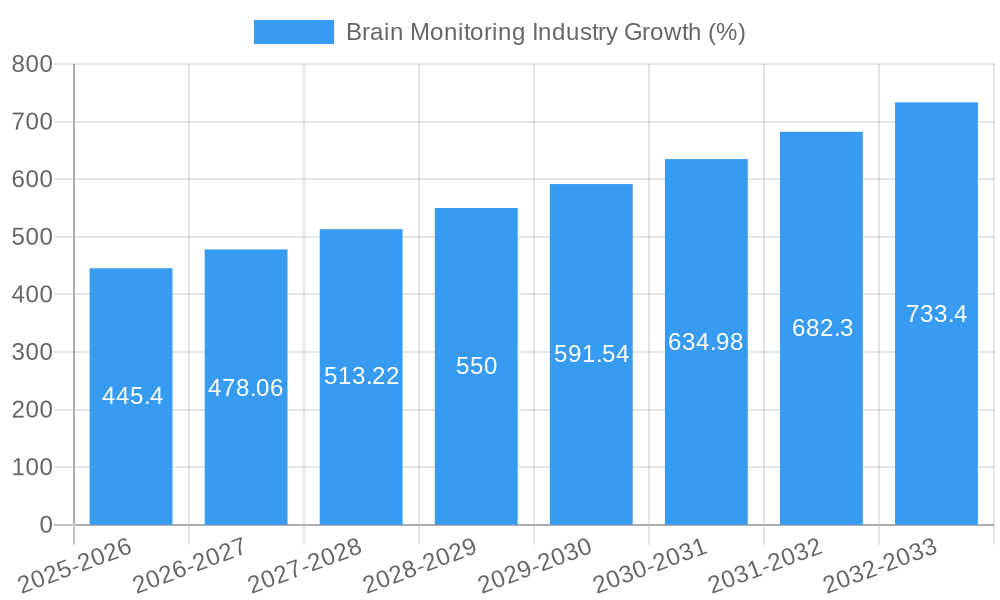
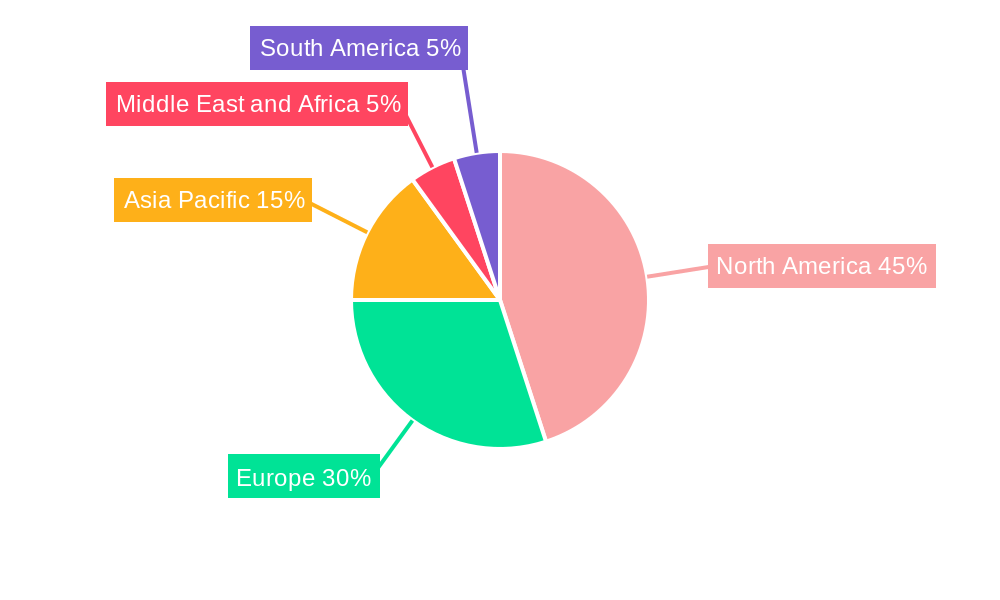
The global brain monitoring market, valued at $6.80 billion in 2025, is projected to experience robust growth, exhibiting a compound annual growth rate (CAGR) of 6.35% from 2025 to 2033. This expansion is fueled by several key drivers. The rising prevalence of neurological disorders like Parkinson's disease, epilepsy, traumatic brain injury, and dementia is a significant factor. Technological advancements leading to the development of more sophisticated and portable brain monitoring devices, such as improved EEG and fMRI systems, are also contributing to market growth. Furthermore, an increasing geriatric population globally increases the demand for effective brain health monitoring solutions. The market is segmented by product type (magnetoencephalograph, electroencephalograph, cerebral oximeters, fMRI, intracranial pressure monitoring devices, and others), application (Parkinson's disease, traumatic brain injury, epilepsy, dementia, sleep disorders, and others), and end-user (hospitals and diagnostic centers). The North American market currently holds a substantial share due to advanced healthcare infrastructure and high adoption rates of advanced technologies. However, Asia-Pacific is expected to witness significant growth in the coming years due to rising healthcare expenditure and increasing awareness of neurological disorders in developing economies.
Competitive rivalry is intense, with key players such as Natus Medical Incorporated, Compumedics, Masimo Corporation, and Medtronic PLC continually striving for innovation and market share. The market faces some restraints, including high costs associated with advanced brain monitoring technologies, which can limit accessibility in certain regions. Regulatory hurdles and reimbursement challenges in some healthcare systems also pose obstacles. Despite these challenges, the long-term outlook for the brain monitoring market remains positive, driven by continuous technological innovations, increasing awareness of neurological disorders, and the growing need for improved diagnosis and treatment options. The market is expected to see further segmentation and specialization, with a focus on developing personalized and preventative care solutions.
Brain Monitoring Industry: Market Report 2019-2033
A comprehensive analysis of the Brain Monitoring market, encompassing market size, segmentation, leading players, industry trends, and future growth prospects. This in-depth report provides a detailed overview of the Brain Monitoring industry, projecting a market value of xx Million by 2033. The study period covers 2019-2033, with 2025 serving as the base and estimated year. This report is crucial for investors, industry stakeholders, and businesses seeking to navigate this rapidly evolving sector.
Brain Monitoring Industry Market Dynamics & Concentration
The global brain monitoring market is characterized by a moderately consolidated landscape, with several key players holding significant market share. Market concentration is influenced by factors including technological advancements, regulatory approvals, and strategic mergers and acquisitions (M&A). The market share of the top 5 players is estimated at xx%, reflecting the presence of both established giants and innovative startups. Innovation in areas like wireless monitoring, AI-driven diagnostics, and improved sensor technology are key drivers. Stringent regulatory frameworks, particularly concerning medical device approvals (like the FDA in the US), significantly impact market entry and product adoption. Product substitutes, while limited, include traditional neurological examinations, posing a competitive challenge to some extent. End-user preferences are shifting towards minimally invasive, portable, and user-friendly devices. The historical period (2019-2024) witnessed approximately xx M&A deals, indicating a dynamic market with significant consolidation activity.
- Market Concentration: Top 5 players hold approximately xx% market share.
- Innovation Drivers: Wireless technology, AI integration, improved sensor technology.
- Regulatory Frameworks: Stringent FDA approvals impact market entry.
- Product Substitutes: Traditional neurological examinations.
- End-User Trends: Preference for minimally invasive and portable devices.
- M&A Activity: Approximately xx M&A deals during 2019-2024.
Brain Monitoring Industry Industry Trends & Analysis
The brain monitoring market exhibits a robust growth trajectory, driven by several key factors. The increasing prevalence of neurological disorders like Parkinson's disease, traumatic brain injury (TBI), epilepsy, and dementia is a major catalyst. Technological advancements, particularly in EEG and fMRI technology, are leading to more precise and efficient diagnostic tools. Consumer preferences are shifting towards less invasive and more convenient monitoring solutions. The competitive landscape is dynamic, with both established players and emerging companies vying for market share through innovation and strategic partnerships. The market is anticipated to register a Compound Annual Growth Rate (CAGR) of xx% during the forecast period (2025-2033), with market penetration increasing significantly in developing economies. Technological disruptions, such as the integration of artificial intelligence (AI) for data analysis and the development of advanced wearable sensors, are fundamentally reshaping the industry.
Leading Markets & Segments in Brain Monitoring Industry
The North American region currently dominates the global brain monitoring market, driven by factors such as advanced healthcare infrastructure, high prevalence of neurological disorders, and substantial investment in research and development. Within product types, electroencephalographs (EEGs) and intracranial pressure monitoring devices hold the largest market share, owing to their widespread use in hospitals and diagnostic centers. Applications like TBI and epilepsy treatment represent high-growth segments due to their significant unmet clinical needs.
- Key Drivers (North America): Advanced healthcare infrastructure, high prevalence of neurological disorders, strong R&D investment.
- Dominant Product Types: Electroencephalographs (EEGs) and Intracranial Pressure Monitoring Devices.
- High-Growth Applications: Traumatic Brain Injury (TBI) and Epilepsy.
- Dominant End-Users: Hospitals and Diagnostic Centers.
Brain Monitoring Industry Product Developments
Recent years have witnessed significant advancements in brain monitoring technology, including the development of portable and wireless devices, improved sensor technologies, and the integration of AI for real-time data analysis. These innovations enhance the accuracy and convenience of brain monitoring, expanding applications in both clinical settings and at-home care. This trend is expected to continue, with a focus on developing more sophisticated and user-friendly devices. The market is witnessing a strong push towards minimally invasive procedures and remote monitoring capabilities, driven by technological advancements and a rising preference for patient-centric care.
Key Drivers of Brain Monitoring Industry Growth
The brain monitoring market is propelled by a confluence of technological, economic, and regulatory factors. Technological innovations, including AI-driven diagnostics and improved sensor technology, enhance the accuracy and accessibility of brain monitoring. Increasing healthcare spending, particularly in developed nations, fuels market growth. Favorable regulatory policies supporting medical device innovation further stimulate market expansion. The rising prevalence of neurological disorders globally also contributes significantly to the industry’s growth trajectory.
Challenges in the Brain Monitoring Industry Market
The brain monitoring market faces several challenges, including stringent regulatory approval processes, which can delay product launches and increase costs. Supply chain disruptions and component shortages, particularly in the wake of global events, can impact production and availability. Intense competition among established players and emerging companies puts pressure on pricing and margins. The cost of sophisticated equipment and the need for skilled professionals can also hinder wider adoption.
Emerging Opportunities in Brain Monitoring Industry
The brain monitoring market presents exciting long-term opportunities fueled by technological advancements. The integration of AI and machine learning for real-time data analysis offers significant potential for improved diagnostic accuracy and personalized treatment plans. Strategic partnerships between technology companies and healthcare providers could create innovative solutions and expand market reach. The expansion into emerging markets with growing healthcare infrastructure presents significant untapped potential.
Leading Players in the Brain Monitoring Industry Sector
- Natus Medical Incorporated
- Compumedics
- Masimo Corporation
- Nonin Medical Inc
- Medtronic PLC
- Advanced Brain Monitoring Inc
- Cadwell Industries Inc
- Koninklijke Philips NV
- Integra Lifesciences Corporation
- Cerenion Oy
- Nihon Kohden Corporation
- General Electric Company
Key Milestones in Brain Monitoring Industry Industry
- November 2022: Neurosteer Inc. received FDA clearance for its single-channel EEG brain monitoring platform, expanding its application in various clinical settings and facilitating early detection of neurodegenerative disorders.
- February 2022: Masimo received FDA clearance for its SedLine brain function monitoring system for pediatric patients, expanding the availability of this technology to a wider population.
Strategic Outlook for Brain Monitoring Industry Market
The brain monitoring market is poised for substantial growth, driven by technological advancements, increasing prevalence of neurological disorders, and rising healthcare spending. Strategic partnerships and collaborations will be crucial for companies to gain a competitive edge. Focus on developing user-friendly, portable, and cost-effective devices will be key to expanding market access. The integration of AI and machine learning will revolutionize data analysis and personalized treatment approaches, further driving market expansion.
Brain Monitoring Industry Segmentation
-
1. Product Type
- 1.1. Magnetoencephalograph
- 1.2. Electroencephalograph
- 1.3. Cerebral Oximeters
- 1.4. Functional Magnetic Resonance Imaging (fMRI)
- 1.5. Intracranial Pressure Monitoring Devices
- 1.6. Other Product Types
-
2. Application
- 2.1. Parkinson's Disease
- 2.2. Traumatic Brain Injury
- 2.3. Epilepsy
- 2.4. Dementia
- 2.5. Sleep Disorders
- 2.6. Other Applications
-
3. End User
- 3.1. Hospitals
- 3.2. Diagnostic Centers
Brain Monitoring Industry Segmentation By Geography
-
1. North America
- 1.1. United States
- 1.2. Canada
- 1.3. Mexico
-
2. Europe
- 2.1. Germany
- 2.2. United Kingdom
- 2.3. France
- 2.4. Italy
- 2.5. Spain
- 2.6. Rest of Europe
-
3. Asia Pacific
- 3.1. China
- 3.2. Japan
- 3.3. India
- 3.4. Australia
- 3.5. South Korea
- 3.6. Rest of Asia Pacific
-
4. Middle East and Africa
- 4.1. GCC
- 4.2. South Africa
- 4.3. Rest of Middle East and Africa
-
5. South America
- 5.1. Brazil
- 5.2. Argentina
- 5.3. Rest of South America
Brain Monitoring Industry REPORT HIGHLIGHTS
| Aspects | Details |
|---|---|
| Study Period | 2019-2033 |
| Base Year | 2024 |
| Estimated Year | 2025 |
| Forecast Period | 2025-2033 |
| Historical Period | 2019-2024 |
| Growth Rate | CAGR of 6.35% from 2019-2033 |
| Segmentation |
|
Table of Contents
- 1. Introduction
- 1.1. Research Scope
- 1.2. Market Segmentation
- 1.3. Research Methodology
- 1.4. Definitions and Assumptions
- 2. Executive Summary
- 2.1. Introduction
- 3. Market Dynamics
- 3.1. Introduction
- 3.2. Market Drivers
- 3.2.1. Growing Geriatric Population; Rise in Incidences of Brain Disorders; Technological Advancements in Brain Monitoring Devices
- 3.3. Market Restrains
- 3.3.1. Stringent Regulations for the Device Approval; Lack of Skilled Personnel to Handle Devices
- 3.4. Market Trends
- 3.4.1. Electroencephalograph is Expected Witness a Healthy Growth Over the Forecast Period
- 4. Market Factor Analysis
- 4.1. Porters Five Forces
- 4.2. Supply/Value Chain
- 4.3. PESTEL analysis
- 4.4. Market Entropy
- 4.5. Patent/Trademark Analysis
- 5. Global Brain Monitoring Industry Analysis, Insights and Forecast, 2019-2031
- 5.1. Market Analysis, Insights and Forecast - by Product Type
- 5.1.1. Magnetoencephalograph
- 5.1.2. Electroencephalograph
- 5.1.3. Cerebral Oximeters
- 5.1.4. Functional Magnetic Resonance Imaging (fMRI)
- 5.1.5. Intracranial Pressure Monitoring Devices
- 5.1.6. Other Product Types
- 5.2. Market Analysis, Insights and Forecast - by Application
- 5.2.1. Parkinson's Disease
- 5.2.2. Traumatic Brain Injury
- 5.2.3. Epilepsy
- 5.2.4. Dementia
- 5.2.5. Sleep Disorders
- 5.2.6. Other Applications
- 5.3. Market Analysis, Insights and Forecast - by End User
- 5.3.1. Hospitals
- 5.3.2. Diagnostic Centers
- 5.4. Market Analysis, Insights and Forecast - by Region
- 5.4.1. North America
- 5.4.2. Europe
- 5.4.3. Asia Pacific
- 5.4.4. Middle East and Africa
- 5.4.5. South America
- 5.1. Market Analysis, Insights and Forecast - by Product Type
- 6. North America Brain Monitoring Industry Analysis, Insights and Forecast, 2019-2031
- 6.1. Market Analysis, Insights and Forecast - by Product Type
- 6.1.1. Magnetoencephalograph
- 6.1.2. Electroencephalograph
- 6.1.3. Cerebral Oximeters
- 6.1.4. Functional Magnetic Resonance Imaging (fMRI)
- 6.1.5. Intracranial Pressure Monitoring Devices
- 6.1.6. Other Product Types
- 6.2. Market Analysis, Insights and Forecast - by Application
- 6.2.1. Parkinson's Disease
- 6.2.2. Traumatic Brain Injury
- 6.2.3. Epilepsy
- 6.2.4. Dementia
- 6.2.5. Sleep Disorders
- 6.2.6. Other Applications
- 6.3. Market Analysis, Insights and Forecast - by End User
- 6.3.1. Hospitals
- 6.3.2. Diagnostic Centers
- 6.1. Market Analysis, Insights and Forecast - by Product Type
- 7. Europe Brain Monitoring Industry Analysis, Insights and Forecast, 2019-2031
- 7.1. Market Analysis, Insights and Forecast - by Product Type
- 7.1.1. Magnetoencephalograph
- 7.1.2. Electroencephalograph
- 7.1.3. Cerebral Oximeters
- 7.1.4. Functional Magnetic Resonance Imaging (fMRI)
- 7.1.5. Intracranial Pressure Monitoring Devices
- 7.1.6. Other Product Types
- 7.2. Market Analysis, Insights and Forecast - by Application
- 7.2.1. Parkinson's Disease
- 7.2.2. Traumatic Brain Injury
- 7.2.3. Epilepsy
- 7.2.4. Dementia
- 7.2.5. Sleep Disorders
- 7.2.6. Other Applications
- 7.3. Market Analysis, Insights and Forecast - by End User
- 7.3.1. Hospitals
- 7.3.2. Diagnostic Centers
- 7.1. Market Analysis, Insights and Forecast - by Product Type
- 8. Asia Pacific Brain Monitoring Industry Analysis, Insights and Forecast, 2019-2031
- 8.1. Market Analysis, Insights and Forecast - by Product Type
- 8.1.1. Magnetoencephalograph
- 8.1.2. Electroencephalograph
- 8.1.3. Cerebral Oximeters
- 8.1.4. Functional Magnetic Resonance Imaging (fMRI)
- 8.1.5. Intracranial Pressure Monitoring Devices
- 8.1.6. Other Product Types
- 8.2. Market Analysis, Insights and Forecast - by Application
- 8.2.1. Parkinson's Disease
- 8.2.2. Traumatic Brain Injury
- 8.2.3. Epilepsy
- 8.2.4. Dementia
- 8.2.5. Sleep Disorders
- 8.2.6. Other Applications
- 8.3. Market Analysis, Insights and Forecast - by End User
- 8.3.1. Hospitals
- 8.3.2. Diagnostic Centers
- 8.1. Market Analysis, Insights and Forecast - by Product Type
- 9. Middle East and Africa Brain Monitoring Industry Analysis, Insights and Forecast, 2019-2031
- 9.1. Market Analysis, Insights and Forecast - by Product Type
- 9.1.1. Magnetoencephalograph
- 9.1.2. Electroencephalograph
- 9.1.3. Cerebral Oximeters
- 9.1.4. Functional Magnetic Resonance Imaging (fMRI)
- 9.1.5. Intracranial Pressure Monitoring Devices
- 9.1.6. Other Product Types
- 9.2. Market Analysis, Insights and Forecast - by Application
- 9.2.1. Parkinson's Disease
- 9.2.2. Traumatic Brain Injury
- 9.2.3. Epilepsy
- 9.2.4. Dementia
- 9.2.5. Sleep Disorders
- 9.2.6. Other Applications
- 9.3. Market Analysis, Insights and Forecast - by End User
- 9.3.1. Hospitals
- 9.3.2. Diagnostic Centers
- 9.1. Market Analysis, Insights and Forecast - by Product Type
- 10. South America Brain Monitoring Industry Analysis, Insights and Forecast, 2019-2031
- 10.1. Market Analysis, Insights and Forecast - by Product Type
- 10.1.1. Magnetoencephalograph
- 10.1.2. Electroencephalograph
- 10.1.3. Cerebral Oximeters
- 10.1.4. Functional Magnetic Resonance Imaging (fMRI)
- 10.1.5. Intracranial Pressure Monitoring Devices
- 10.1.6. Other Product Types
- 10.2. Market Analysis, Insights and Forecast - by Application
- 10.2.1. Parkinson's Disease
- 10.2.2. Traumatic Brain Injury
- 10.2.3. Epilepsy
- 10.2.4. Dementia
- 10.2.5. Sleep Disorders
- 10.2.6. Other Applications
- 10.3. Market Analysis, Insights and Forecast - by End User
- 10.3.1. Hospitals
- 10.3.2. Diagnostic Centers
- 10.1. Market Analysis, Insights and Forecast - by Product Type
- 11. North America Brain Monitoring Industry Analysis, Insights and Forecast, 2019-2031
- 11.1. Market Analysis, Insights and Forecast - By Country/Sub-region
- 11.1.1 United States
- 11.1.2 Canada
- 11.1.3 Mexico
- 12. Europe Brain Monitoring Industry Analysis, Insights and Forecast, 2019-2031
- 12.1. Market Analysis, Insights and Forecast - By Country/Sub-region
- 12.1.1 Germany
- 12.1.2 United Kingdom
- 12.1.3 France
- 12.1.4 Italy
- 12.1.5 Spain
- 12.1.6 Rest of Europe
- 13. Asia Pacific Brain Monitoring Industry Analysis, Insights and Forecast, 2019-2031
- 13.1. Market Analysis, Insights and Forecast - By Country/Sub-region
- 13.1.1 China
- 13.1.2 Japan
- 13.1.3 India
- 13.1.4 Australia
- 13.1.5 South Korea
- 13.1.6 Rest of Asia Pacific
- 14. Middle East and Africa Brain Monitoring Industry Analysis, Insights and Forecast, 2019-2031
- 14.1. Market Analysis, Insights and Forecast - By Country/Sub-region
- 14.1.1 GCC
- 14.1.2 South Africa
- 14.1.3 Rest of Middle East and Africa
- 15. South America Brain Monitoring Industry Analysis, Insights and Forecast, 2019-2031
- 15.1. Market Analysis, Insights and Forecast - By Country/Sub-region
- 15.1.1 Brazil
- 15.1.2 Argentina
- 15.1.3 Rest of South America
- 16. Competitive Analysis
- 16.1. Global Market Share Analysis 2024
- 16.2. Company Profiles
- 16.2.1 Natus Medical Incorporated
- 16.2.1.1. Overview
- 16.2.1.2. Products
- 16.2.1.3. SWOT Analysis
- 16.2.1.4. Recent Developments
- 16.2.1.5. Financials (Based on Availability)
- 16.2.2 Compumedics
- 16.2.2.1. Overview
- 16.2.2.2. Products
- 16.2.2.3. SWOT Analysis
- 16.2.2.4. Recent Developments
- 16.2.2.5. Financials (Based on Availability)
- 16.2.3 Masimo Corporation
- 16.2.3.1. Overview
- 16.2.3.2. Products
- 16.2.3.3. SWOT Analysis
- 16.2.3.4. Recent Developments
- 16.2.3.5. Financials (Based on Availability)
- 16.2.4 Nonin Medical Inc
- 16.2.4.1. Overview
- 16.2.4.2. Products
- 16.2.4.3. SWOT Analysis
- 16.2.4.4. Recent Developments
- 16.2.4.5. Financials (Based on Availability)
- 16.2.5 Medtronic PLC
- 16.2.5.1. Overview
- 16.2.5.2. Products
- 16.2.5.3. SWOT Analysis
- 16.2.5.4. Recent Developments
- 16.2.5.5. Financials (Based on Availability)
- 16.2.6 Advanced Brain Monitoring Inc
- 16.2.6.1. Overview
- 16.2.6.2. Products
- 16.2.6.3. SWOT Analysis
- 16.2.6.4. Recent Developments
- 16.2.6.5. Financials (Based on Availability)
- 16.2.7 Cadwell Industries Inc
- 16.2.7.1. Overview
- 16.2.7.2. Products
- 16.2.7.3. SWOT Analysis
- 16.2.7.4. Recent Developments
- 16.2.7.5. Financials (Based on Availability)
- 16.2.8 Koninklijke Philips NV
- 16.2.8.1. Overview
- 16.2.8.2. Products
- 16.2.8.3. SWOT Analysis
- 16.2.8.4. Recent Developments
- 16.2.8.5. Financials (Based on Availability)
- 16.2.9 Integra Lifesciences Corporation
- 16.2.9.1. Overview
- 16.2.9.2. Products
- 16.2.9.3. SWOT Analysis
- 16.2.9.4. Recent Developments
- 16.2.9.5. Financials (Based on Availability)
- 16.2.10 Cerenion Oy
- 16.2.10.1. Overview
- 16.2.10.2. Products
- 16.2.10.3. SWOT Analysis
- 16.2.10.4. Recent Developments
- 16.2.10.5. Financials (Based on Availability)
- 16.2.11 Nihon Kohden Corporation
- 16.2.11.1. Overview
- 16.2.11.2. Products
- 16.2.11.3. SWOT Analysis
- 16.2.11.4. Recent Developments
- 16.2.11.5. Financials (Based on Availability)
- 16.2.12 General Electric Company
- 16.2.12.1. Overview
- 16.2.12.2. Products
- 16.2.12.3. SWOT Analysis
- 16.2.12.4. Recent Developments
- 16.2.12.5. Financials (Based on Availability)
- 16.2.1 Natus Medical Incorporated
List of Figures
- Figure 1: Global Brain Monitoring Industry Revenue Breakdown (Million, %) by Region 2024 & 2032
- Figure 2: Global Brain Monitoring Industry Volume Breakdown (K Unit, %) by Region 2024 & 2032
- Figure 3: North America Brain Monitoring Industry Revenue (Million), by Country 2024 & 2032
- Figure 4: North America Brain Monitoring Industry Volume (K Unit), by Country 2024 & 2032
- Figure 5: North America Brain Monitoring Industry Revenue Share (%), by Country 2024 & 2032
- Figure 6: North America Brain Monitoring Industry Volume Share (%), by Country 2024 & 2032
- Figure 7: Europe Brain Monitoring Industry Revenue (Million), by Country 2024 & 2032
- Figure 8: Europe Brain Monitoring Industry Volume (K Unit), by Country 2024 & 2032
- Figure 9: Europe Brain Monitoring Industry Revenue Share (%), by Country 2024 & 2032
- Figure 10: Europe Brain Monitoring Industry Volume Share (%), by Country 2024 & 2032
- Figure 11: Asia Pacific Brain Monitoring Industry Revenue (Million), by Country 2024 & 2032
- Figure 12: Asia Pacific Brain Monitoring Industry Volume (K Unit), by Country 2024 & 2032
- Figure 13: Asia Pacific Brain Monitoring Industry Revenue Share (%), by Country 2024 & 2032
- Figure 14: Asia Pacific Brain Monitoring Industry Volume Share (%), by Country 2024 & 2032
- Figure 15: Middle East and Africa Brain Monitoring Industry Revenue (Million), by Country 2024 & 2032
- Figure 16: Middle East and Africa Brain Monitoring Industry Volume (K Unit), by Country 2024 & 2032
- Figure 17: Middle East and Africa Brain Monitoring Industry Revenue Share (%), by Country 2024 & 2032
- Figure 18: Middle East and Africa Brain Monitoring Industry Volume Share (%), by Country 2024 & 2032
- Figure 19: South America Brain Monitoring Industry Revenue (Million), by Country 2024 & 2032
- Figure 20: South America Brain Monitoring Industry Volume (K Unit), by Country 2024 & 2032
- Figure 21: South America Brain Monitoring Industry Revenue Share (%), by Country 2024 & 2032
- Figure 22: South America Brain Monitoring Industry Volume Share (%), by Country 2024 & 2032
- Figure 23: North America Brain Monitoring Industry Revenue (Million), by Product Type 2024 & 2032
- Figure 24: North America Brain Monitoring Industry Volume (K Unit), by Product Type 2024 & 2032
- Figure 25: North America Brain Monitoring Industry Revenue Share (%), by Product Type 2024 & 2032
- Figure 26: North America Brain Monitoring Industry Volume Share (%), by Product Type 2024 & 2032
- Figure 27: North America Brain Monitoring Industry Revenue (Million), by Application 2024 & 2032
- Figure 28: North America Brain Monitoring Industry Volume (K Unit), by Application 2024 & 2032
- Figure 29: North America Brain Monitoring Industry Revenue Share (%), by Application 2024 & 2032
- Figure 30: North America Brain Monitoring Industry Volume Share (%), by Application 2024 & 2032
- Figure 31: North America Brain Monitoring Industry Revenue (Million), by End User 2024 & 2032
- Figure 32: North America Brain Monitoring Industry Volume (K Unit), by End User 2024 & 2032
- Figure 33: North America Brain Monitoring Industry Revenue Share (%), by End User 2024 & 2032
- Figure 34: North America Brain Monitoring Industry Volume Share (%), by End User 2024 & 2032
- Figure 35: North America Brain Monitoring Industry Revenue (Million), by Country 2024 & 2032
- Figure 36: North America Brain Monitoring Industry Volume (K Unit), by Country 2024 & 2032
- Figure 37: North America Brain Monitoring Industry Revenue Share (%), by Country 2024 & 2032
- Figure 38: North America Brain Monitoring Industry Volume Share (%), by Country 2024 & 2032
- Figure 39: Europe Brain Monitoring Industry Revenue (Million), by Product Type 2024 & 2032
- Figure 40: Europe Brain Monitoring Industry Volume (K Unit), by Product Type 2024 & 2032
- Figure 41: Europe Brain Monitoring Industry Revenue Share (%), by Product Type 2024 & 2032
- Figure 42: Europe Brain Monitoring Industry Volume Share (%), by Product Type 2024 & 2032
- Figure 43: Europe Brain Monitoring Industry Revenue (Million), by Application 2024 & 2032
- Figure 44: Europe Brain Monitoring Industry Volume (K Unit), by Application 2024 & 2032
- Figure 45: Europe Brain Monitoring Industry Revenue Share (%), by Application 2024 & 2032
- Figure 46: Europe Brain Monitoring Industry Volume Share (%), by Application 2024 & 2032
- Figure 47: Europe Brain Monitoring Industry Revenue (Million), by End User 2024 & 2032
- Figure 48: Europe Brain Monitoring Industry Volume (K Unit), by End User 2024 & 2032
- Figure 49: Europe Brain Monitoring Industry Revenue Share (%), by End User 2024 & 2032
- Figure 50: Europe Brain Monitoring Industry Volume Share (%), by End User 2024 & 2032
- Figure 51: Europe Brain Monitoring Industry Revenue (Million), by Country 2024 & 2032
- Figure 52: Europe Brain Monitoring Industry Volume (K Unit), by Country 2024 & 2032
- Figure 53: Europe Brain Monitoring Industry Revenue Share (%), by Country 2024 & 2032
- Figure 54: Europe Brain Monitoring Industry Volume Share (%), by Country 2024 & 2032
- Figure 55: Asia Pacific Brain Monitoring Industry Revenue (Million), by Product Type 2024 & 2032
- Figure 56: Asia Pacific Brain Monitoring Industry Volume (K Unit), by Product Type 2024 & 2032
- Figure 57: Asia Pacific Brain Monitoring Industry Revenue Share (%), by Product Type 2024 & 2032
- Figure 58: Asia Pacific Brain Monitoring Industry Volume Share (%), by Product Type 2024 & 2032
- Figure 59: Asia Pacific Brain Monitoring Industry Revenue (Million), by Application 2024 & 2032
- Figure 60: Asia Pacific Brain Monitoring Industry Volume (K Unit), by Application 2024 & 2032
- Figure 61: Asia Pacific Brain Monitoring Industry Revenue Share (%), by Application 2024 & 2032
- Figure 62: Asia Pacific Brain Monitoring Industry Volume Share (%), by Application 2024 & 2032
- Figure 63: Asia Pacific Brain Monitoring Industry Revenue (Million), by End User 2024 & 2032
- Figure 64: Asia Pacific Brain Monitoring Industry Volume (K Unit), by End User 2024 & 2032
- Figure 65: Asia Pacific Brain Monitoring Industry Revenue Share (%), by End User 2024 & 2032
- Figure 66: Asia Pacific Brain Monitoring Industry Volume Share (%), by End User 2024 & 2032
- Figure 67: Asia Pacific Brain Monitoring Industry Revenue (Million), by Country 2024 & 2032
- Figure 68: Asia Pacific Brain Monitoring Industry Volume (K Unit), by Country 2024 & 2032
- Figure 69: Asia Pacific Brain Monitoring Industry Revenue Share (%), by Country 2024 & 2032
- Figure 70: Asia Pacific Brain Monitoring Industry Volume Share (%), by Country 2024 & 2032
- Figure 71: Middle East and Africa Brain Monitoring Industry Revenue (Million), by Product Type 2024 & 2032
- Figure 72: Middle East and Africa Brain Monitoring Industry Volume (K Unit), by Product Type 2024 & 2032
- Figure 73: Middle East and Africa Brain Monitoring Industry Revenue Share (%), by Product Type 2024 & 2032
- Figure 74: Middle East and Africa Brain Monitoring Industry Volume Share (%), by Product Type 2024 & 2032
- Figure 75: Middle East and Africa Brain Monitoring Industry Revenue (Million), by Application 2024 & 2032
- Figure 76: Middle East and Africa Brain Monitoring Industry Volume (K Unit), by Application 2024 & 2032
- Figure 77: Middle East and Africa Brain Monitoring Industry Revenue Share (%), by Application 2024 & 2032
- Figure 78: Middle East and Africa Brain Monitoring Industry Volume Share (%), by Application 2024 & 2032
- Figure 79: Middle East and Africa Brain Monitoring Industry Revenue (Million), by End User 2024 & 2032
- Figure 80: Middle East and Africa Brain Monitoring Industry Volume (K Unit), by End User 2024 & 2032
- Figure 81: Middle East and Africa Brain Monitoring Industry Revenue Share (%), by End User 2024 & 2032
- Figure 82: Middle East and Africa Brain Monitoring Industry Volume Share (%), by End User 2024 & 2032
- Figure 83: Middle East and Africa Brain Monitoring Industry Revenue (Million), by Country 2024 & 2032
- Figure 84: Middle East and Africa Brain Monitoring Industry Volume (K Unit), by Country 2024 & 2032
- Figure 85: Middle East and Africa Brain Monitoring Industry Revenue Share (%), by Country 2024 & 2032
- Figure 86: Middle East and Africa Brain Monitoring Industry Volume Share (%), by Country 2024 & 2032
- Figure 87: South America Brain Monitoring Industry Revenue (Million), by Product Type 2024 & 2032
- Figure 88: South America Brain Monitoring Industry Volume (K Unit), by Product Type 2024 & 2032
- Figure 89: South America Brain Monitoring Industry Revenue Share (%), by Product Type 2024 & 2032
- Figure 90: South America Brain Monitoring Industry Volume Share (%), by Product Type 2024 & 2032
- Figure 91: South America Brain Monitoring Industry Revenue (Million), by Application 2024 & 2032
- Figure 92: South America Brain Monitoring Industry Volume (K Unit), by Application 2024 & 2032
- Figure 93: South America Brain Monitoring Industry Revenue Share (%), by Application 2024 & 2032
- Figure 94: South America Brain Monitoring Industry Volume Share (%), by Application 2024 & 2032
- Figure 95: South America Brain Monitoring Industry Revenue (Million), by End User 2024 & 2032
- Figure 96: South America Brain Monitoring Industry Volume (K Unit), by End User 2024 & 2032
- Figure 97: South America Brain Monitoring Industry Revenue Share (%), by End User 2024 & 2032
- Figure 98: South America Brain Monitoring Industry Volume Share (%), by End User 2024 & 2032
- Figure 99: South America Brain Monitoring Industry Revenue (Million), by Country 2024 & 2032
- Figure 100: South America Brain Monitoring Industry Volume (K Unit), by Country 2024 & 2032
- Figure 101: South America Brain Monitoring Industry Revenue Share (%), by Country 2024 & 2032
- Figure 102: South America Brain Monitoring Industry Volume Share (%), by Country 2024 & 2032
List of Tables
- Table 1: Global Brain Monitoring Industry Revenue Million Forecast, by Region 2019 & 2032
- Table 2: Global Brain Monitoring Industry Volume K Unit Forecast, by Region 2019 & 2032
- Table 3: Global Brain Monitoring Industry Revenue Million Forecast, by Product Type 2019 & 2032
- Table 4: Global Brain Monitoring Industry Volume K Unit Forecast, by Product Type 2019 & 2032
- Table 5: Global Brain Monitoring Industry Revenue Million Forecast, by Application 2019 & 2032
- Table 6: Global Brain Monitoring Industry Volume K Unit Forecast, by Application 2019 & 2032
- Table 7: Global Brain Monitoring Industry Revenue Million Forecast, by End User 2019 & 2032
- Table 8: Global Brain Monitoring Industry Volume K Unit Forecast, by End User 2019 & 2032
- Table 9: Global Brain Monitoring Industry Revenue Million Forecast, by Region 2019 & 2032
- Table 10: Global Brain Monitoring Industry Volume K Unit Forecast, by Region 2019 & 2032
- Table 11: Global Brain Monitoring Industry Revenue Million Forecast, by Country 2019 & 2032
- Table 12: Global Brain Monitoring Industry Volume K Unit Forecast, by Country 2019 & 2032
- Table 13: United States Brain Monitoring Industry Revenue (Million) Forecast, by Application 2019 & 2032
- Table 14: United States Brain Monitoring Industry Volume (K Unit) Forecast, by Application 2019 & 2032
- Table 15: Canada Brain Monitoring Industry Revenue (Million) Forecast, by Application 2019 & 2032
- Table 16: Canada Brain Monitoring Industry Volume (K Unit) Forecast, by Application 2019 & 2032
- Table 17: Mexico Brain Monitoring Industry Revenue (Million) Forecast, by Application 2019 & 2032
- Table 18: Mexico Brain Monitoring Industry Volume (K Unit) Forecast, by Application 2019 & 2032
- Table 19: Global Brain Monitoring Industry Revenue Million Forecast, by Country 2019 & 2032
- Table 20: Global Brain Monitoring Industry Volume K Unit Forecast, by Country 2019 & 2032
- Table 21: Germany Brain Monitoring Industry Revenue (Million) Forecast, by Application 2019 & 2032
- Table 22: Germany Brain Monitoring Industry Volume (K Unit) Forecast, by Application 2019 & 2032
- Table 23: United Kingdom Brain Monitoring Industry Revenue (Million) Forecast, by Application 2019 & 2032
- Table 24: United Kingdom Brain Monitoring Industry Volume (K Unit) Forecast, by Application 2019 & 2032
- Table 25: France Brain Monitoring Industry Revenue (Million) Forecast, by Application 2019 & 2032
- Table 26: France Brain Monitoring Industry Volume (K Unit) Forecast, by Application 2019 & 2032
- Table 27: Italy Brain Monitoring Industry Revenue (Million) Forecast, by Application 2019 & 2032
- Table 28: Italy Brain Monitoring Industry Volume (K Unit) Forecast, by Application 2019 & 2032
- Table 29: Spain Brain Monitoring Industry Revenue (Million) Forecast, by Application 2019 & 2032
- Table 30: Spain Brain Monitoring Industry Volume (K Unit) Forecast, by Application 2019 & 2032
- Table 31: Rest of Europe Brain Monitoring Industry Revenue (Million) Forecast, by Application 2019 & 2032
- Table 32: Rest of Europe Brain Monitoring Industry Volume (K Unit) Forecast, by Application 2019 & 2032
- Table 33: Global Brain Monitoring Industry Revenue Million Forecast, by Country 2019 & 2032
- Table 34: Global Brain Monitoring Industry Volume K Unit Forecast, by Country 2019 & 2032
- Table 35: China Brain Monitoring Industry Revenue (Million) Forecast, by Application 2019 & 2032
- Table 36: China Brain Monitoring Industry Volume (K Unit) Forecast, by Application 2019 & 2032
- Table 37: Japan Brain Monitoring Industry Revenue (Million) Forecast, by Application 2019 & 2032
- Table 38: Japan Brain Monitoring Industry Volume (K Unit) Forecast, by Application 2019 & 2032
- Table 39: India Brain Monitoring Industry Revenue (Million) Forecast, by Application 2019 & 2032
- Table 40: India Brain Monitoring Industry Volume (K Unit) Forecast, by Application 2019 & 2032
- Table 41: Australia Brain Monitoring Industry Revenue (Million) Forecast, by Application 2019 & 2032
- Table 42: Australia Brain Monitoring Industry Volume (K Unit) Forecast, by Application 2019 & 2032
- Table 43: South Korea Brain Monitoring Industry Revenue (Million) Forecast, by Application 2019 & 2032
- Table 44: South Korea Brain Monitoring Industry Volume (K Unit) Forecast, by Application 2019 & 2032
- Table 45: Rest of Asia Pacific Brain Monitoring Industry Revenue (Million) Forecast, by Application 2019 & 2032
- Table 46: Rest of Asia Pacific Brain Monitoring Industry Volume (K Unit) Forecast, by Application 2019 & 2032
- Table 47: Global Brain Monitoring Industry Revenue Million Forecast, by Country 2019 & 2032
- Table 48: Global Brain Monitoring Industry Volume K Unit Forecast, by Country 2019 & 2032
- Table 49: GCC Brain Monitoring Industry Revenue (Million) Forecast, by Application 2019 & 2032
- Table 50: GCC Brain Monitoring Industry Volume (K Unit) Forecast, by Application 2019 & 2032
- Table 51: South Africa Brain Monitoring Industry Revenue (Million) Forecast, by Application 2019 & 2032
- Table 52: South Africa Brain Monitoring Industry Volume (K Unit) Forecast, by Application 2019 & 2032
- Table 53: Rest of Middle East and Africa Brain Monitoring Industry Revenue (Million) Forecast, by Application 2019 & 2032
- Table 54: Rest of Middle East and Africa Brain Monitoring Industry Volume (K Unit) Forecast, by Application 2019 & 2032
- Table 55: Global Brain Monitoring Industry Revenue Million Forecast, by Country 2019 & 2032
- Table 56: Global Brain Monitoring Industry Volume K Unit Forecast, by Country 2019 & 2032
- Table 57: Brazil Brain Monitoring Industry Revenue (Million) Forecast, by Application 2019 & 2032
- Table 58: Brazil Brain Monitoring Industry Volume (K Unit) Forecast, by Application 2019 & 2032
- Table 59: Argentina Brain Monitoring Industry Revenue (Million) Forecast, by Application 2019 & 2032
- Table 60: Argentina Brain Monitoring Industry Volume (K Unit) Forecast, by Application 2019 & 2032
- Table 61: Rest of South America Brain Monitoring Industry Revenue (Million) Forecast, by Application 2019 & 2032
- Table 62: Rest of South America Brain Monitoring Industry Volume (K Unit) Forecast, by Application 2019 & 2032
- Table 63: Global Brain Monitoring Industry Revenue Million Forecast, by Product Type 2019 & 2032
- Table 64: Global Brain Monitoring Industry Volume K Unit Forecast, by Product Type 2019 & 2032
- Table 65: Global Brain Monitoring Industry Revenue Million Forecast, by Application 2019 & 2032
- Table 66: Global Brain Monitoring Industry Volume K Unit Forecast, by Application 2019 & 2032
- Table 67: Global Brain Monitoring Industry Revenue Million Forecast, by End User 2019 & 2032
- Table 68: Global Brain Monitoring Industry Volume K Unit Forecast, by End User 2019 & 2032
- Table 69: Global Brain Monitoring Industry Revenue Million Forecast, by Country 2019 & 2032
- Table 70: Global Brain Monitoring Industry Volume K Unit Forecast, by Country 2019 & 2032
- Table 71: United States Brain Monitoring Industry Revenue (Million) Forecast, by Application 2019 & 2032
- Table 72: United States Brain Monitoring Industry Volume (K Unit) Forecast, by Application 2019 & 2032
- Table 73: Canada Brain Monitoring Industry Revenue (Million) Forecast, by Application 2019 & 2032
- Table 74: Canada Brain Monitoring Industry Volume (K Unit) Forecast, by Application 2019 & 2032
- Table 75: Mexico Brain Monitoring Industry Revenue (Million) Forecast, by Application 2019 & 2032
- Table 76: Mexico Brain Monitoring Industry Volume (K Unit) Forecast, by Application 2019 & 2032
- Table 77: Global Brain Monitoring Industry Revenue Million Forecast, by Product Type 2019 & 2032
- Table 78: Global Brain Monitoring Industry Volume K Unit Forecast, by Product Type 2019 & 2032
- Table 79: Global Brain Monitoring Industry Revenue Million Forecast, by Application 2019 & 2032
- Table 80: Global Brain Monitoring Industry Volume K Unit Forecast, by Application 2019 & 2032
- Table 81: Global Brain Monitoring Industry Revenue Million Forecast, by End User 2019 & 2032
- Table 82: Global Brain Monitoring Industry Volume K Unit Forecast, by End User 2019 & 2032
- Table 83: Global Brain Monitoring Industry Revenue Million Forecast, by Country 2019 & 2032
- Table 84: Global Brain Monitoring Industry Volume K Unit Forecast, by Country 2019 & 2032
- Table 85: Germany Brain Monitoring Industry Revenue (Million) Forecast, by Application 2019 & 2032
- Table 86: Germany Brain Monitoring Industry Volume (K Unit) Forecast, by Application 2019 & 2032
- Table 87: United Kingdom Brain Monitoring Industry Revenue (Million) Forecast, by Application 2019 & 2032
- Table 88: United Kingdom Brain Monitoring Industry Volume (K Unit) Forecast, by Application 2019 & 2032
- Table 89: France Brain Monitoring Industry Revenue (Million) Forecast, by Application 2019 & 2032
- Table 90: France Brain Monitoring Industry Volume (K Unit) Forecast, by Application 2019 & 2032
- Table 91: Italy Brain Monitoring Industry Revenue (Million) Forecast, by Application 2019 & 2032
- Table 92: Italy Brain Monitoring Industry Volume (K Unit) Forecast, by Application 2019 & 2032
- Table 93: Spain Brain Monitoring Industry Revenue (Million) Forecast, by Application 2019 & 2032
- Table 94: Spain Brain Monitoring Industry Volume (K Unit) Forecast, by Application 2019 & 2032
- Table 95: Rest of Europe Brain Monitoring Industry Revenue (Million) Forecast, by Application 2019 & 2032
- Table 96: Rest of Europe Brain Monitoring Industry Volume (K Unit) Forecast, by Application 2019 & 2032
- Table 97: Global Brain Monitoring Industry Revenue Million Forecast, by Product Type 2019 & 2032
- Table 98: Global Brain Monitoring Industry Volume K Unit Forecast, by Product Type 2019 & 2032
- Table 99: Global Brain Monitoring Industry Revenue Million Forecast, by Application 2019 & 2032
- Table 100: Global Brain Monitoring Industry Volume K Unit Forecast, by Application 2019 & 2032
- Table 101: Global Brain Monitoring Industry Revenue Million Forecast, by End User 2019 & 2032
- Table 102: Global Brain Monitoring Industry Volume K Unit Forecast, by End User 2019 & 2032
- Table 103: Global Brain Monitoring Industry Revenue Million Forecast, by Country 2019 & 2032
- Table 104: Global Brain Monitoring Industry Volume K Unit Forecast, by Country 2019 & 2032
- Table 105: China Brain Monitoring Industry Revenue (Million) Forecast, by Application 2019 & 2032
- Table 106: China Brain Monitoring Industry Volume (K Unit) Forecast, by Application 2019 & 2032
- Table 107: Japan Brain Monitoring Industry Revenue (Million) Forecast, by Application 2019 & 2032
- Table 108: Japan Brain Monitoring Industry Volume (K Unit) Forecast, by Application 2019 & 2032
- Table 109: India Brain Monitoring Industry Revenue (Million) Forecast, by Application 2019 & 2032
- Table 110: India Brain Monitoring Industry Volume (K Unit) Forecast, by Application 2019 & 2032
- Table 111: Australia Brain Monitoring Industry Revenue (Million) Forecast, by Application 2019 & 2032
- Table 112: Australia Brain Monitoring Industry Volume (K Unit) Forecast, by Application 2019 & 2032
- Table 113: South Korea Brain Monitoring Industry Revenue (Million) Forecast, by Application 2019 & 2032
- Table 114: South Korea Brain Monitoring Industry Volume (K Unit) Forecast, by Application 2019 & 2032
- Table 115: Rest of Asia Pacific Brain Monitoring Industry Revenue (Million) Forecast, by Application 2019 & 2032
- Table 116: Rest of Asia Pacific Brain Monitoring Industry Volume (K Unit) Forecast, by Application 2019 & 2032
- Table 117: Global Brain Monitoring Industry Revenue Million Forecast, by Product Type 2019 & 2032
- Table 118: Global Brain Monitoring Industry Volume K Unit Forecast, by Product Type 2019 & 2032
- Table 119: Global Brain Monitoring Industry Revenue Million Forecast, by Application 2019 & 2032
- Table 120: Global Brain Monitoring Industry Volume K Unit Forecast, by Application 2019 & 2032
- Table 121: Global Brain Monitoring Industry Revenue Million Forecast, by End User 2019 & 2032
- Table 122: Global Brain Monitoring Industry Volume K Unit Forecast, by End User 2019 & 2032
- Table 123: Global Brain Monitoring Industry Revenue Million Forecast, by Country 2019 & 2032
- Table 124: Global Brain Monitoring Industry Volume K Unit Forecast, by Country 2019 & 2032
- Table 125: GCC Brain Monitoring Industry Revenue (Million) Forecast, by Application 2019 & 2032
- Table 126: GCC Brain Monitoring Industry Volume (K Unit) Forecast, by Application 2019 & 2032
- Table 127: South Africa Brain Monitoring Industry Revenue (Million) Forecast, by Application 2019 & 2032
- Table 128: South Africa Brain Monitoring Industry Volume (K Unit) Forecast, by Application 2019 & 2032
- Table 129: Rest of Middle East and Africa Brain Monitoring Industry Revenue (Million) Forecast, by Application 2019 & 2032
- Table 130: Rest of Middle East and Africa Brain Monitoring Industry Volume (K Unit) Forecast, by Application 2019 & 2032
- Table 131: Global Brain Monitoring Industry Revenue Million Forecast, by Product Type 2019 & 2032
- Table 132: Global Brain Monitoring Industry Volume K Unit Forecast, by Product Type 2019 & 2032
- Table 133: Global Brain Monitoring Industry Revenue Million Forecast, by Application 2019 & 2032
- Table 134: Global Brain Monitoring Industry Volume K Unit Forecast, by Application 2019 & 2032
- Table 135: Global Brain Monitoring Industry Revenue Million Forecast, by End User 2019 & 2032
- Table 136: Global Brain Monitoring Industry Volume K Unit Forecast, by End User 2019 & 2032
- Table 137: Global Brain Monitoring Industry Revenue Million Forecast, by Country 2019 & 2032
- Table 138: Global Brain Monitoring Industry Volume K Unit Forecast, by Country 2019 & 2032
- Table 139: Brazil Brain Monitoring Industry Revenue (Million) Forecast, by Application 2019 & 2032
- Table 140: Brazil Brain Monitoring Industry Volume (K Unit) Forecast, by Application 2019 & 2032
- Table 141: Argentina Brain Monitoring Industry Revenue (Million) Forecast, by Application 2019 & 2032
- Table 142: Argentina Brain Monitoring Industry Volume (K Unit) Forecast, by Application 2019 & 2032
- Table 143: Rest of South America Brain Monitoring Industry Revenue (Million) Forecast, by Application 2019 & 2032
- Table 144: Rest of South America Brain Monitoring Industry Volume (K Unit) Forecast, by Application 2019 & 2032
Frequently Asked Questions
1. What is the projected Compound Annual Growth Rate (CAGR) of the Brain Monitoring Industry?
The projected CAGR is approximately 6.35%.
2. Which companies are prominent players in the Brain Monitoring Industry?
Key companies in the market include Natus Medical Incorporated, Compumedics, Masimo Corporation, Nonin Medical Inc, Medtronic PLC, Advanced Brain Monitoring Inc, Cadwell Industries Inc, Koninklijke Philips NV, Integra Lifesciences Corporation, Cerenion Oy, Nihon Kohden Corporation, General Electric Company.
3. What are the main segments of the Brain Monitoring Industry?
The market segments include Product Type, Application, End User.
4. Can you provide details about the market size?
The market size is estimated to be USD 6.80 Million as of 2022.
5. What are some drivers contributing to market growth?
Growing Geriatric Population; Rise in Incidences of Brain Disorders; Technological Advancements in Brain Monitoring Devices.
6. What are the notable trends driving market growth?
Electroencephalograph is Expected Witness a Healthy Growth Over the Forecast Period.
7. Are there any restraints impacting market growth?
Stringent Regulations for the Device Approval; Lack of Skilled Personnel to Handle Devices.
8. Can you provide examples of recent developments in the market?
November 2022: Neurosteer Inc. received FDA clearance for its Neurosteer single-channel EEG brain monitoring platform. This clearance enables the use of Neurosteer's unobtrusive multi-purpose system in a broad range of clinical settings. The platform offers continuous brain monitoring in the ICU to support critical interventions, and aids in the early detection of pre-symptomatic cognitive decline, including Alzheimer's, Parkinson's, and dementia, in a doctor's office. It assists in the rapid and cost-effective massive screening of subjects who may be suffering from neurodegenerative disorders in pharma drug trials.
9. What pricing options are available for accessing the report?
Pricing options include single-user, multi-user, and enterprise licenses priced at USD 4750, USD 5250, and USD 8750 respectively.
10. Is the market size provided in terms of value or volume?
The market size is provided in terms of value, measured in Million and volume, measured in K Unit.
11. Are there any specific market keywords associated with the report?
Yes, the market keyword associated with the report is "Brain Monitoring Industry," which aids in identifying and referencing the specific market segment covered.
12. How do I determine which pricing option suits my needs best?
The pricing options vary based on user requirements and access needs. Individual users may opt for single-user licenses, while businesses requiring broader access may choose multi-user or enterprise licenses for cost-effective access to the report.
13. Are there any additional resources or data provided in the Brain Monitoring Industry report?
While the report offers comprehensive insights, it's advisable to review the specific contents or supplementary materials provided to ascertain if additional resources or data are available.
14. How can I stay updated on further developments or reports in the Brain Monitoring Industry?
To stay informed about further developments, trends, and reports in the Brain Monitoring Industry, consider subscribing to industry newsletters, following relevant companies and organizations, or regularly checking reputable industry news sources and publications.
Methodology
Step 1 - Identification of Relevant Samples Size from Population Database


Step 2 - Approaches for Defining Global Market Size (Value, Volume* & Price*)

Note*: In applicable scenarios
Step 3 - Data Sources
Primary Research
- Web Analytics
- Survey Reports
- Research Institute
- Latest Research Reports
- Opinion Leaders
Secondary Research
- Annual Reports
- White Paper
- Latest Press Release
- Industry Association
- Paid Database
- Investor Presentations

Step 4 - Data Triangulation
Involves using different sources of information in order to increase the validity of a study
These sources are likely to be stakeholders in a program - participants, other researchers, program staff, other community members, and so on.
Then we put all data in single framework & apply various statistical tools to find out the dynamic on the market.
During the analysis stage, feedback from the stakeholder groups would be compared to determine areas of agreement as well as areas of divergence
