

Key Insights
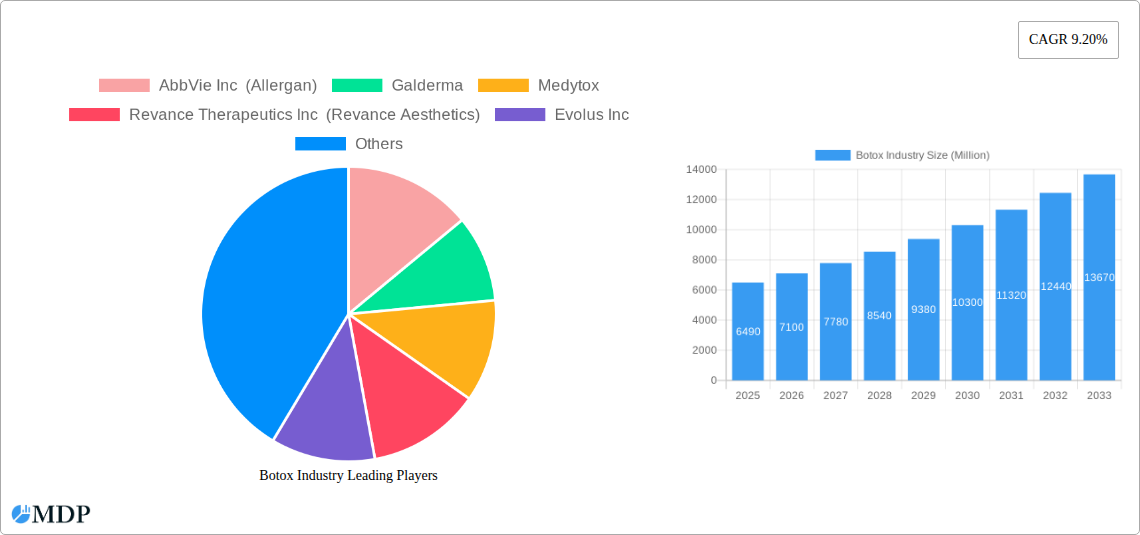
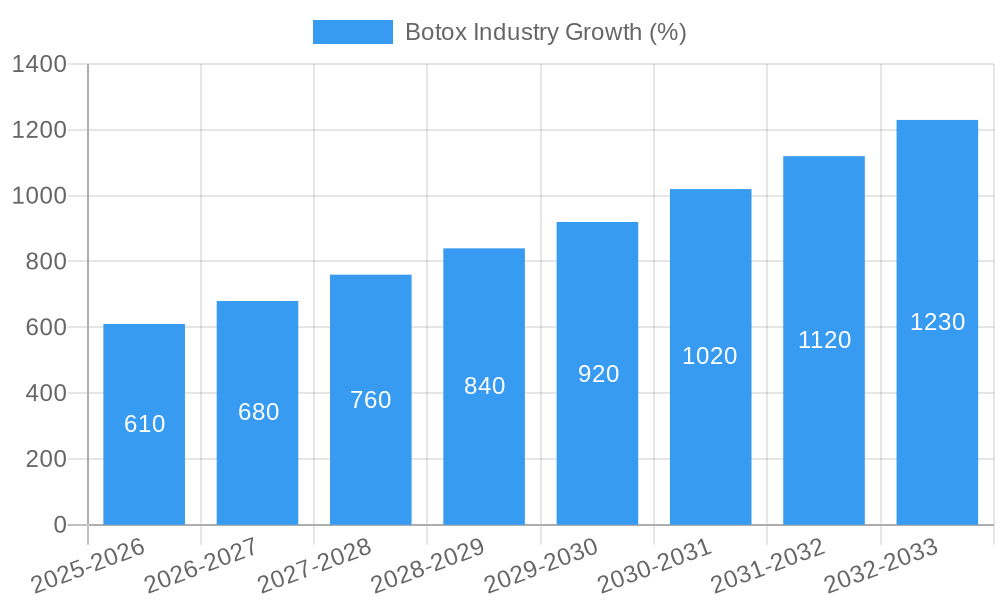
The global Botox market, valued at $6.49 billion in 2025, is poised for robust growth, exhibiting a Compound Annual Growth Rate (CAGR) of 9.20% from 2025 to 2033. This expansion is driven by several key factors. The increasing prevalence of aesthetic concerns, particularly among younger demographics, fuels demand for non-invasive cosmetic procedures like Botox injections. Technological advancements leading to improved formulations and delivery methods enhance efficacy and patient experience, further stimulating market growth. Furthermore, the rising disposable incomes in developing economies, coupled with increased awareness of Botox's therapeutic applications in treating conditions like migraines and excessive sweating, contribute significantly to market expansion. The market is segmented by application (cosmetic and non-cosmetic) and end-user (spas, clinics, and hospitals). While cosmetic applications currently dominate, the therapeutic segment is witnessing substantial growth, driven by expanding clinical applications and ongoing research. Competition is intense, with established players like AbbVie (Allergan), Galderma, and Merz Pharma competing alongside newer entrants, fostering innovation and driving down prices, making the treatment more accessible.
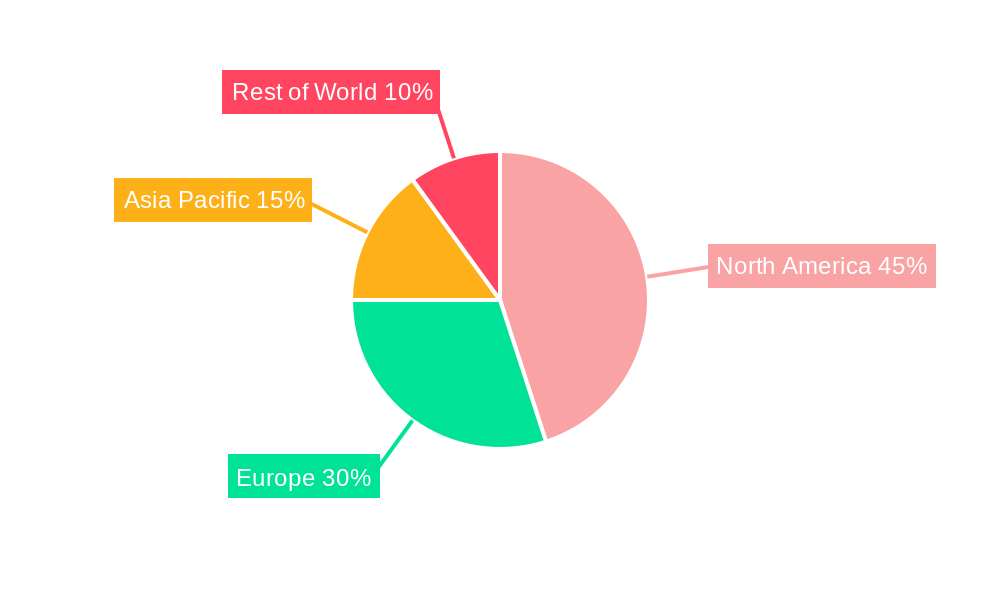
Geographical distribution reveals North America as a dominant market, benefiting from high disposable incomes and a strong aesthetic medicine sector. Europe and Asia Pacific represent significant growth opportunities, fueled by rising awareness and adoption rates. However, regulatory hurdles and varying reimbursement policies across different regions pose challenges. The market faces some restraints, including potential side effects, the need for repeat treatments, and the emergence of alternative aesthetic procedures. Nevertheless, ongoing research and development focused on improving efficacy, minimizing side effects, and expanding therapeutic applications are expected to mitigate these challenges and sustain the market's robust growth trajectory over the forecast period. The projected market size in 2033 will significantly surpass the 2025 value, driven by the aforementioned factors. A conservative estimate, considering the CAGR and market dynamics, suggests a market size exceeding $15 billion by 2033.
Botox Industry Market Report: 2019-2033
This comprehensive report provides an in-depth analysis of the global Botox industry, encompassing market dynamics, leading players, emerging trends, and future growth prospects. The report covers the period from 2019 to 2033, with a focus on the 2025-2033 forecast period. The market is valued at xx Million in 2025 and is projected to reach xx Million by 2033, exhibiting a CAGR of xx%. This report is essential for industry stakeholders, investors, and anyone seeking to understand the complexities and opportunities within this rapidly evolving market.
Botox Industry Market Dynamics & Concentration
The global Botox market is characterized by a moderately concentrated landscape, with key players such as AbbVie Inc (Allergan), Galderma, and Revance Therapeutics Inc (Revance Aesthetics) holding significant market share. Market concentration is further influenced by factors such as regulatory approvals, intellectual property rights, and brand recognition. Innovation plays a vital role, with companies continuously developing new formulations, applications, and delivery methods to cater to evolving consumer preferences. Regulatory frameworks vary across geographies, impacting market access and product approvals. The presence of substitute treatments, such as fillers and surgical procedures, also influences market dynamics.
Market Concentration Metrics (2025 Estimates):
- Top 3 Players Market Share: xx%
- Top 5 Players Market Share: xx%
- Number of M&A deals (2019-2024): xx
Key Dynamics:
- High R&D expenditure driving innovation.
- Stringent regulatory approvals creating entry barriers.
- Increasing consumer awareness and demand.
- Strategic partnerships and acquisitions shaping the competitive landscape.
Botox Industry Industry Trends & Analysis
The Botox industry is experiencing robust growth, driven by several factors. The rising prevalence of age-related wrinkles and increasing aesthetic consciousness among consumers are key drivers. Technological advancements, such as the development of improved formulations and minimally invasive delivery methods, are enhancing market appeal. Consumer preferences are shifting towards non-surgical cosmetic procedures, fueling demand for Botox treatments. Furthermore, the competitive landscape is dynamic, with companies engaging in strategic marketing initiatives, product diversification, and geographical expansion to gain market share. The market penetration of Botox treatments is also increasing across various demographic groups, contributing to overall market growth.
Leading Markets & Segments in Botox Industry
The North American region currently dominates the global Botox market, driven by high disposable incomes, strong awareness of aesthetic procedures, and favorable regulatory environments. Within the application segments, cosmetic applications (including wrinkle reduction and other cosmetic uses) command a substantial majority of the market share, with non-cosmetic applications (such as treatment of migraines and hyperhidrosis) exhibiting slower but steady growth. Clinics and hospitals constitute the largest end-user segment due to their expertise and infrastructure for administering Botox injections.
Key Drivers by Segment:
- Cosmetic Applications: High consumer demand, increasing aesthetic awareness.
- Non-Cosmetic Applications: Expanding medical applications, growing physician adoption.
- Clinics & Hospitals: Established infrastructure, qualified medical professionals.
- Spas & Beauty Centers: Convenience, accessibility, increasing service offerings.
Regional Dominance:
- North America accounts for xx% of the global market.
- Europe holds xx% of the global market.
- Asia-Pacific is projected to witness significant growth.
Botox Industry Product Developments
Recent product innovations include formulations with enhanced efficacy and prolonged duration of effects, alongside the development of new delivery systems for improved precision and reduced side effects. Companies are focusing on broadening the applications of Botox, expanding beyond cosmetic treatments to encompass therapeutic areas such as chronic migraines and excessive sweating. This diversification expands the potential market and strengthens competitive advantage. Technological advancements also include the development of personalized treatments and improved safety profiles.
Key Drivers of Botox Industry Growth
Several factors are fueling the growth of the Botox industry. These include:
- Technological advancements: Improved formulations, minimally invasive delivery systems.
- Economic factors: Rising disposable incomes, increased spending on aesthetic procedures.
- Regulatory approvals: Expanding indications for use, increased market access.
- Consumer preferences: Growing awareness of non-surgical cosmetic enhancements.
Challenges in the Botox Industry Market
The Botox industry faces several challenges:
- Regulatory hurdles: Varying approval processes across different geographies, lengthy approval times.
- Supply chain disruptions: Dependence on raw materials and manufacturing capacity.
- Competitive pressures: Intense rivalry amongst established players and new entrants.
- Price sensitivity: Price competition and cost-consciousness impacting profitability.
Emerging Opportunities in Botox Industry
The Botox industry presents numerous opportunities:
- Expansion into new therapeutic areas: Exploring therapeutic indications beyond aesthetics.
- Strategic partnerships and acquisitions: Consolidating market share, driving innovation.
- Market expansion in emerging economies: Targeting growing consumer segments in developing countries.
- Development of novel delivery systems: Enhancing efficacy and patient convenience.
Leading Players in the Botox Industry Sector
- AbbVie Inc (Allergan)
- Galderma
- Medytox
- Revance Therapeutics Inc (Revance Aesthetics)
- Evolus Inc
- Hughes
- Merz Pharma GmbH & Co KGaA
- Daewoong Pharmaceuticals
- Eisai
- Ipsen Biopharmaceuticals Inc
- HUGEL
- USWM LLC
Key Milestones in Botox Industry Industry
- October 2023: Huadong Medicine Aesthetics Investment (HongKong) Limited (Sinclair) formed a global license agreement with ATGC Co. Ltd to manufacture and commercialize ATGC-110 (botulinum toxin) globally. This expands the market reach and potential for ATGC-110.
- March 2024: Hugel America Inc. announced that the United States Food and Drugs Administration (US FDA) had approved Letybo (Neurotoxin) for the management of moderate-to-severe glabellar (frown) lines in adults. This approval significantly boosts Hugel's market presence in the US.
Strategic Outlook for Botox Industry Market
The future of the Botox industry looks promising, driven by continued innovation, expanding applications, and growing consumer demand. Strategic partnerships, targeted marketing campaigns, and geographic expansion will be crucial for sustained growth. The development of next-generation Botox products with enhanced efficacy and safety profiles presents significant opportunities for market leadership. Companies are also focusing on personalized treatments tailored to individual needs, further boosting market potential.
Botox Industry Segmentation
-
1. Application
-
1.1. Cosmetic Applications
- 1.1.1. Glabellar Lines
- 1.1.2. Lateral Canthal Lines (Crow's Feet)
- 1.1.3. Forehead Lines
- 1.1.4. Other Cosmetic Applications
-
1.2. Non-cosmetic Applications
- 1.2.1. Dystonia
- 1.2.2. Chronic Migraine
- 1.2.3. Ophthalmologic Disorders
- 1.2.4. Other Non-cosmetic Applications
-
1.1. Cosmetic Applications
-
2. End User
- 2.1. Spas and Beauty Centers
- 2.2. Clinics and Hospitals
Botox Industry Segmentation By Geography
-
1. North America
- 1.1. United States
- 1.2. Canada
- 1.3. Mexico
-
2. Europe
- 2.1. Germany
- 2.2. United Kingdom
- 2.3. France
- 2.4. Italy
- 2.5. Spain
- 2.6. Rest of Europe
-
3. Asia Pacific
- 3.1. China
- 3.2. Japan
- 3.3. India
- 3.4. Australia
- 3.5. South Korea
- 3.6. Rest of Asia Pacific
-
4. Middle East and Africa
- 4.1. GCC
- 4.2. South Africa
- 4.3. Rest of Middle East and Africa
-
5. South America
- 5.1. Brazil
- 5.2. Argentina
- 5.3. Rest of South America
Botox Industry REPORT HIGHLIGHTS
| Aspects | Details |
|---|---|
| Study Period | 2019-2033 |
| Base Year | 2024 |
| Estimated Year | 2025 |
| Forecast Period | 2025-2033 |
| Historical Period | 2019-2024 |
| Growth Rate | CAGR of 9.20% from 2019-2033 |
| Segmentation |
|
Table of Contents
- 1. Introduction
- 1.1. Research Scope
- 1.2. Market Segmentation
- 1.3. Research Methodology
- 1.4. Definitions and Assumptions
- 2. Executive Summary
- 2.1. Introduction
- 3. Market Dynamics
- 3.1. Introduction
- 3.2. Market Drivers
- 3.2.1. Increasing Demand for Aesthetic Procedures; Growing Research and Development Initiatives to Expand the Therapeutic Applications of Botulinum Toxin
- 3.3. Market Restrains
- 3.3.1. Adverse Effects Associated with Botulinum Toxin; Lack of Reimbursement Policies Supporting Cosmetic Procedures
- 3.4. Market Trends
- 3.4.1. Glabellar Lines Segment is Expected to Hold Significant Share in the Market Over the Forecast Period
- 4. Market Factor Analysis
- 4.1. Porters Five Forces
- 4.2. Supply/Value Chain
- 4.3. PESTEL analysis
- 4.4. Market Entropy
- 4.5. Patent/Trademark Analysis
- 5. Global Botox Industry Analysis, Insights and Forecast, 2019-2031
- 5.1. Market Analysis, Insights and Forecast - by Application
- 5.1.1. Cosmetic Applications
- 5.1.1.1. Glabellar Lines
- 5.1.1.2. Lateral Canthal Lines (Crow's Feet)
- 5.1.1.3. Forehead Lines
- 5.1.1.4. Other Cosmetic Applications
- 5.1.2. Non-cosmetic Applications
- 5.1.2.1. Dystonia
- 5.1.2.2. Chronic Migraine
- 5.1.2.3. Ophthalmologic Disorders
- 5.1.2.4. Other Non-cosmetic Applications
- 5.1.1. Cosmetic Applications
- 5.2. Market Analysis, Insights and Forecast - by End User
- 5.2.1. Spas and Beauty Centers
- 5.2.2. Clinics and Hospitals
- 5.3. Market Analysis, Insights and Forecast - by Region
- 5.3.1. North America
- 5.3.2. Europe
- 5.3.3. Asia Pacific
- 5.3.4. Middle East and Africa
- 5.3.5. South America
- 5.1. Market Analysis, Insights and Forecast - by Application
- 6. North America Botox Industry Analysis, Insights and Forecast, 2019-2031
- 6.1. Market Analysis, Insights and Forecast - by Application
- 6.1.1. Cosmetic Applications
- 6.1.1.1. Glabellar Lines
- 6.1.1.2. Lateral Canthal Lines (Crow's Feet)
- 6.1.1.3. Forehead Lines
- 6.1.1.4. Other Cosmetic Applications
- 6.1.2. Non-cosmetic Applications
- 6.1.2.1. Dystonia
- 6.1.2.2. Chronic Migraine
- 6.1.2.3. Ophthalmologic Disorders
- 6.1.2.4. Other Non-cosmetic Applications
- 6.1.1. Cosmetic Applications
- 6.2. Market Analysis, Insights and Forecast - by End User
- 6.2.1. Spas and Beauty Centers
- 6.2.2. Clinics and Hospitals
- 6.1. Market Analysis, Insights and Forecast - by Application
- 7. Europe Botox Industry Analysis, Insights and Forecast, 2019-2031
- 7.1. Market Analysis, Insights and Forecast - by Application
- 7.1.1. Cosmetic Applications
- 7.1.1.1. Glabellar Lines
- 7.1.1.2. Lateral Canthal Lines (Crow's Feet)
- 7.1.1.3. Forehead Lines
- 7.1.1.4. Other Cosmetic Applications
- 7.1.2. Non-cosmetic Applications
- 7.1.2.1. Dystonia
- 7.1.2.2. Chronic Migraine
- 7.1.2.3. Ophthalmologic Disorders
- 7.1.2.4. Other Non-cosmetic Applications
- 7.1.1. Cosmetic Applications
- 7.2. Market Analysis, Insights and Forecast - by End User
- 7.2.1. Spas and Beauty Centers
- 7.2.2. Clinics and Hospitals
- 7.1. Market Analysis, Insights and Forecast - by Application
- 8. Asia Pacific Botox Industry Analysis, Insights and Forecast, 2019-2031
- 8.1. Market Analysis, Insights and Forecast - by Application
- 8.1.1. Cosmetic Applications
- 8.1.1.1. Glabellar Lines
- 8.1.1.2. Lateral Canthal Lines (Crow's Feet)
- 8.1.1.3. Forehead Lines
- 8.1.1.4. Other Cosmetic Applications
- 8.1.2. Non-cosmetic Applications
- 8.1.2.1. Dystonia
- 8.1.2.2. Chronic Migraine
- 8.1.2.3. Ophthalmologic Disorders
- 8.1.2.4. Other Non-cosmetic Applications
- 8.1.1. Cosmetic Applications
- 8.2. Market Analysis, Insights and Forecast - by End User
- 8.2.1. Spas and Beauty Centers
- 8.2.2. Clinics and Hospitals
- 8.1. Market Analysis, Insights and Forecast - by Application
- 9. Middle East and Africa Botox Industry Analysis, Insights and Forecast, 2019-2031
- 9.1. Market Analysis, Insights and Forecast - by Application
- 9.1.1. Cosmetic Applications
- 9.1.1.1. Glabellar Lines
- 9.1.1.2. Lateral Canthal Lines (Crow's Feet)
- 9.1.1.3. Forehead Lines
- 9.1.1.4. Other Cosmetic Applications
- 9.1.2. Non-cosmetic Applications
- 9.1.2.1. Dystonia
- 9.1.2.2. Chronic Migraine
- 9.1.2.3. Ophthalmologic Disorders
- 9.1.2.4. Other Non-cosmetic Applications
- 9.1.1. Cosmetic Applications
- 9.2. Market Analysis, Insights and Forecast - by End User
- 9.2.1. Spas and Beauty Centers
- 9.2.2. Clinics and Hospitals
- 9.1. Market Analysis, Insights and Forecast - by Application
- 10. South America Botox Industry Analysis, Insights and Forecast, 2019-2031
- 10.1. Market Analysis, Insights and Forecast - by Application
- 10.1.1. Cosmetic Applications
- 10.1.1.1. Glabellar Lines
- 10.1.1.2. Lateral Canthal Lines (Crow's Feet)
- 10.1.1.3. Forehead Lines
- 10.1.1.4. Other Cosmetic Applications
- 10.1.2. Non-cosmetic Applications
- 10.1.2.1. Dystonia
- 10.1.2.2. Chronic Migraine
- 10.1.2.3. Ophthalmologic Disorders
- 10.1.2.4. Other Non-cosmetic Applications
- 10.1.1. Cosmetic Applications
- 10.2. Market Analysis, Insights and Forecast - by End User
- 10.2.1. Spas and Beauty Centers
- 10.2.2. Clinics and Hospitals
- 10.1. Market Analysis, Insights and Forecast - by Application
- 11. North America Botox Industry Analysis, Insights and Forecast, 2019-2031
- 11.1. Market Analysis, Insights and Forecast - By Country/Sub-region
- 11.1.1 United States
- 11.1.2 Canada
- 11.1.3 Mexico
- 12. Europe Botox Industry Analysis, Insights and Forecast, 2019-2031
- 12.1. Market Analysis, Insights and Forecast - By Country/Sub-region
- 12.1.1 Germany
- 12.1.2 United Kingdom
- 12.1.3 France
- 12.1.4 Italy
- 12.1.5 Spain
- 12.1.6 Rest of Europe
- 13. Asia Pacific Botox Industry Analysis, Insights and Forecast, 2019-2031
- 13.1. Market Analysis, Insights and Forecast - By Country/Sub-region
- 13.1.1 China
- 13.1.2 Japan
- 13.1.3 India
- 13.1.4 Australia
- 13.1.5 South Korea
- 13.1.6 Rest of Asia Pacific
- 14. Middle East and Africa Botox Industry Analysis, Insights and Forecast, 2019-2031
- 14.1. Market Analysis, Insights and Forecast - By Country/Sub-region
- 14.1.1 GCC
- 14.1.2 South Africa
- 14.1.3 Rest of Middle East and Africa
- 15. South America Botox Industry Analysis, Insights and Forecast, 2019-2031
- 15.1. Market Analysis, Insights and Forecast - By Country/Sub-region
- 15.1.1 Brazil
- 15.1.2 Argentina
- 15.1.3 Rest of South America
- 16. Competitive Analysis
- 16.1. Global Market Share Analysis 2024
- 16.2. Company Profiles
- 16.2.1 AbbVie Inc (Allergan)
- 16.2.1.1. Overview
- 16.2.1.2. Products
- 16.2.1.3. SWOT Analysis
- 16.2.1.4. Recent Developments
- 16.2.1.5. Financials (Based on Availability)
- 16.2.2 Galderma
- 16.2.2.1. Overview
- 16.2.2.2. Products
- 16.2.2.3. SWOT Analysis
- 16.2.2.4. Recent Developments
- 16.2.2.5. Financials (Based on Availability)
- 16.2.3 Medytox
- 16.2.3.1. Overview
- 16.2.3.2. Products
- 16.2.3.3. SWOT Analysis
- 16.2.3.4. Recent Developments
- 16.2.3.5. Financials (Based on Availability)
- 16.2.4 Revance Therapeutics Inc (Revance Aesthetics)
- 16.2.4.1. Overview
- 16.2.4.2. Products
- 16.2.4.3. SWOT Analysis
- 16.2.4.4. Recent Developments
- 16.2.4.5. Financials (Based on Availability)
- 16.2.5 Evolus Inc
- 16.2.5.1. Overview
- 16.2.5.2. Products
- 16.2.5.3. SWOT Analysis
- 16.2.5.4. Recent Developments
- 16.2.5.5. Financials (Based on Availability)
- 16.2.6 Hughs
- 16.2.6.1. Overview
- 16.2.6.2. Products
- 16.2.6.3. SWOT Analysis
- 16.2.6.4. Recent Developments
- 16.2.6.5. Financials (Based on Availability)
- 16.2.7 Merz Pharma GmbH & Co KGaA
- 16.2.7.1. Overview
- 16.2.7.2. Products
- 16.2.7.3. SWOT Analysis
- 16.2.7.4. Recent Developments
- 16.2.7.5. Financials (Based on Availability)
- 16.2.8 Daewoong Pharmaceuticals
- 16.2.8.1. Overview
- 16.2.8.2. Products
- 16.2.8.3. SWOT Analysis
- 16.2.8.4. Recent Developments
- 16.2.8.5. Financials (Based on Availability)
- 16.2.9 Eisai
- 16.2.9.1. Overview
- 16.2.9.2. Products
- 16.2.9.3. SWOT Analysis
- 16.2.9.4. Recent Developments
- 16.2.9.5. Financials (Based on Availability)
- 16.2.10 Ipsen Biopharmaceuticals Inc
- 16.2.10.1. Overview
- 16.2.10.2. Products
- 16.2.10.3. SWOT Analysis
- 16.2.10.4. Recent Developments
- 16.2.10.5. Financials (Based on Availability)
- 16.2.11 HUGEL
- 16.2.11.1. Overview
- 16.2.11.2. Products
- 16.2.11.3. SWOT Analysis
- 16.2.11.4. Recent Developments
- 16.2.11.5. Financials (Based on Availability)
- 16.2.12 USWM LLC
- 16.2.12.1. Overview
- 16.2.12.2. Products
- 16.2.12.3. SWOT Analysis
- 16.2.12.4. Recent Developments
- 16.2.12.5. Financials (Based on Availability)
- 16.2.1 AbbVie Inc (Allergan)
List of Figures
- Figure 1: Global Botox Industry Revenue Breakdown (Million, %) by Region 2024 & 2032
- Figure 2: Global Botox Industry Volume Breakdown (K Unit, %) by Region 2024 & 2032
- Figure 3: North America Botox Industry Revenue (Million), by Country 2024 & 2032
- Figure 4: North America Botox Industry Volume (K Unit), by Country 2024 & 2032
- Figure 5: North America Botox Industry Revenue Share (%), by Country 2024 & 2032
- Figure 6: North America Botox Industry Volume Share (%), by Country 2024 & 2032
- Figure 7: Europe Botox Industry Revenue (Million), by Country 2024 & 2032
- Figure 8: Europe Botox Industry Volume (K Unit), by Country 2024 & 2032
- Figure 9: Europe Botox Industry Revenue Share (%), by Country 2024 & 2032
- Figure 10: Europe Botox Industry Volume Share (%), by Country 2024 & 2032
- Figure 11: Asia Pacific Botox Industry Revenue (Million), by Country 2024 & 2032
- Figure 12: Asia Pacific Botox Industry Volume (K Unit), by Country 2024 & 2032
- Figure 13: Asia Pacific Botox Industry Revenue Share (%), by Country 2024 & 2032
- Figure 14: Asia Pacific Botox Industry Volume Share (%), by Country 2024 & 2032
- Figure 15: Middle East and Africa Botox Industry Revenue (Million), by Country 2024 & 2032
- Figure 16: Middle East and Africa Botox Industry Volume (K Unit), by Country 2024 & 2032
- Figure 17: Middle East and Africa Botox Industry Revenue Share (%), by Country 2024 & 2032
- Figure 18: Middle East and Africa Botox Industry Volume Share (%), by Country 2024 & 2032
- Figure 19: South America Botox Industry Revenue (Million), by Country 2024 & 2032
- Figure 20: South America Botox Industry Volume (K Unit), by Country 2024 & 2032
- Figure 21: South America Botox Industry Revenue Share (%), by Country 2024 & 2032
- Figure 22: South America Botox Industry Volume Share (%), by Country 2024 & 2032
- Figure 23: North America Botox Industry Revenue (Million), by Application 2024 & 2032
- Figure 24: North America Botox Industry Volume (K Unit), by Application 2024 & 2032
- Figure 25: North America Botox Industry Revenue Share (%), by Application 2024 & 2032
- Figure 26: North America Botox Industry Volume Share (%), by Application 2024 & 2032
- Figure 27: North America Botox Industry Revenue (Million), by End User 2024 & 2032
- Figure 28: North America Botox Industry Volume (K Unit), by End User 2024 & 2032
- Figure 29: North America Botox Industry Revenue Share (%), by End User 2024 & 2032
- Figure 30: North America Botox Industry Volume Share (%), by End User 2024 & 2032
- Figure 31: North America Botox Industry Revenue (Million), by Country 2024 & 2032
- Figure 32: North America Botox Industry Volume (K Unit), by Country 2024 & 2032
- Figure 33: North America Botox Industry Revenue Share (%), by Country 2024 & 2032
- Figure 34: North America Botox Industry Volume Share (%), by Country 2024 & 2032
- Figure 35: Europe Botox Industry Revenue (Million), by Application 2024 & 2032
- Figure 36: Europe Botox Industry Volume (K Unit), by Application 2024 & 2032
- Figure 37: Europe Botox Industry Revenue Share (%), by Application 2024 & 2032
- Figure 38: Europe Botox Industry Volume Share (%), by Application 2024 & 2032
- Figure 39: Europe Botox Industry Revenue (Million), by End User 2024 & 2032
- Figure 40: Europe Botox Industry Volume (K Unit), by End User 2024 & 2032
- Figure 41: Europe Botox Industry Revenue Share (%), by End User 2024 & 2032
- Figure 42: Europe Botox Industry Volume Share (%), by End User 2024 & 2032
- Figure 43: Europe Botox Industry Revenue (Million), by Country 2024 & 2032
- Figure 44: Europe Botox Industry Volume (K Unit), by Country 2024 & 2032
- Figure 45: Europe Botox Industry Revenue Share (%), by Country 2024 & 2032
- Figure 46: Europe Botox Industry Volume Share (%), by Country 2024 & 2032
- Figure 47: Asia Pacific Botox Industry Revenue (Million), by Application 2024 & 2032
- Figure 48: Asia Pacific Botox Industry Volume (K Unit), by Application 2024 & 2032
- Figure 49: Asia Pacific Botox Industry Revenue Share (%), by Application 2024 & 2032
- Figure 50: Asia Pacific Botox Industry Volume Share (%), by Application 2024 & 2032
- Figure 51: Asia Pacific Botox Industry Revenue (Million), by End User 2024 & 2032
- Figure 52: Asia Pacific Botox Industry Volume (K Unit), by End User 2024 & 2032
- Figure 53: Asia Pacific Botox Industry Revenue Share (%), by End User 2024 & 2032
- Figure 54: Asia Pacific Botox Industry Volume Share (%), by End User 2024 & 2032
- Figure 55: Asia Pacific Botox Industry Revenue (Million), by Country 2024 & 2032
- Figure 56: Asia Pacific Botox Industry Volume (K Unit), by Country 2024 & 2032
- Figure 57: Asia Pacific Botox Industry Revenue Share (%), by Country 2024 & 2032
- Figure 58: Asia Pacific Botox Industry Volume Share (%), by Country 2024 & 2032
- Figure 59: Middle East and Africa Botox Industry Revenue (Million), by Application 2024 & 2032
- Figure 60: Middle East and Africa Botox Industry Volume (K Unit), by Application 2024 & 2032
- Figure 61: Middle East and Africa Botox Industry Revenue Share (%), by Application 2024 & 2032
- Figure 62: Middle East and Africa Botox Industry Volume Share (%), by Application 2024 & 2032
- Figure 63: Middle East and Africa Botox Industry Revenue (Million), by End User 2024 & 2032
- Figure 64: Middle East and Africa Botox Industry Volume (K Unit), by End User 2024 & 2032
- Figure 65: Middle East and Africa Botox Industry Revenue Share (%), by End User 2024 & 2032
- Figure 66: Middle East and Africa Botox Industry Volume Share (%), by End User 2024 & 2032
- Figure 67: Middle East and Africa Botox Industry Revenue (Million), by Country 2024 & 2032
- Figure 68: Middle East and Africa Botox Industry Volume (K Unit), by Country 2024 & 2032
- Figure 69: Middle East and Africa Botox Industry Revenue Share (%), by Country 2024 & 2032
- Figure 70: Middle East and Africa Botox Industry Volume Share (%), by Country 2024 & 2032
- Figure 71: South America Botox Industry Revenue (Million), by Application 2024 & 2032
- Figure 72: South America Botox Industry Volume (K Unit), by Application 2024 & 2032
- Figure 73: South America Botox Industry Revenue Share (%), by Application 2024 & 2032
- Figure 74: South America Botox Industry Volume Share (%), by Application 2024 & 2032
- Figure 75: South America Botox Industry Revenue (Million), by End User 2024 & 2032
- Figure 76: South America Botox Industry Volume (K Unit), by End User 2024 & 2032
- Figure 77: South America Botox Industry Revenue Share (%), by End User 2024 & 2032
- Figure 78: South America Botox Industry Volume Share (%), by End User 2024 & 2032
- Figure 79: South America Botox Industry Revenue (Million), by Country 2024 & 2032
- Figure 80: South America Botox Industry Volume (K Unit), by Country 2024 & 2032
- Figure 81: South America Botox Industry Revenue Share (%), by Country 2024 & 2032
- Figure 82: South America Botox Industry Volume Share (%), by Country 2024 & 2032
List of Tables
- Table 1: Global Botox Industry Revenue Million Forecast, by Region 2019 & 2032
- Table 2: Global Botox Industry Volume K Unit Forecast, by Region 2019 & 2032
- Table 3: Global Botox Industry Revenue Million Forecast, by Application 2019 & 2032
- Table 4: Global Botox Industry Volume K Unit Forecast, by Application 2019 & 2032
- Table 5: Global Botox Industry Revenue Million Forecast, by End User 2019 & 2032
- Table 6: Global Botox Industry Volume K Unit Forecast, by End User 2019 & 2032
- Table 7: Global Botox Industry Revenue Million Forecast, by Region 2019 & 2032
- Table 8: Global Botox Industry Volume K Unit Forecast, by Region 2019 & 2032
- Table 9: Global Botox Industry Revenue Million Forecast, by Country 2019 & 2032
- Table 10: Global Botox Industry Volume K Unit Forecast, by Country 2019 & 2032
- Table 11: United States Botox Industry Revenue (Million) Forecast, by Application 2019 & 2032
- Table 12: United States Botox Industry Volume (K Unit) Forecast, by Application 2019 & 2032
- Table 13: Canada Botox Industry Revenue (Million) Forecast, by Application 2019 & 2032
- Table 14: Canada Botox Industry Volume (K Unit) Forecast, by Application 2019 & 2032
- Table 15: Mexico Botox Industry Revenue (Million) Forecast, by Application 2019 & 2032
- Table 16: Mexico Botox Industry Volume (K Unit) Forecast, by Application 2019 & 2032
- Table 17: Global Botox Industry Revenue Million Forecast, by Country 2019 & 2032
- Table 18: Global Botox Industry Volume K Unit Forecast, by Country 2019 & 2032
- Table 19: Germany Botox Industry Revenue (Million) Forecast, by Application 2019 & 2032
- Table 20: Germany Botox Industry Volume (K Unit) Forecast, by Application 2019 & 2032
- Table 21: United Kingdom Botox Industry Revenue (Million) Forecast, by Application 2019 & 2032
- Table 22: United Kingdom Botox Industry Volume (K Unit) Forecast, by Application 2019 & 2032
- Table 23: France Botox Industry Revenue (Million) Forecast, by Application 2019 & 2032
- Table 24: France Botox Industry Volume (K Unit) Forecast, by Application 2019 & 2032
- Table 25: Italy Botox Industry Revenue (Million) Forecast, by Application 2019 & 2032
- Table 26: Italy Botox Industry Volume (K Unit) Forecast, by Application 2019 & 2032
- Table 27: Spain Botox Industry Revenue (Million) Forecast, by Application 2019 & 2032
- Table 28: Spain Botox Industry Volume (K Unit) Forecast, by Application 2019 & 2032
- Table 29: Rest of Europe Botox Industry Revenue (Million) Forecast, by Application 2019 & 2032
- Table 30: Rest of Europe Botox Industry Volume (K Unit) Forecast, by Application 2019 & 2032
- Table 31: Global Botox Industry Revenue Million Forecast, by Country 2019 & 2032
- Table 32: Global Botox Industry Volume K Unit Forecast, by Country 2019 & 2032
- Table 33: China Botox Industry Revenue (Million) Forecast, by Application 2019 & 2032
- Table 34: China Botox Industry Volume (K Unit) Forecast, by Application 2019 & 2032
- Table 35: Japan Botox Industry Revenue (Million) Forecast, by Application 2019 & 2032
- Table 36: Japan Botox Industry Volume (K Unit) Forecast, by Application 2019 & 2032
- Table 37: India Botox Industry Revenue (Million) Forecast, by Application 2019 & 2032
- Table 38: India Botox Industry Volume (K Unit) Forecast, by Application 2019 & 2032
- Table 39: Australia Botox Industry Revenue (Million) Forecast, by Application 2019 & 2032
- Table 40: Australia Botox Industry Volume (K Unit) Forecast, by Application 2019 & 2032
- Table 41: South Korea Botox Industry Revenue (Million) Forecast, by Application 2019 & 2032
- Table 42: South Korea Botox Industry Volume (K Unit) Forecast, by Application 2019 & 2032
- Table 43: Rest of Asia Pacific Botox Industry Revenue (Million) Forecast, by Application 2019 & 2032
- Table 44: Rest of Asia Pacific Botox Industry Volume (K Unit) Forecast, by Application 2019 & 2032
- Table 45: Global Botox Industry Revenue Million Forecast, by Country 2019 & 2032
- Table 46: Global Botox Industry Volume K Unit Forecast, by Country 2019 & 2032
- Table 47: GCC Botox Industry Revenue (Million) Forecast, by Application 2019 & 2032
- Table 48: GCC Botox Industry Volume (K Unit) Forecast, by Application 2019 & 2032
- Table 49: South Africa Botox Industry Revenue (Million) Forecast, by Application 2019 & 2032
- Table 50: South Africa Botox Industry Volume (K Unit) Forecast, by Application 2019 & 2032
- Table 51: Rest of Middle East and Africa Botox Industry Revenue (Million) Forecast, by Application 2019 & 2032
- Table 52: Rest of Middle East and Africa Botox Industry Volume (K Unit) Forecast, by Application 2019 & 2032
- Table 53: Global Botox Industry Revenue Million Forecast, by Country 2019 & 2032
- Table 54: Global Botox Industry Volume K Unit Forecast, by Country 2019 & 2032
- Table 55: Brazil Botox Industry Revenue (Million) Forecast, by Application 2019 & 2032
- Table 56: Brazil Botox Industry Volume (K Unit) Forecast, by Application 2019 & 2032
- Table 57: Argentina Botox Industry Revenue (Million) Forecast, by Application 2019 & 2032
- Table 58: Argentina Botox Industry Volume (K Unit) Forecast, by Application 2019 & 2032
- Table 59: Rest of South America Botox Industry Revenue (Million) Forecast, by Application 2019 & 2032
- Table 60: Rest of South America Botox Industry Volume (K Unit) Forecast, by Application 2019 & 2032
- Table 61: Global Botox Industry Revenue Million Forecast, by Application 2019 & 2032
- Table 62: Global Botox Industry Volume K Unit Forecast, by Application 2019 & 2032
- Table 63: Global Botox Industry Revenue Million Forecast, by End User 2019 & 2032
- Table 64: Global Botox Industry Volume K Unit Forecast, by End User 2019 & 2032
- Table 65: Global Botox Industry Revenue Million Forecast, by Country 2019 & 2032
- Table 66: Global Botox Industry Volume K Unit Forecast, by Country 2019 & 2032
- Table 67: United States Botox Industry Revenue (Million) Forecast, by Application 2019 & 2032
- Table 68: United States Botox Industry Volume (K Unit) Forecast, by Application 2019 & 2032
- Table 69: Canada Botox Industry Revenue (Million) Forecast, by Application 2019 & 2032
- Table 70: Canada Botox Industry Volume (K Unit) Forecast, by Application 2019 & 2032
- Table 71: Mexico Botox Industry Revenue (Million) Forecast, by Application 2019 & 2032
- Table 72: Mexico Botox Industry Volume (K Unit) Forecast, by Application 2019 & 2032
- Table 73: Global Botox Industry Revenue Million Forecast, by Application 2019 & 2032
- Table 74: Global Botox Industry Volume K Unit Forecast, by Application 2019 & 2032
- Table 75: Global Botox Industry Revenue Million Forecast, by End User 2019 & 2032
- Table 76: Global Botox Industry Volume K Unit Forecast, by End User 2019 & 2032
- Table 77: Global Botox Industry Revenue Million Forecast, by Country 2019 & 2032
- Table 78: Global Botox Industry Volume K Unit Forecast, by Country 2019 & 2032
- Table 79: Germany Botox Industry Revenue (Million) Forecast, by Application 2019 & 2032
- Table 80: Germany Botox Industry Volume (K Unit) Forecast, by Application 2019 & 2032
- Table 81: United Kingdom Botox Industry Revenue (Million) Forecast, by Application 2019 & 2032
- Table 82: United Kingdom Botox Industry Volume (K Unit) Forecast, by Application 2019 & 2032
- Table 83: France Botox Industry Revenue (Million) Forecast, by Application 2019 & 2032
- Table 84: France Botox Industry Volume (K Unit) Forecast, by Application 2019 & 2032
- Table 85: Italy Botox Industry Revenue (Million) Forecast, by Application 2019 & 2032
- Table 86: Italy Botox Industry Volume (K Unit) Forecast, by Application 2019 & 2032
- Table 87: Spain Botox Industry Revenue (Million) Forecast, by Application 2019 & 2032
- Table 88: Spain Botox Industry Volume (K Unit) Forecast, by Application 2019 & 2032
- Table 89: Rest of Europe Botox Industry Revenue (Million) Forecast, by Application 2019 & 2032
- Table 90: Rest of Europe Botox Industry Volume (K Unit) Forecast, by Application 2019 & 2032
- Table 91: Global Botox Industry Revenue Million Forecast, by Application 2019 & 2032
- Table 92: Global Botox Industry Volume K Unit Forecast, by Application 2019 & 2032
- Table 93: Global Botox Industry Revenue Million Forecast, by End User 2019 & 2032
- Table 94: Global Botox Industry Volume K Unit Forecast, by End User 2019 & 2032
- Table 95: Global Botox Industry Revenue Million Forecast, by Country 2019 & 2032
- Table 96: Global Botox Industry Volume K Unit Forecast, by Country 2019 & 2032
- Table 97: China Botox Industry Revenue (Million) Forecast, by Application 2019 & 2032
- Table 98: China Botox Industry Volume (K Unit) Forecast, by Application 2019 & 2032
- Table 99: Japan Botox Industry Revenue (Million) Forecast, by Application 2019 & 2032
- Table 100: Japan Botox Industry Volume (K Unit) Forecast, by Application 2019 & 2032
- Table 101: India Botox Industry Revenue (Million) Forecast, by Application 2019 & 2032
- Table 102: India Botox Industry Volume (K Unit) Forecast, by Application 2019 & 2032
- Table 103: Australia Botox Industry Revenue (Million) Forecast, by Application 2019 & 2032
- Table 104: Australia Botox Industry Volume (K Unit) Forecast, by Application 2019 & 2032
- Table 105: South Korea Botox Industry Revenue (Million) Forecast, by Application 2019 & 2032
- Table 106: South Korea Botox Industry Volume (K Unit) Forecast, by Application 2019 & 2032
- Table 107: Rest of Asia Pacific Botox Industry Revenue (Million) Forecast, by Application 2019 & 2032
- Table 108: Rest of Asia Pacific Botox Industry Volume (K Unit) Forecast, by Application 2019 & 2032
- Table 109: Global Botox Industry Revenue Million Forecast, by Application 2019 & 2032
- Table 110: Global Botox Industry Volume K Unit Forecast, by Application 2019 & 2032
- Table 111: Global Botox Industry Revenue Million Forecast, by End User 2019 & 2032
- Table 112: Global Botox Industry Volume K Unit Forecast, by End User 2019 & 2032
- Table 113: Global Botox Industry Revenue Million Forecast, by Country 2019 & 2032
- Table 114: Global Botox Industry Volume K Unit Forecast, by Country 2019 & 2032
- Table 115: GCC Botox Industry Revenue (Million) Forecast, by Application 2019 & 2032
- Table 116: GCC Botox Industry Volume (K Unit) Forecast, by Application 2019 & 2032
- Table 117: South Africa Botox Industry Revenue (Million) Forecast, by Application 2019 & 2032
- Table 118: South Africa Botox Industry Volume (K Unit) Forecast, by Application 2019 & 2032
- Table 119: Rest of Middle East and Africa Botox Industry Revenue (Million) Forecast, by Application 2019 & 2032
- Table 120: Rest of Middle East and Africa Botox Industry Volume (K Unit) Forecast, by Application 2019 & 2032
- Table 121: Global Botox Industry Revenue Million Forecast, by Application 2019 & 2032
- Table 122: Global Botox Industry Volume K Unit Forecast, by Application 2019 & 2032
- Table 123: Global Botox Industry Revenue Million Forecast, by End User 2019 & 2032
- Table 124: Global Botox Industry Volume K Unit Forecast, by End User 2019 & 2032
- Table 125: Global Botox Industry Revenue Million Forecast, by Country 2019 & 2032
- Table 126: Global Botox Industry Volume K Unit Forecast, by Country 2019 & 2032
- Table 127: Brazil Botox Industry Revenue (Million) Forecast, by Application 2019 & 2032
- Table 128: Brazil Botox Industry Volume (K Unit) Forecast, by Application 2019 & 2032
- Table 129: Argentina Botox Industry Revenue (Million) Forecast, by Application 2019 & 2032
- Table 130: Argentina Botox Industry Volume (K Unit) Forecast, by Application 2019 & 2032
- Table 131: Rest of South America Botox Industry Revenue (Million) Forecast, by Application 2019 & 2032
- Table 132: Rest of South America Botox Industry Volume (K Unit) Forecast, by Application 2019 & 2032
Frequently Asked Questions
1. What is the projected Compound Annual Growth Rate (CAGR) of the Botox Industry?
The projected CAGR is approximately 9.20%.
2. Which companies are prominent players in the Botox Industry?
Key companies in the market include AbbVie Inc (Allergan), Galderma, Medytox, Revance Therapeutics Inc (Revance Aesthetics), Evolus Inc, Hughs, Merz Pharma GmbH & Co KGaA, Daewoong Pharmaceuticals, Eisai, Ipsen Biopharmaceuticals Inc, HUGEL, USWM LLC.
3. What are the main segments of the Botox Industry?
The market segments include Application, End User.
4. Can you provide details about the market size?
The market size is estimated to be USD 6.49 Million as of 2022.
5. What are some drivers contributing to market growth?
Increasing Demand for Aesthetic Procedures; Growing Research and Development Initiatives to Expand the Therapeutic Applications of Botulinum Toxin.
6. What are the notable trends driving market growth?
Glabellar Lines Segment is Expected to Hold Significant Share in the Market Over the Forecast Period.
7. Are there any restraints impacting market growth?
Adverse Effects Associated with Botulinum Toxin; Lack of Reimbursement Policies Supporting Cosmetic Procedures.
8. Can you provide examples of recent developments in the market?
March 2024: Hugel America Inc. announced that the United States Food and Drugs Administration (US FDA) had approved Letybo (Neurotoxin) for the management of moderate-to-severe glabellar (frown) lines in adults.
9. What pricing options are available for accessing the report?
Pricing options include single-user, multi-user, and enterprise licenses priced at USD 4750, USD 5250, and USD 8750 respectively.
10. Is the market size provided in terms of value or volume?
The market size is provided in terms of value, measured in Million and volume, measured in K Unit.
11. Are there any specific market keywords associated with the report?
Yes, the market keyword associated with the report is "Botox Industry," which aids in identifying and referencing the specific market segment covered.
12. How do I determine which pricing option suits my needs best?
The pricing options vary based on user requirements and access needs. Individual users may opt for single-user licenses, while businesses requiring broader access may choose multi-user or enterprise licenses for cost-effective access to the report.
13. Are there any additional resources or data provided in the Botox Industry report?
While the report offers comprehensive insights, it's advisable to review the specific contents or supplementary materials provided to ascertain if additional resources or data are available.
14. How can I stay updated on further developments or reports in the Botox Industry?
To stay informed about further developments, trends, and reports in the Botox Industry, consider subscribing to industry newsletters, following relevant companies and organizations, or regularly checking reputable industry news sources and publications.
Methodology
Step 1 - Identification of Relevant Samples Size from Population Database


Step 2 - Approaches for Defining Global Market Size (Value, Volume* & Price*)

Note*: In applicable scenarios
Step 3 - Data Sources
Primary Research
- Web Analytics
- Survey Reports
- Research Institute
- Latest Research Reports
- Opinion Leaders
Secondary Research
- Annual Reports
- White Paper
- Latest Press Release
- Industry Association
- Paid Database
- Investor Presentations

Step 4 - Data Triangulation
Involves using different sources of information in order to increase the validity of a study
These sources are likely to be stakeholders in a program - participants, other researchers, program staff, other community members, and so on.
Then we put all data in single framework & apply various statistical tools to find out the dynamic on the market.
During the analysis stage, feedback from the stakeholder groups would be compared to determine areas of agreement as well as areas of divergence
