

Key Insights
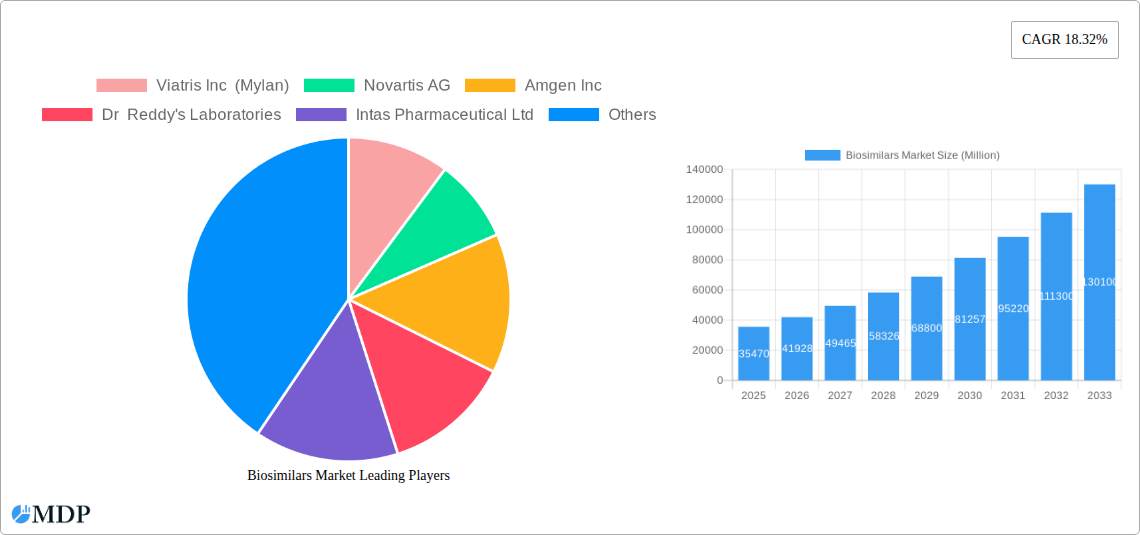
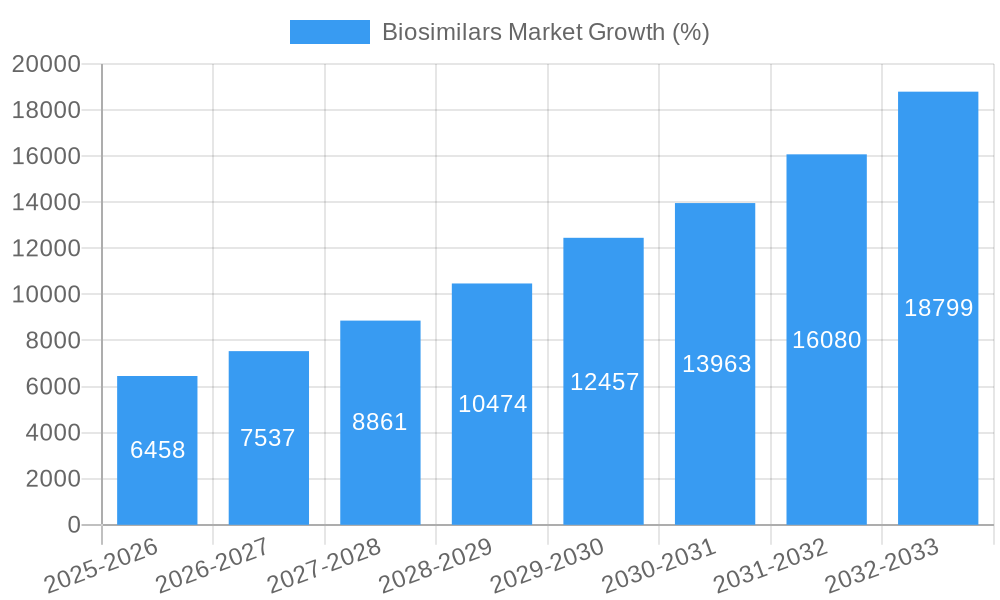
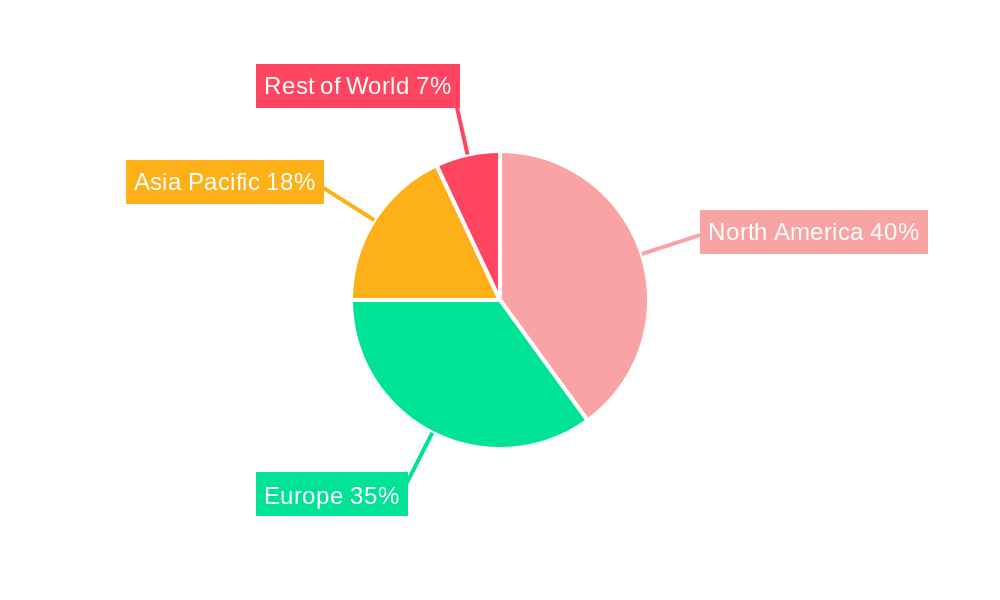
The biosimilars market, valued at $35.47 billion in 2025, is projected to experience robust growth, exhibiting a Compound Annual Growth Rate (CAGR) of 18.32% from 2025 to 2033. This expansion is fueled by several key drivers. Firstly, increasing healthcare costs globally are pushing governments and healthcare providers to seek cost-effective alternatives to expensive biologics. Biosimilars, offering similar efficacy and safety profiles at lower prices, provide a compelling solution. Secondly, the patent expirations of numerous blockbuster biologics are creating significant market opportunities for biosimilar manufacturers. This is particularly evident in therapeutic areas like oncology, autoimmune disorders, and blood disorders, where many high-priced biologics are nearing or have already reached patent expiry. Thirdly, the continuous advancement in biosimilar development technologies, leading to improved manufacturing processes and enhanced quality, is contributing to increased market acceptance and adoption. However, regulatory hurdles and concerns surrounding biosimilar interchangeability remain as significant restraints. The market segmentation reveals that monoclonal antibodies constitute a major share, followed by recombinant hormones and immunomodulators. Geographically, North America and Europe currently dominate the market due to established healthcare infrastructure and higher biosimilar adoption rates. However, the Asia-Pacific region is expected to witness significant growth driven by increasing healthcare expenditure and rising prevalence of chronic diseases. The competitive landscape is dynamic, with numerous multinational and regional pharmaceutical companies vying for market share. This fierce competition is likely to further drive innovation and price reductions, benefiting patients and healthcare systems globally.
The projected growth trajectory anticipates a considerable market expansion by 2033. Considering the 18.32% CAGR, a reasonable estimation suggests significant penetration into emerging markets, particularly in Asia-Pacific, fueled by increased affordability and expanding healthcare infrastructure. The continued patent cliff for original biologics will further catalyze this expansion. While regulatory challenges will persist, anticipated streamlining of approval processes and growing physician confidence in biosimilars' efficacy will mitigate some of these restraints. The market is expected to see increased consolidation as larger players acquire smaller biosimilar manufacturers, driving further innovation and broadening product portfolios. The focus will likely shift towards developing biosimilars for more complex biologics, opening up new therapeutic areas and expanding the overall market potential.
Biosimilars Market Report: A Comprehensive Analysis (2019-2033)
This comprehensive report provides a detailed analysis of the Biosimilars Market, offering invaluable insights for industry stakeholders, investors, and researchers. Covering the period from 2019 to 2033, with a focus on 2025, this report meticulously examines market dynamics, trends, leading players, and future opportunities within this rapidly evolving sector. The global biosimilars market is projected to reach xx Million by 2033, exhibiting a robust CAGR of xx% during the forecast period (2025-2033).
Biosimilars Market Market Dynamics & Concentration
The biosimilars market is characterized by a dynamic interplay of factors influencing its growth and concentration. Market concentration is currently moderate, with several key players holding significant market share, but a landscape shaped by ongoing innovation, mergers and acquisitions (M&A), and evolving regulatory frameworks. The historical period (2019-2024) saw a steady increase in market share for established players like Amgen Inc and Novartis AG, while newer entrants continue to emerge, driven by technological advancements and favorable regulatory environments. The number of M&A deals in the sector has averaged xx per year during the historical period, indicating a trend of consolidation and strategic expansion among industry participants. Innovation in biosimilar development focuses on improving efficacy, reducing production costs, and expanding the range of available biosimilars. Regulatory frameworks, particularly in major markets like the US and EU, significantly influence market entry and competition. Product substitutes, such as original biologics, exert competitive pressure, while evolving end-user trends, such as increased demand for cost-effective therapies, are driving biosimilar adoption.
- Market Share: Amgen Inc. and Novartis AG hold a combined xx% market share (Estimated 2025).
- M&A Activity: An average of xx M&A deals per year were recorded during 2019-2024.
- Innovation Drivers: Technological advancements in biosimilar development, including improved manufacturing processes and analytical techniques.
- Regulatory Framework: Stringent regulatory approvals in key markets are a critical factor.
- End-User Trends: Increasing demand for affordable biologics drives adoption of biosimilars.
Biosimilars Market Industry Trends & Analysis
The biosimilars market exhibits strong growth, driven by several key factors. The increasing prevalence of chronic diseases like cancer and autoimmune disorders fuels demand for affordable biologics. Technological advancements are significantly reducing the cost of biosimilar production, further enhancing market accessibility. Consumer preferences are shifting towards more cost-effective treatment options, placing biosimilars as a preferred choice. Intense competitive dynamics among manufacturers are leading to price reductions and greater innovation in biosimilar development. This is evident in the market penetration rate, which is projected to reach xx% by 2033, up from xx% in 2025. The market has experienced substantial growth, with a CAGR of xx% during the historical period (2019-2024), which is expected to moderate slightly to xx% during the forecast period (2025-2033) due to increased competition and market saturation in certain segments.
Leading Markets & Segments in Biosimilars Market
The North American market, particularly the United States, currently dominates the biosimilars market, driven by high healthcare expenditure, a large patient pool, and robust regulatory frameworks. Europe follows as a major market, exhibiting significant growth due to supportive government policies and increasing biosimilar adoption. Within product classes, Monoclonal Antibodies hold the largest market share (xx Million in 2025), owing to their diverse therapeutic applications across various disease areas. In terms of applications, Oncology represents a significant segment, followed by Chronic and Autoimmune Disorders.
Key Drivers for North America:
- High healthcare expenditure.
- Large patient population suffering from chronic diseases.
- Favorable regulatory environment.
Key Drivers for Europe:
- Supportive government policies promoting biosimilar adoption.
- Growing awareness of biosimilars' benefits.
- Increasing healthcare expenditure.
Dominant Product Class: Monoclonal Antibodies (xx Million in 2025).
Dominant Application: Oncology, followed closely by Chronic and Autoimmune disorders.
Biosimilars Market Product Developments
Recent product innovations include the development of biosimilars targeting complex biologics and novel delivery systems. These advancements expand therapeutic options and improve patient convenience. Biosimilars are increasingly demonstrating comparable efficacy and safety profiles to their reference products, leading to wider acceptance among healthcare professionals and patients. Competitive advantages are driven by factors like cost-effectiveness, improved manufacturing processes, and unique formulations. This continued innovation strengthens market competition and fuels market growth.
Key Drivers of Biosimilars Market Growth
The biosimilars market's growth is propelled by several factors. Firstly, the substantial cost savings associated with biosimilars compared to originator biologics make them an attractive option for healthcare systems and payers. Secondly, the increasing prevalence of chronic diseases globally fuels demand for more accessible and affordable therapies. Finally, supportive regulatory frameworks and policies in several countries actively promote the development and adoption of biosimilars. These drivers collectively contribute to a positive outlook for long-term market expansion.
Challenges in the Biosimilars Market Market
Despite the promising growth trajectory, the biosimilars market faces challenges. Regulatory hurdles, including stringent approval processes and complex regulatory pathways, can delay market entry. Supply chain issues, such as manufacturing capacity constraints and logistical complexities, impact availability and affordability. Intense competition from originator biologics and other biosimilar manufacturers necessitates continuous innovation and efficient cost management to remain competitive. These challenges create uncertainty and impact market growth trajectory.
Emerging Opportunities in Biosimilars Market
The future of the biosimilars market holds significant opportunities. Technological breakthroughs, such as advanced biomanufacturing techniques and improved analytical methods, enhance biosimilar development and manufacturing efficiency. Strategic partnerships between biosimilar manufacturers and pharmaceutical companies can expand market reach and accelerate product launches. Furthermore, expansion into emerging markets with high unmet needs for biologic therapies presents substantial growth potential. These factors are expected to propel the long-term growth of the biosimilars market.
Leading Players in the Biosimilars Market Sector
- Viatris Inc (Mylan)
- Novartis AG
- Amgen Inc
- Dr Reddy's Laboratories
- Intas Pharmaceutical Ltd
- Coherus Biosciences Inc
- Samsung Bioepis Co Ltd
- Eli Lilly and Company
- LG Life Sciences (LG Chem)
- Biocad
- Teva Pharmaceutical Industries Ltd
- Celltrion Healthcare
- Stada Arzneimittel AG
- Biocon Limited
- Pfizer Inc
Key Milestones in Biosimilars Market Industry
- September 2021: Samsung Bioepis and Biogen received FDA approval for BYOOVIZ (ranibizumab-nuna), the first ophthalmology biosimilar approved in the US. This marked a significant expansion of the biosimilar market into new therapeutic areas.
- May 2022: Amneal Pharmaceuticals received FDA approval for FYLNETRA (pegfilgrastim-pbbk), a biosimilar to Neulasta. This approval demonstrated continued growth and expansion within the biosimilars space.
Strategic Outlook for Biosimilars Market Market
The biosimilars market is poised for substantial growth, driven by technological advancements, favorable regulatory environments, and increasing demand for cost-effective therapies. Strategic opportunities lie in expanding product portfolios, forging strategic partnerships, and penetrating emerging markets. Companies focused on innovation, efficient manufacturing, and strong regulatory compliance are well-positioned to capture significant market share in the years to come. The market will likely see further consolidation through M&A activity, further shaping the competitive landscape.
Biosimilars Market Segmentation
-
1. Product Class
- 1.1. Monoclonal Antibodies
- 1.2. Recombinant Hormones
- 1.3. Immunomodulators
- 1.4. Anti-Inflammatory Agents
- 1.5. Other Product Classes
-
2. Application
- 2.1. Blood Disorders
- 2.2. Growth Hormonal Deficiency
- 2.3. Chronic and Autoimmune Disorders
- 2.4. Oncology
- 2.5. Other Applications
Biosimilars Market Segmentation By Geography
-
1. North America
- 1.1. United States
- 1.2. Canada
- 1.3. Mexico
-
2. Europe
- 2.1. Germany
- 2.2. United Kingdom
- 2.3. France
- 2.4. Italy
- 2.5. Spain
- 2.6. Rest of Europe
-
3. Asia Pacific
- 3.1. China
- 3.2. Japan
- 3.3. India
- 3.4. Australia
- 3.5. South Korea
- 3.6. Rest of Asia Pacific
-
4. Middle East and Africa
- 4.1. GCC
- 4.2. South Africa
- 4.3. Rest of Middle East and Africa
-
5. South America
- 5.1. Brazil
- 5.2. Argentina
- 5.3. Rest of South America
Biosimilars Market REPORT HIGHLIGHTS
| Aspects | Details |
|---|---|
| Study Period | 2019-2033 |
| Base Year | 2024 |
| Estimated Year | 2025 |
| Forecast Period | 2025-2033 |
| Historical Period | 2019-2024 |
| Growth Rate | CAGR of 18.32% from 2019-2033 |
| Segmentation |
|
Table of Contents
- 1. Introduction
- 1.1. Research Scope
- 1.2. Market Segmentation
- 1.3. Research Methodology
- 1.4. Definitions and Assumptions
- 2. Executive Summary
- 2.1. Introduction
- 3. Market Dynamics
- 3.1. Introduction
- 3.2. Market Drivers
- 3.2.1. Several Blockbuster Biopharmaceuticals Going Off-patent over the Next Five to Ten Years; Growing Burden of Chronic Diseases and Increasing R&D Investments; Increasing Demand for Biosimilar Drugs Due to Their Cost Effectiveness
- 3.3. Market Restrains
- 3.3.1. Concerns Regarding Substitutability and Interchangeability; Regulatory Uncertainty and Growing Competition from Biobetters; High Cost Involvement and Complexities in Manufacturing
- 3.4. Market Trends
- 3.4.1. The Oncology Segment Holds the Major Share in the Global Biosimilars Industry
- 4. Market Factor Analysis
- 4.1. Porters Five Forces
- 4.2. Supply/Value Chain
- 4.3. PESTEL analysis
- 4.4. Market Entropy
- 4.5. Patent/Trademark Analysis
- 5. Global Biosimilars Market Analysis, Insights and Forecast, 2019-2031
- 5.1. Market Analysis, Insights and Forecast - by Product Class
- 5.1.1. Monoclonal Antibodies
- 5.1.2. Recombinant Hormones
- 5.1.3. Immunomodulators
- 5.1.4. Anti-Inflammatory Agents
- 5.1.5. Other Product Classes
- 5.2. Market Analysis, Insights and Forecast - by Application
- 5.2.1. Blood Disorders
- 5.2.2. Growth Hormonal Deficiency
- 5.2.3. Chronic and Autoimmune Disorders
- 5.2.4. Oncology
- 5.2.5. Other Applications
- 5.3. Market Analysis, Insights and Forecast - by Region
- 5.3.1. North America
- 5.3.2. Europe
- 5.3.3. Asia Pacific
- 5.3.4. Middle East and Africa
- 5.3.5. South America
- 5.1. Market Analysis, Insights and Forecast - by Product Class
- 6. North America Biosimilars Market Analysis, Insights and Forecast, 2019-2031
- 6.1. Market Analysis, Insights and Forecast - by Product Class
- 6.1.1. Monoclonal Antibodies
- 6.1.2. Recombinant Hormones
- 6.1.3. Immunomodulators
- 6.1.4. Anti-Inflammatory Agents
- 6.1.5. Other Product Classes
- 6.2. Market Analysis, Insights and Forecast - by Application
- 6.2.1. Blood Disorders
- 6.2.2. Growth Hormonal Deficiency
- 6.2.3. Chronic and Autoimmune Disorders
- 6.2.4. Oncology
- 6.2.5. Other Applications
- 6.1. Market Analysis, Insights and Forecast - by Product Class
- 7. Europe Biosimilars Market Analysis, Insights and Forecast, 2019-2031
- 7.1. Market Analysis, Insights and Forecast - by Product Class
- 7.1.1. Monoclonal Antibodies
- 7.1.2. Recombinant Hormones
- 7.1.3. Immunomodulators
- 7.1.4. Anti-Inflammatory Agents
- 7.1.5. Other Product Classes
- 7.2. Market Analysis, Insights and Forecast - by Application
- 7.2.1. Blood Disorders
- 7.2.2. Growth Hormonal Deficiency
- 7.2.3. Chronic and Autoimmune Disorders
- 7.2.4. Oncology
- 7.2.5. Other Applications
- 7.1. Market Analysis, Insights and Forecast - by Product Class
- 8. Asia Pacific Biosimilars Market Analysis, Insights and Forecast, 2019-2031
- 8.1. Market Analysis, Insights and Forecast - by Product Class
- 8.1.1. Monoclonal Antibodies
- 8.1.2. Recombinant Hormones
- 8.1.3. Immunomodulators
- 8.1.4. Anti-Inflammatory Agents
- 8.1.5. Other Product Classes
- 8.2. Market Analysis, Insights and Forecast - by Application
- 8.2.1. Blood Disorders
- 8.2.2. Growth Hormonal Deficiency
- 8.2.3. Chronic and Autoimmune Disorders
- 8.2.4. Oncology
- 8.2.5. Other Applications
- 8.1. Market Analysis, Insights and Forecast - by Product Class
- 9. Middle East and Africa Biosimilars Market Analysis, Insights and Forecast, 2019-2031
- 9.1. Market Analysis, Insights and Forecast - by Product Class
- 9.1.1. Monoclonal Antibodies
- 9.1.2. Recombinant Hormones
- 9.1.3. Immunomodulators
- 9.1.4. Anti-Inflammatory Agents
- 9.1.5. Other Product Classes
- 9.2. Market Analysis, Insights and Forecast - by Application
- 9.2.1. Blood Disorders
- 9.2.2. Growth Hormonal Deficiency
- 9.2.3. Chronic and Autoimmune Disorders
- 9.2.4. Oncology
- 9.2.5. Other Applications
- 9.1. Market Analysis, Insights and Forecast - by Product Class
- 10. South America Biosimilars Market Analysis, Insights and Forecast, 2019-2031
- 10.1. Market Analysis, Insights and Forecast - by Product Class
- 10.1.1. Monoclonal Antibodies
- 10.1.2. Recombinant Hormones
- 10.1.3. Immunomodulators
- 10.1.4. Anti-Inflammatory Agents
- 10.1.5. Other Product Classes
- 10.2. Market Analysis, Insights and Forecast - by Application
- 10.2.1. Blood Disorders
- 10.2.2. Growth Hormonal Deficiency
- 10.2.3. Chronic and Autoimmune Disorders
- 10.2.4. Oncology
- 10.2.5. Other Applications
- 10.1. Market Analysis, Insights and Forecast - by Product Class
- 11. North America Biosimilars Market Analysis, Insights and Forecast, 2019-2031
- 11.1. Market Analysis, Insights and Forecast - By Country/Sub-region
- 11.1.1 United States
- 11.1.2 Canada
- 11.1.3 Mexico
- 12. Europe Biosimilars Market Analysis, Insights and Forecast, 2019-2031
- 12.1. Market Analysis, Insights and Forecast - By Country/Sub-region
- 12.1.1 Germany
- 12.1.2 United Kingdom
- 12.1.3 France
- 12.1.4 Italy
- 12.1.5 Spain
- 12.1.6 Rest of Europe
- 13. Asia Pacific Biosimilars Market Analysis, Insights and Forecast, 2019-2031
- 13.1. Market Analysis, Insights and Forecast - By Country/Sub-region
- 13.1.1 China
- 13.1.2 Japan
- 13.1.3 India
- 13.1.4 Australia
- 13.1.5 South Korea
- 13.1.6 Rest of Asia Pacific
- 14. Middle East and Africa Biosimilars Market Analysis, Insights and Forecast, 2019-2031
- 14.1. Market Analysis, Insights and Forecast - By Country/Sub-region
- 14.1.1 GCC
- 14.1.2 South Africa
- 14.1.3 Rest of Middle East and Africa
- 15. South America Biosimilars Market Analysis, Insights and Forecast, 2019-2031
- 15.1. Market Analysis, Insights and Forecast - By Country/Sub-region
- 15.1.1 Brazil
- 15.1.2 Argentina
- 15.1.3 Rest of South America
- 16. Competitive Analysis
- 16.1. Global Market Share Analysis 2024
- 16.2. Company Profiles
- 16.2.1 Viatris Inc (Mylan)
- 16.2.1.1. Overview
- 16.2.1.2. Products
- 16.2.1.3. SWOT Analysis
- 16.2.1.4. Recent Developments
- 16.2.1.5. Financials (Based on Availability)
- 16.2.2 Novartis AG
- 16.2.2.1. Overview
- 16.2.2.2. Products
- 16.2.2.3. SWOT Analysis
- 16.2.2.4. Recent Developments
- 16.2.2.5. Financials (Based on Availability)
- 16.2.3 Amgen Inc
- 16.2.3.1. Overview
- 16.2.3.2. Products
- 16.2.3.3. SWOT Analysis
- 16.2.3.4. Recent Developments
- 16.2.3.5. Financials (Based on Availability)
- 16.2.4 Dr Reddy's Laboratories
- 16.2.4.1. Overview
- 16.2.4.2. Products
- 16.2.4.3. SWOT Analysis
- 16.2.4.4. Recent Developments
- 16.2.4.5. Financials (Based on Availability)
- 16.2.5 Intas Pharmaceutical Ltd
- 16.2.5.1. Overview
- 16.2.5.2. Products
- 16.2.5.3. SWOT Analysis
- 16.2.5.4. Recent Developments
- 16.2.5.5. Financials (Based on Availability)
- 16.2.6 Coherus Biosciences Inc
- 16.2.6.1. Overview
- 16.2.6.2. Products
- 16.2.6.3. SWOT Analysis
- 16.2.6.4. Recent Developments
- 16.2.6.5. Financials (Based on Availability)
- 16.2.7 Samsung Bioepis Co Ltd
- 16.2.7.1. Overview
- 16.2.7.2. Products
- 16.2.7.3. SWOT Analysis
- 16.2.7.4. Recent Developments
- 16.2.7.5. Financials (Based on Availability)
- 16.2.8 Eli Lilly and Company
- 16.2.8.1. Overview
- 16.2.8.2. Products
- 16.2.8.3. SWOT Analysis
- 16.2.8.4. Recent Developments
- 16.2.8.5. Financials (Based on Availability)
- 16.2.9 LG Life Sciences (LG Chem)
- 16.2.9.1. Overview
- 16.2.9.2. Products
- 16.2.9.3. SWOT Analysis
- 16.2.9.4. Recent Developments
- 16.2.9.5. Financials (Based on Availability)
- 16.2.10 Biocad
- 16.2.10.1. Overview
- 16.2.10.2. Products
- 16.2.10.3. SWOT Analysis
- 16.2.10.4. Recent Developments
- 16.2.10.5. Financials (Based on Availability)
- 16.2.11 Teva Pharmaceutical Industries Ltd
- 16.2.11.1. Overview
- 16.2.11.2. Products
- 16.2.11.3. SWOT Analysis
- 16.2.11.4. Recent Developments
- 16.2.11.5. Financials (Based on Availability)
- 16.2.12 Celltrion Healthcare
- 16.2.12.1. Overview
- 16.2.12.2. Products
- 16.2.12.3. SWOT Analysis
- 16.2.12.4. Recent Developments
- 16.2.12.5. Financials (Based on Availability)
- 16.2.13 Stada Arzneimittel AG
- 16.2.13.1. Overview
- 16.2.13.2. Products
- 16.2.13.3. SWOT Analysis
- 16.2.13.4. Recent Developments
- 16.2.13.5. Financials (Based on Availability)
- 16.2.14 Biocon Limited
- 16.2.14.1. Overview
- 16.2.14.2. Products
- 16.2.14.3. SWOT Analysis
- 16.2.14.4. Recent Developments
- 16.2.14.5. Financials (Based on Availability)
- 16.2.15 Pfizer Inc
- 16.2.15.1. Overview
- 16.2.15.2. Products
- 16.2.15.3. SWOT Analysis
- 16.2.15.4. Recent Developments
- 16.2.15.5. Financials (Based on Availability)
- 16.2.1 Viatris Inc (Mylan)
List of Figures
- Figure 1: Global Biosimilars Market Revenue Breakdown (Million, %) by Region 2024 & 2032
- Figure 2: Global Biosimilars Market Volume Breakdown (K Unit, %) by Region 2024 & 2032
- Figure 3: North America Biosimilars Market Revenue (Million), by Country 2024 & 2032
- Figure 4: North America Biosimilars Market Volume (K Unit), by Country 2024 & 2032
- Figure 5: North America Biosimilars Market Revenue Share (%), by Country 2024 & 2032
- Figure 6: North America Biosimilars Market Volume Share (%), by Country 2024 & 2032
- Figure 7: Europe Biosimilars Market Revenue (Million), by Country 2024 & 2032
- Figure 8: Europe Biosimilars Market Volume (K Unit), by Country 2024 & 2032
- Figure 9: Europe Biosimilars Market Revenue Share (%), by Country 2024 & 2032
- Figure 10: Europe Biosimilars Market Volume Share (%), by Country 2024 & 2032
- Figure 11: Asia Pacific Biosimilars Market Revenue (Million), by Country 2024 & 2032
- Figure 12: Asia Pacific Biosimilars Market Volume (K Unit), by Country 2024 & 2032
- Figure 13: Asia Pacific Biosimilars Market Revenue Share (%), by Country 2024 & 2032
- Figure 14: Asia Pacific Biosimilars Market Volume Share (%), by Country 2024 & 2032
- Figure 15: Middle East and Africa Biosimilars Market Revenue (Million), by Country 2024 & 2032
- Figure 16: Middle East and Africa Biosimilars Market Volume (K Unit), by Country 2024 & 2032
- Figure 17: Middle East and Africa Biosimilars Market Revenue Share (%), by Country 2024 & 2032
- Figure 18: Middle East and Africa Biosimilars Market Volume Share (%), by Country 2024 & 2032
- Figure 19: South America Biosimilars Market Revenue (Million), by Country 2024 & 2032
- Figure 20: South America Biosimilars Market Volume (K Unit), by Country 2024 & 2032
- Figure 21: South America Biosimilars Market Revenue Share (%), by Country 2024 & 2032
- Figure 22: South America Biosimilars Market Volume Share (%), by Country 2024 & 2032
- Figure 23: North America Biosimilars Market Revenue (Million), by Product Class 2024 & 2032
- Figure 24: North America Biosimilars Market Volume (K Unit), by Product Class 2024 & 2032
- Figure 25: North America Biosimilars Market Revenue Share (%), by Product Class 2024 & 2032
- Figure 26: North America Biosimilars Market Volume Share (%), by Product Class 2024 & 2032
- Figure 27: North America Biosimilars Market Revenue (Million), by Application 2024 & 2032
- Figure 28: North America Biosimilars Market Volume (K Unit), by Application 2024 & 2032
- Figure 29: North America Biosimilars Market Revenue Share (%), by Application 2024 & 2032
- Figure 30: North America Biosimilars Market Volume Share (%), by Application 2024 & 2032
- Figure 31: North America Biosimilars Market Revenue (Million), by Country 2024 & 2032
- Figure 32: North America Biosimilars Market Volume (K Unit), by Country 2024 & 2032
- Figure 33: North America Biosimilars Market Revenue Share (%), by Country 2024 & 2032
- Figure 34: North America Biosimilars Market Volume Share (%), by Country 2024 & 2032
- Figure 35: Europe Biosimilars Market Revenue (Million), by Product Class 2024 & 2032
- Figure 36: Europe Biosimilars Market Volume (K Unit), by Product Class 2024 & 2032
- Figure 37: Europe Biosimilars Market Revenue Share (%), by Product Class 2024 & 2032
- Figure 38: Europe Biosimilars Market Volume Share (%), by Product Class 2024 & 2032
- Figure 39: Europe Biosimilars Market Revenue (Million), by Application 2024 & 2032
- Figure 40: Europe Biosimilars Market Volume (K Unit), by Application 2024 & 2032
- Figure 41: Europe Biosimilars Market Revenue Share (%), by Application 2024 & 2032
- Figure 42: Europe Biosimilars Market Volume Share (%), by Application 2024 & 2032
- Figure 43: Europe Biosimilars Market Revenue (Million), by Country 2024 & 2032
- Figure 44: Europe Biosimilars Market Volume (K Unit), by Country 2024 & 2032
- Figure 45: Europe Biosimilars Market Revenue Share (%), by Country 2024 & 2032
- Figure 46: Europe Biosimilars Market Volume Share (%), by Country 2024 & 2032
- Figure 47: Asia Pacific Biosimilars Market Revenue (Million), by Product Class 2024 & 2032
- Figure 48: Asia Pacific Biosimilars Market Volume (K Unit), by Product Class 2024 & 2032
- Figure 49: Asia Pacific Biosimilars Market Revenue Share (%), by Product Class 2024 & 2032
- Figure 50: Asia Pacific Biosimilars Market Volume Share (%), by Product Class 2024 & 2032
- Figure 51: Asia Pacific Biosimilars Market Revenue (Million), by Application 2024 & 2032
- Figure 52: Asia Pacific Biosimilars Market Volume (K Unit), by Application 2024 & 2032
- Figure 53: Asia Pacific Biosimilars Market Revenue Share (%), by Application 2024 & 2032
- Figure 54: Asia Pacific Biosimilars Market Volume Share (%), by Application 2024 & 2032
- Figure 55: Asia Pacific Biosimilars Market Revenue (Million), by Country 2024 & 2032
- Figure 56: Asia Pacific Biosimilars Market Volume (K Unit), by Country 2024 & 2032
- Figure 57: Asia Pacific Biosimilars Market Revenue Share (%), by Country 2024 & 2032
- Figure 58: Asia Pacific Biosimilars Market Volume Share (%), by Country 2024 & 2032
- Figure 59: Middle East and Africa Biosimilars Market Revenue (Million), by Product Class 2024 & 2032
- Figure 60: Middle East and Africa Biosimilars Market Volume (K Unit), by Product Class 2024 & 2032
- Figure 61: Middle East and Africa Biosimilars Market Revenue Share (%), by Product Class 2024 & 2032
- Figure 62: Middle East and Africa Biosimilars Market Volume Share (%), by Product Class 2024 & 2032
- Figure 63: Middle East and Africa Biosimilars Market Revenue (Million), by Application 2024 & 2032
- Figure 64: Middle East and Africa Biosimilars Market Volume (K Unit), by Application 2024 & 2032
- Figure 65: Middle East and Africa Biosimilars Market Revenue Share (%), by Application 2024 & 2032
- Figure 66: Middle East and Africa Biosimilars Market Volume Share (%), by Application 2024 & 2032
- Figure 67: Middle East and Africa Biosimilars Market Revenue (Million), by Country 2024 & 2032
- Figure 68: Middle East and Africa Biosimilars Market Volume (K Unit), by Country 2024 & 2032
- Figure 69: Middle East and Africa Biosimilars Market Revenue Share (%), by Country 2024 & 2032
- Figure 70: Middle East and Africa Biosimilars Market Volume Share (%), by Country 2024 & 2032
- Figure 71: South America Biosimilars Market Revenue (Million), by Product Class 2024 & 2032
- Figure 72: South America Biosimilars Market Volume (K Unit), by Product Class 2024 & 2032
- Figure 73: South America Biosimilars Market Revenue Share (%), by Product Class 2024 & 2032
- Figure 74: South America Biosimilars Market Volume Share (%), by Product Class 2024 & 2032
- Figure 75: South America Biosimilars Market Revenue (Million), by Application 2024 & 2032
- Figure 76: South America Biosimilars Market Volume (K Unit), by Application 2024 & 2032
- Figure 77: South America Biosimilars Market Revenue Share (%), by Application 2024 & 2032
- Figure 78: South America Biosimilars Market Volume Share (%), by Application 2024 & 2032
- Figure 79: South America Biosimilars Market Revenue (Million), by Country 2024 & 2032
- Figure 80: South America Biosimilars Market Volume (K Unit), by Country 2024 & 2032
- Figure 81: South America Biosimilars Market Revenue Share (%), by Country 2024 & 2032
- Figure 82: South America Biosimilars Market Volume Share (%), by Country 2024 & 2032
List of Tables
- Table 1: Global Biosimilars Market Revenue Million Forecast, by Region 2019 & 2032
- Table 2: Global Biosimilars Market Volume K Unit Forecast, by Region 2019 & 2032
- Table 3: Global Biosimilars Market Revenue Million Forecast, by Product Class 2019 & 2032
- Table 4: Global Biosimilars Market Volume K Unit Forecast, by Product Class 2019 & 2032
- Table 5: Global Biosimilars Market Revenue Million Forecast, by Application 2019 & 2032
- Table 6: Global Biosimilars Market Volume K Unit Forecast, by Application 2019 & 2032
- Table 7: Global Biosimilars Market Revenue Million Forecast, by Region 2019 & 2032
- Table 8: Global Biosimilars Market Volume K Unit Forecast, by Region 2019 & 2032
- Table 9: Global Biosimilars Market Revenue Million Forecast, by Country 2019 & 2032
- Table 10: Global Biosimilars Market Volume K Unit Forecast, by Country 2019 & 2032
- Table 11: United States Biosimilars Market Revenue (Million) Forecast, by Application 2019 & 2032
- Table 12: United States Biosimilars Market Volume (K Unit) Forecast, by Application 2019 & 2032
- Table 13: Canada Biosimilars Market Revenue (Million) Forecast, by Application 2019 & 2032
- Table 14: Canada Biosimilars Market Volume (K Unit) Forecast, by Application 2019 & 2032
- Table 15: Mexico Biosimilars Market Revenue (Million) Forecast, by Application 2019 & 2032
- Table 16: Mexico Biosimilars Market Volume (K Unit) Forecast, by Application 2019 & 2032
- Table 17: Global Biosimilars Market Revenue Million Forecast, by Country 2019 & 2032
- Table 18: Global Biosimilars Market Volume K Unit Forecast, by Country 2019 & 2032
- Table 19: Germany Biosimilars Market Revenue (Million) Forecast, by Application 2019 & 2032
- Table 20: Germany Biosimilars Market Volume (K Unit) Forecast, by Application 2019 & 2032
- Table 21: United Kingdom Biosimilars Market Revenue (Million) Forecast, by Application 2019 & 2032
- Table 22: United Kingdom Biosimilars Market Volume (K Unit) Forecast, by Application 2019 & 2032
- Table 23: France Biosimilars Market Revenue (Million) Forecast, by Application 2019 & 2032
- Table 24: France Biosimilars Market Volume (K Unit) Forecast, by Application 2019 & 2032
- Table 25: Italy Biosimilars Market Revenue (Million) Forecast, by Application 2019 & 2032
- Table 26: Italy Biosimilars Market Volume (K Unit) Forecast, by Application 2019 & 2032
- Table 27: Spain Biosimilars Market Revenue (Million) Forecast, by Application 2019 & 2032
- Table 28: Spain Biosimilars Market Volume (K Unit) Forecast, by Application 2019 & 2032
- Table 29: Rest of Europe Biosimilars Market Revenue (Million) Forecast, by Application 2019 & 2032
- Table 30: Rest of Europe Biosimilars Market Volume (K Unit) Forecast, by Application 2019 & 2032
- Table 31: Global Biosimilars Market Revenue Million Forecast, by Country 2019 & 2032
- Table 32: Global Biosimilars Market Volume K Unit Forecast, by Country 2019 & 2032
- Table 33: China Biosimilars Market Revenue (Million) Forecast, by Application 2019 & 2032
- Table 34: China Biosimilars Market Volume (K Unit) Forecast, by Application 2019 & 2032
- Table 35: Japan Biosimilars Market Revenue (Million) Forecast, by Application 2019 & 2032
- Table 36: Japan Biosimilars Market Volume (K Unit) Forecast, by Application 2019 & 2032
- Table 37: India Biosimilars Market Revenue (Million) Forecast, by Application 2019 & 2032
- Table 38: India Biosimilars Market Volume (K Unit) Forecast, by Application 2019 & 2032
- Table 39: Australia Biosimilars Market Revenue (Million) Forecast, by Application 2019 & 2032
- Table 40: Australia Biosimilars Market Volume (K Unit) Forecast, by Application 2019 & 2032
- Table 41: South Korea Biosimilars Market Revenue (Million) Forecast, by Application 2019 & 2032
- Table 42: South Korea Biosimilars Market Volume (K Unit) Forecast, by Application 2019 & 2032
- Table 43: Rest of Asia Pacific Biosimilars Market Revenue (Million) Forecast, by Application 2019 & 2032
- Table 44: Rest of Asia Pacific Biosimilars Market Volume (K Unit) Forecast, by Application 2019 & 2032
- Table 45: Global Biosimilars Market Revenue Million Forecast, by Country 2019 & 2032
- Table 46: Global Biosimilars Market Volume K Unit Forecast, by Country 2019 & 2032
- Table 47: GCC Biosimilars Market Revenue (Million) Forecast, by Application 2019 & 2032
- Table 48: GCC Biosimilars Market Volume (K Unit) Forecast, by Application 2019 & 2032
- Table 49: South Africa Biosimilars Market Revenue (Million) Forecast, by Application 2019 & 2032
- Table 50: South Africa Biosimilars Market Volume (K Unit) Forecast, by Application 2019 & 2032
- Table 51: Rest of Middle East and Africa Biosimilars Market Revenue (Million) Forecast, by Application 2019 & 2032
- Table 52: Rest of Middle East and Africa Biosimilars Market Volume (K Unit) Forecast, by Application 2019 & 2032
- Table 53: Global Biosimilars Market Revenue Million Forecast, by Country 2019 & 2032
- Table 54: Global Biosimilars Market Volume K Unit Forecast, by Country 2019 & 2032
- Table 55: Brazil Biosimilars Market Revenue (Million) Forecast, by Application 2019 & 2032
- Table 56: Brazil Biosimilars Market Volume (K Unit) Forecast, by Application 2019 & 2032
- Table 57: Argentina Biosimilars Market Revenue (Million) Forecast, by Application 2019 & 2032
- Table 58: Argentina Biosimilars Market Volume (K Unit) Forecast, by Application 2019 & 2032
- Table 59: Rest of South America Biosimilars Market Revenue (Million) Forecast, by Application 2019 & 2032
- Table 60: Rest of South America Biosimilars Market Volume (K Unit) Forecast, by Application 2019 & 2032
- Table 61: Global Biosimilars Market Revenue Million Forecast, by Product Class 2019 & 2032
- Table 62: Global Biosimilars Market Volume K Unit Forecast, by Product Class 2019 & 2032
- Table 63: Global Biosimilars Market Revenue Million Forecast, by Application 2019 & 2032
- Table 64: Global Biosimilars Market Volume K Unit Forecast, by Application 2019 & 2032
- Table 65: Global Biosimilars Market Revenue Million Forecast, by Country 2019 & 2032
- Table 66: Global Biosimilars Market Volume K Unit Forecast, by Country 2019 & 2032
- Table 67: United States Biosimilars Market Revenue (Million) Forecast, by Application 2019 & 2032
- Table 68: United States Biosimilars Market Volume (K Unit) Forecast, by Application 2019 & 2032
- Table 69: Canada Biosimilars Market Revenue (Million) Forecast, by Application 2019 & 2032
- Table 70: Canada Biosimilars Market Volume (K Unit) Forecast, by Application 2019 & 2032
- Table 71: Mexico Biosimilars Market Revenue (Million) Forecast, by Application 2019 & 2032
- Table 72: Mexico Biosimilars Market Volume (K Unit) Forecast, by Application 2019 & 2032
- Table 73: Global Biosimilars Market Revenue Million Forecast, by Product Class 2019 & 2032
- Table 74: Global Biosimilars Market Volume K Unit Forecast, by Product Class 2019 & 2032
- Table 75: Global Biosimilars Market Revenue Million Forecast, by Application 2019 & 2032
- Table 76: Global Biosimilars Market Volume K Unit Forecast, by Application 2019 & 2032
- Table 77: Global Biosimilars Market Revenue Million Forecast, by Country 2019 & 2032
- Table 78: Global Biosimilars Market Volume K Unit Forecast, by Country 2019 & 2032
- Table 79: Germany Biosimilars Market Revenue (Million) Forecast, by Application 2019 & 2032
- Table 80: Germany Biosimilars Market Volume (K Unit) Forecast, by Application 2019 & 2032
- Table 81: United Kingdom Biosimilars Market Revenue (Million) Forecast, by Application 2019 & 2032
- Table 82: United Kingdom Biosimilars Market Volume (K Unit) Forecast, by Application 2019 & 2032
- Table 83: France Biosimilars Market Revenue (Million) Forecast, by Application 2019 & 2032
- Table 84: France Biosimilars Market Volume (K Unit) Forecast, by Application 2019 & 2032
- Table 85: Italy Biosimilars Market Revenue (Million) Forecast, by Application 2019 & 2032
- Table 86: Italy Biosimilars Market Volume (K Unit) Forecast, by Application 2019 & 2032
- Table 87: Spain Biosimilars Market Revenue (Million) Forecast, by Application 2019 & 2032
- Table 88: Spain Biosimilars Market Volume (K Unit) Forecast, by Application 2019 & 2032
- Table 89: Rest of Europe Biosimilars Market Revenue (Million) Forecast, by Application 2019 & 2032
- Table 90: Rest of Europe Biosimilars Market Volume (K Unit) Forecast, by Application 2019 & 2032
- Table 91: Global Biosimilars Market Revenue Million Forecast, by Product Class 2019 & 2032
- Table 92: Global Biosimilars Market Volume K Unit Forecast, by Product Class 2019 & 2032
- Table 93: Global Biosimilars Market Revenue Million Forecast, by Application 2019 & 2032
- Table 94: Global Biosimilars Market Volume K Unit Forecast, by Application 2019 & 2032
- Table 95: Global Biosimilars Market Revenue Million Forecast, by Country 2019 & 2032
- Table 96: Global Biosimilars Market Volume K Unit Forecast, by Country 2019 & 2032
- Table 97: China Biosimilars Market Revenue (Million) Forecast, by Application 2019 & 2032
- Table 98: China Biosimilars Market Volume (K Unit) Forecast, by Application 2019 & 2032
- Table 99: Japan Biosimilars Market Revenue (Million) Forecast, by Application 2019 & 2032
- Table 100: Japan Biosimilars Market Volume (K Unit) Forecast, by Application 2019 & 2032
- Table 101: India Biosimilars Market Revenue (Million) Forecast, by Application 2019 & 2032
- Table 102: India Biosimilars Market Volume (K Unit) Forecast, by Application 2019 & 2032
- Table 103: Australia Biosimilars Market Revenue (Million) Forecast, by Application 2019 & 2032
- Table 104: Australia Biosimilars Market Volume (K Unit) Forecast, by Application 2019 & 2032
- Table 105: South Korea Biosimilars Market Revenue (Million) Forecast, by Application 2019 & 2032
- Table 106: South Korea Biosimilars Market Volume (K Unit) Forecast, by Application 2019 & 2032
- Table 107: Rest of Asia Pacific Biosimilars Market Revenue (Million) Forecast, by Application 2019 & 2032
- Table 108: Rest of Asia Pacific Biosimilars Market Volume (K Unit) Forecast, by Application 2019 & 2032
- Table 109: Global Biosimilars Market Revenue Million Forecast, by Product Class 2019 & 2032
- Table 110: Global Biosimilars Market Volume K Unit Forecast, by Product Class 2019 & 2032
- Table 111: Global Biosimilars Market Revenue Million Forecast, by Application 2019 & 2032
- Table 112: Global Biosimilars Market Volume K Unit Forecast, by Application 2019 & 2032
- Table 113: Global Biosimilars Market Revenue Million Forecast, by Country 2019 & 2032
- Table 114: Global Biosimilars Market Volume K Unit Forecast, by Country 2019 & 2032
- Table 115: GCC Biosimilars Market Revenue (Million) Forecast, by Application 2019 & 2032
- Table 116: GCC Biosimilars Market Volume (K Unit) Forecast, by Application 2019 & 2032
- Table 117: South Africa Biosimilars Market Revenue (Million) Forecast, by Application 2019 & 2032
- Table 118: South Africa Biosimilars Market Volume (K Unit) Forecast, by Application 2019 & 2032
- Table 119: Rest of Middle East and Africa Biosimilars Market Revenue (Million) Forecast, by Application 2019 & 2032
- Table 120: Rest of Middle East and Africa Biosimilars Market Volume (K Unit) Forecast, by Application 2019 & 2032
- Table 121: Global Biosimilars Market Revenue Million Forecast, by Product Class 2019 & 2032
- Table 122: Global Biosimilars Market Volume K Unit Forecast, by Product Class 2019 & 2032
- Table 123: Global Biosimilars Market Revenue Million Forecast, by Application 2019 & 2032
- Table 124: Global Biosimilars Market Volume K Unit Forecast, by Application 2019 & 2032
- Table 125: Global Biosimilars Market Revenue Million Forecast, by Country 2019 & 2032
- Table 126: Global Biosimilars Market Volume K Unit Forecast, by Country 2019 & 2032
- Table 127: Brazil Biosimilars Market Revenue (Million) Forecast, by Application 2019 & 2032
- Table 128: Brazil Biosimilars Market Volume (K Unit) Forecast, by Application 2019 & 2032
- Table 129: Argentina Biosimilars Market Revenue (Million) Forecast, by Application 2019 & 2032
- Table 130: Argentina Biosimilars Market Volume (K Unit) Forecast, by Application 2019 & 2032
- Table 131: Rest of South America Biosimilars Market Revenue (Million) Forecast, by Application 2019 & 2032
- Table 132: Rest of South America Biosimilars Market Volume (K Unit) Forecast, by Application 2019 & 2032
Frequently Asked Questions
1. What is the projected Compound Annual Growth Rate (CAGR) of the Biosimilars Market?
The projected CAGR is approximately 18.32%.
2. Which companies are prominent players in the Biosimilars Market?
Key companies in the market include Viatris Inc (Mylan), Novartis AG, Amgen Inc, Dr Reddy's Laboratories, Intas Pharmaceutical Ltd, Coherus Biosciences Inc, Samsung Bioepis Co Ltd, Eli Lilly and Company, LG Life Sciences (LG Chem), Biocad, Teva Pharmaceutical Industries Ltd, Celltrion Healthcare, Stada Arzneimittel AG, Biocon Limited, Pfizer Inc.
3. What are the main segments of the Biosimilars Market?
The market segments include Product Class, Application.
4. Can you provide details about the market size?
The market size is estimated to be USD 35.47 Million as of 2022.
5. What are some drivers contributing to market growth?
Several Blockbuster Biopharmaceuticals Going Off-patent over the Next Five to Ten Years; Growing Burden of Chronic Diseases and Increasing R&D Investments; Increasing Demand for Biosimilar Drugs Due to Their Cost Effectiveness.
6. What are the notable trends driving market growth?
The Oncology Segment Holds the Major Share in the Global Biosimilars Industry.
7. Are there any restraints impacting market growth?
Concerns Regarding Substitutability and Interchangeability; Regulatory Uncertainty and Growing Competition from Biobetters; High Cost Involvement and Complexities in Manufacturing.
8. Can you provide examples of recent developments in the market?
In May 2022, Amneal Pharmaceuticals, Inc. received United States Food and Drug Administration ("FDA") approval for a Biologics License Application ("BLA") for pegfilgrastim-pbbk, a biosimilar referencing Neulasta. The product will be marketed under the proprietary name FYLNETRA.
9. What pricing options are available for accessing the report?
Pricing options include single-user, multi-user, and enterprise licenses priced at USD 4750, USD 5250, and USD 8750 respectively.
10. Is the market size provided in terms of value or volume?
The market size is provided in terms of value, measured in Million and volume, measured in K Unit.
11. Are there any specific market keywords associated with the report?
Yes, the market keyword associated with the report is "Biosimilars Market," which aids in identifying and referencing the specific market segment covered.
12. How do I determine which pricing option suits my needs best?
The pricing options vary based on user requirements and access needs. Individual users may opt for single-user licenses, while businesses requiring broader access may choose multi-user or enterprise licenses for cost-effective access to the report.
13. Are there any additional resources or data provided in the Biosimilars Market report?
While the report offers comprehensive insights, it's advisable to review the specific contents or supplementary materials provided to ascertain if additional resources or data are available.
14. How can I stay updated on further developments or reports in the Biosimilars Market?
To stay informed about further developments, trends, and reports in the Biosimilars Market, consider subscribing to industry newsletters, following relevant companies and organizations, or regularly checking reputable industry news sources and publications.
Methodology
Step 1 - Identification of Relevant Samples Size from Population Database


Step 2 - Approaches for Defining Global Market Size (Value, Volume* & Price*)

Note*: In applicable scenarios
Step 3 - Data Sources
Primary Research
- Web Analytics
- Survey Reports
- Research Institute
- Latest Research Reports
- Opinion Leaders
Secondary Research
- Annual Reports
- White Paper
- Latest Press Release
- Industry Association
- Paid Database
- Investor Presentations

Step 4 - Data Triangulation
Involves using different sources of information in order to increase the validity of a study
These sources are likely to be stakeholders in a program - participants, other researchers, program staff, other community members, and so on.
Then we put all data in single framework & apply various statistical tools to find out the dynamic on the market.
During the analysis stage, feedback from the stakeholder groups would be compared to determine areas of agreement as well as areas of divergence
