

Key Insights
The bioplastics market is experiencing robust growth, driven by increasing environmental concerns and stringent regulations regarding plastic waste. A compound annual growth rate (CAGR) of 17.25% from 2019 to 2024 indicates a significant market expansion. This growth is fueled by the rising demand for sustainable packaging solutions across various sectors, including food and beverage, consumer goods, and agriculture. The flexible packaging segment currently dominates the application landscape, but rigid packaging is witnessing rapid growth, driven by innovations in bio-based materials and manufacturing processes. Key players like Novamont SpA, Total Corbion PLA, and Natureworks LLC are leading the innovation in bio-based and biodegradable bioplastics, constantly developing new materials with enhanced properties to meet diverse industry needs. The Asia-Pacific region, particularly China and India, is a major market driver due to its large population and rapidly growing consumer base. However, challenges remain, including the relatively higher cost of bioplastics compared to traditional petroleum-based plastics, and the need for better infrastructure to support efficient collection and composting of biodegradable materials. Overcoming these hurdles through technological advancements and policy support will further accelerate market expansion in the coming years. The forecast period (2025-2033) anticipates continued strong growth, with particular focus on advancements in bio-based non-biodegradable options that offer durability comparable to conventional plastics but with a reduced environmental impact. This will lead to increased adoption across sectors like automotive and construction.
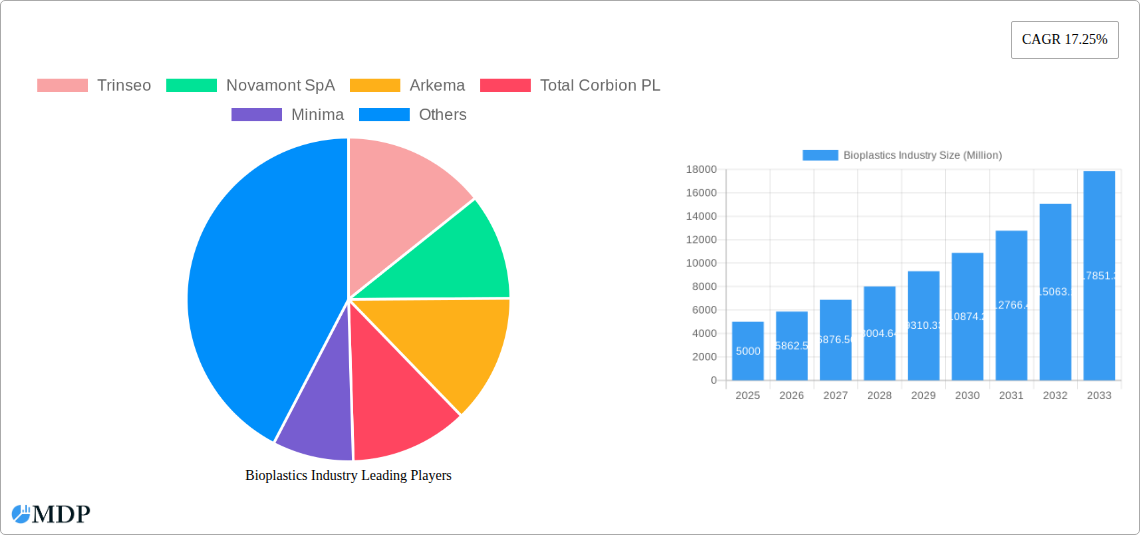
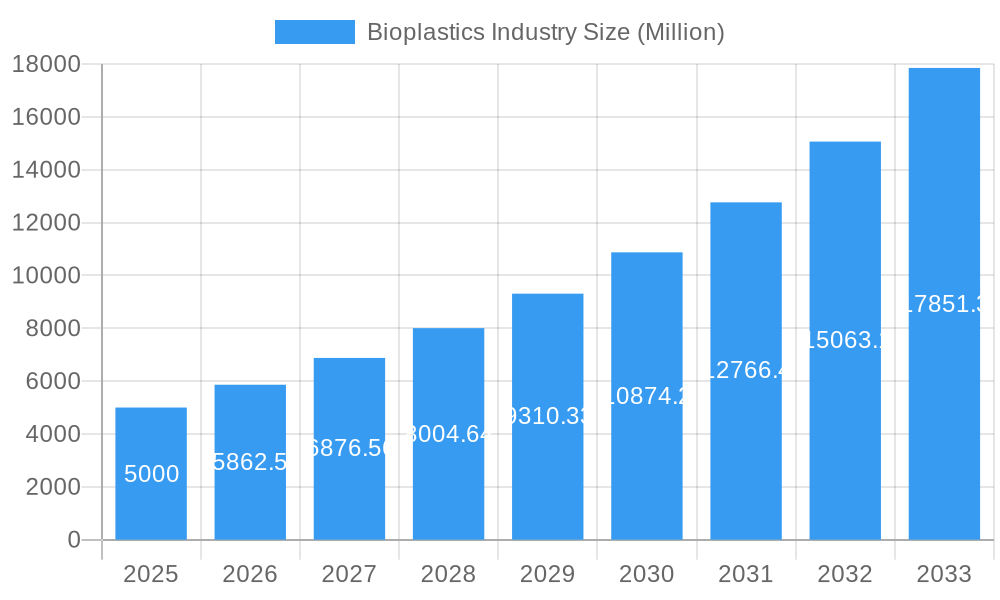
Bioplastics Industry Market Size (In Billion)
The market segmentation highlights the diverse applications of bioplastics. Bio-based biodegradables are currently the dominant type, but bio-based non-biodegradables are gaining traction due to their improved performance characteristics. While the exact market size for 2025 is not explicitly stated, extrapolating from the CAGR and assuming a reasonable starting point based on industry reports, we can project a substantial market value in the billions of dollars for 2025, growing further to reach even higher valuations by 2033. Regional variations in growth will be influenced by factors such as government policies promoting sustainability, the availability of feedstock for bioplastic production, and the level of consumer awareness regarding environmental issues.
Bioplastics Industry Company Market Share
Bioplastics Industry Market Report: 2019-2033
This comprehensive report provides an in-depth analysis of the bioplastics industry, offering valuable insights for stakeholders, investors, and industry professionals. We project a market exceeding xx Million by 2033, driven by increasing consumer demand for sustainable materials and stringent environmental regulations. This report covers the period 2019-2033, with a focus on the forecast period 2025-2033 and a base year of 2025.
Bioplastics Industry Market Dynamics & Concentration
The global bioplastics market is characterized by moderate concentration, with several key players holding significant market share. However, the industry is witnessing increased competition from both established chemical companies and emerging biotech firms. Market share dynamics are influenced by factors such as innovation in bio-based polymers, stringent government regulations promoting sustainable materials, and the growing availability of cost-effective renewable feedstocks. Product substitution from traditional plastics is a significant driver, while ongoing mergers and acquisitions (M&A) activity further shapes the competitive landscape. During the historical period (2019-2024), we observed approximately xx M&A deals, with an expected increase to xx deals during the forecast period (2025-2033). Key players like Trinseo, Novamont SpA, Arkema, Total Corbion PLA, and BASF SE hold substantial market shares, but smaller companies specializing in niche applications are also emerging.
- Market Concentration: Moderate, with a few dominant players and a growing number of smaller, specialized firms.
- Innovation Drivers: Development of new bio-based polymers, improved biodegradability, and cost reduction.
- Regulatory Frameworks: Increasingly stringent regulations promoting the use of sustainable materials are impacting market growth.
- Product Substitutes: Traditional plastics remain a major competitor, but bioplastics are gradually gaining market share.
- End-User Trends: Growing consumer preference for eco-friendly products drives demand for bioplastics across various applications.
- M&A Activity: Significant M&A activity is reshaping the market landscape through consolidation and expansion.
Bioplastics Industry Industry Trends & Analysis
The bioplastics industry is experiencing robust growth, with a projected Compound Annual Growth Rate (CAGR) of xx% from 2025 to 2033. This growth is fueled by several factors, including increasing environmental awareness, stricter regulations on conventional plastics, and technological advancements leading to improved bioplastic properties and cost-effectiveness. Market penetration is steadily increasing across various sectors, with significant adoption in packaging, automotive, and agriculture. The market is witnessing disruptive technologies like the development of bioplastics from seaweed and other novel feedstocks. However, competitive dynamics remain intense, with companies focusing on differentiation through product innovation, sustainability certifications, and supply chain optimization. The adoption rate of bioplastics is still affected by challenges such as higher production costs compared to traditional plastics in certain segments, but these are expected to ease as technology and scale improve.
Leading Markets & Segments in Bioplastics Industry
The Asia-Pacific region is expected to remain the dominant market for bioplastics due to rapid economic growth, increasing disposable incomes, and favorable government policies promoting sustainable development. Within this region, China and India are key drivers of growth. In terms of segments, Flexible Packaging holds the largest market share, followed by Rigid Packaging, due to high demand from the food and beverage industry. However, significant growth is expected in applications like Automotive and Assembly Operations, Agriculture and Horticulture, and Construction as industry stakeholders increasingly prioritize sustainability.
- Key Drivers in Asia-Pacific: Rapid economic growth, increasing disposable incomes, supportive government policies, and growing environmental awareness.
- Flexible Packaging Dominance: High demand from the food and beverage industry and consumer goods sector.
- Growth in Specialized Applications: Automotive, agriculture, and construction sectors are showing increasing adoption.
- Bio-based Biodegradables Segment: This segment is experiencing higher growth compared to other bio-based segments due to growing consumer preference for biodegradable materials.
Bioplastics Industry Product Developments
Recent product innovations have focused on improving bioplastic properties, such as enhancing biodegradability, increasing strength, and improving heat resistance. The launch of Trinseo's MAGNUM BIO ABS for automotive applications exemplifies the focus on tailored solutions for specific industries. Technological advancements in bio-based polymer synthesis and processing are key to unlocking new market opportunities and providing bioplastics that compete favorably with conventional plastics in performance and cost. The development of bioplastics from seaweed is a prime example of disruptive innovation.
Key Drivers of Bioplastics Industry Growth
Several factors are driving the growth of the bioplastics industry:
- Increasing Environmental Awareness: Growing consumer demand for eco-friendly alternatives to traditional plastics.
- Stringent Government Regulations: Governments worldwide are implementing stricter regulations on plastic waste, promoting the use of bioplastics.
- Technological Advancements: Innovations in bio-based polymer production are leading to improved bioplastic properties and cost reductions.
- Investments in R&D: Significant investments in research and development are accelerating the innovation process and bringing new bioplastics to the market.
Challenges in the Bioplastics Industry Market
The bioplastics industry faces several challenges:
- Higher Production Costs: Bioplastics are often more expensive to produce than traditional plastics, limiting their widespread adoption.
- Supply Chain Issues: Ensuring a stable and reliable supply of renewable feedstocks is crucial for the industry's growth.
- Lack of Standardization: The lack of standardized testing methods and certifications can hinder market development.
- Limited Biodegradability: Not all bioplastics are truly biodegradable, and the conditions for biodegradation can vary.
Emerging Opportunities in Bioplastics Industry
The long-term growth of the bioplastics industry is fueled by several opportunities:
- Technological Breakthroughs: Ongoing advancements in bio-based polymer synthesis and processing are paving the way for new, high-performance bioplastics.
- Strategic Partnerships: Collaboration between companies across the value chain is creating opportunities for innovation and market expansion.
- Market Expansion in New Applications: Bioplastics are finding applications in new sectors, such as construction and electronics, driving growth.
Leading Players in the Bioplastics Industry Sector
- Trinseo
- Novamont SpA
- Arkema
- Total Corbion PLA
- Minima
- Futerro
- Rodenburg Biopolymers
- Braskem
- Indorama Ventures Public Company Limited
- Natureworks LLC
- BIOTEC
- Danimer Scientific
- BASF SE
Key Milestones in Bioplastics Industry Industry
- March 2022: ABB technology automated NatureWorks' new bioplastics plant in Thailand, increasing Ingeo PLA biopolymer production to 75,000 tons annually.
- April 2022: Trinseo launched MAGNUM BIO ABS for automotive applications, expanding its sustainable product portfolio.
- August 2022: BASF Venture Capital GmbH and Aqua-Spark invested in Sea6 Energy Pvt. Ltd., supporting bioplastic development from seaweed.
Strategic Outlook for Bioplastics Industry Market
The future of the bioplastics industry is promising, with significant growth potential driven by increasing consumer demand, supportive government policies, and technological advancements. Strategic partnerships, investments in R&D, and the development of innovative bio-based polymers will be key to unlocking this potential. The focus on circular economy principles and the development of truly biodegradable and compostable materials will be crucial for long-term sustainability and market acceptance.
Bioplastics Industry Segmentation
-
1. Type
-
1.1. Bio-based Biodegradables
- 1.1.1. Starch-based
- 1.1.2. Polylactic Acid (PLA)
- 1.1.3. Polyhydroxy Alkanoates (PHA)
- 1.1.4. Polyesters (PBS, PBAT, and PCL)
- 1.1.5. Other Bio-based Biodegradables
-
1.2. Bio-based Non-biodegradables
- 1.2.1. Bio Polyethylene Terephthalate (PET)
- 1.2.2. Bio Polyamides
- 1.2.3. Bio Polytrimethylene Terephthalate
- 1.2.4. Other Non-biodegradables
-
1.1. Bio-based Biodegradables
-
2. Application
- 2.1. Flexible Packaging
- 2.2. Rigid Packaging
- 2.3. Automotive and Assembly Operations
- 2.4. Agriculture and Horticulture
- 2.5. Construction
- 2.6. Textiles
- 2.7. Electrical and Electronics
- 2.8. Other Applications
Bioplastics Industry Segmentation By Geography
-
1. Asia Pacific
- 1.1. China
- 1.2. India
- 1.3. Japan
- 1.4. South Korea
- 1.5. Rest of Asia Pacific
-
2. North America
- 2.1. United States
- 2.2. Canada
- 2.3. Mexico
-
3. Europe
- 3.1. Germany
- 3.2. United Kingdom
- 3.3. Italy
- 3.4. France
- 3.5. Rest of Europe
-
4. South America
- 4.1. Brazil
- 4.2. Argentina
- 4.3. Rest of South America
-
5. Middle East and Africa
- 5.1. Saudi Arabia
- 5.2. South Africa
- 5.3. Rest of Middle East and Africa
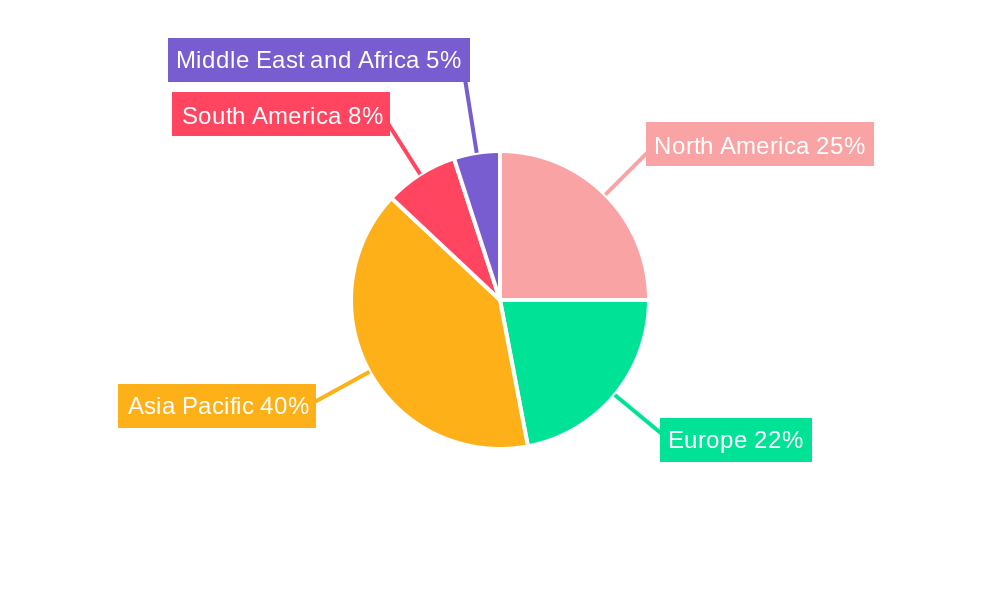
Bioplastics Industry Regional Market Share
Geographic Coverage of Bioplastics Industry
Bioplastics Industry REPORT HIGHLIGHTS
| Aspects | Details |
|---|---|
| Study Period | 2020-2034 |
| Base Year | 2025 |
| Estimated Year | 2026 |
| Forecast Period | 2026-2034 |
| Historical Period | 2020-2025 |
| Growth Rate | CAGR of 17.6% from 2020-2034 |
| Segmentation |
|
Table of Contents
- 1. Introduction
- 1.1. Research Scope
- 1.2. Market Segmentation
- 1.3. Research Objective
- 1.4. Definitions and Assumptions
- 2. Executive Summary
- 2.1. Market Snapshot
- 3. Market Dynamics
- 3.1. Market Drivers
- 3.2. Market Restrains
- 3.3. Market Trends
- 3.4. Market Opportunities
- 4. Market Factor Analysis
- 4.1. Porters Five Forces
- 4.1.1. Bargaining Power of Suppliers
- 4.1.2. Bargaining Power of Buyers
- 4.1.3. Threat of New Entrants
- 4.1.4. Threat of Substitutes
- 4.1.5. Competitive Rivalry
- 4.2. PESTEL analysis
- 4.3. BCG Analysis
- 4.3.1. Stars (High Growth, High Market Share)
- 4.3.2. Cash Cows (Low Growth, High Market Share)
- 4.3.3. Question Mark (High Growth, Low Market Share)
- 4.3.4. Dogs (Low Growth, Low Market Share)
- 4.4. Ansoff Matrix Analysis
- 4.5. Supply Chain Analysis
- 4.6. Regulatory Landscape
- 4.7. Current Market Potential and Opportunity Assessment (TAM–SAM–SOM Framework)
- 4.8. MDP Analyst Note
- 4.1. Porters Five Forces
- 5. Market Analysis, Insights and Forecast 2021-2033
- 5.1. Market Analysis, Insights and Forecast - by Type
- 5.1.1. Bio-based Biodegradables
- 5.1.1.1. Starch-based
- 5.1.1.2. Polylactic Acid (PLA)
- 5.1.1.3. Polyhydroxy Alkanoates (PHA)
- 5.1.1.4. Polyesters (PBS, PBAT, and PCL)
- 5.1.1.5. Other Bio-based Biodegradables
- 5.1.2. Bio-based Non-biodegradables
- 5.1.2.1. Bio Polyethylene Terephthalate (PET)
- 5.1.2.2. Bio Polyamides
- 5.1.2.3. Bio Polytrimethylene Terephthalate
- 5.1.2.4. Other Non-biodegradables
- 5.1.1. Bio-based Biodegradables
- 5.2. Market Analysis, Insights and Forecast - by Application
- 5.2.1. Flexible Packaging
- 5.2.2. Rigid Packaging
- 5.2.3. Automotive and Assembly Operations
- 5.2.4. Agriculture and Horticulture
- 5.2.5. Construction
- 5.2.6. Textiles
- 5.2.7. Electrical and Electronics
- 5.2.8. Other Applications
- 5.3. Market Analysis, Insights and Forecast - by Region
- 5.3.1. Asia Pacific
- 5.3.2. North America
- 5.3.3. Europe
- 5.3.4. South America
- 5.3.5. Middle East and Africa
- 5.1. Market Analysis, Insights and Forecast - by Type
- 6. Global Bioplastics Industry Analysis, Insights and Forecast, 2021-2033
- 6.1. Market Analysis, Insights and Forecast - by Type
- 6.1.1. Bio-based Biodegradables
- 6.1.1.1. Starch-based
- 6.1.1.2. Polylactic Acid (PLA)
- 6.1.1.3. Polyhydroxy Alkanoates (PHA)
- 6.1.1.4. Polyesters (PBS, PBAT, and PCL)
- 6.1.1.5. Other Bio-based Biodegradables
- 6.1.2. Bio-based Non-biodegradables
- 6.1.2.1. Bio Polyethylene Terephthalate (PET)
- 6.1.2.2. Bio Polyamides
- 6.1.2.3. Bio Polytrimethylene Terephthalate
- 6.1.2.4. Other Non-biodegradables
- 6.1.1. Bio-based Biodegradables
- 6.2. Market Analysis, Insights and Forecast - by Application
- 6.2.1. Flexible Packaging
- 6.2.2. Rigid Packaging
- 6.2.3. Automotive and Assembly Operations
- 6.2.4. Agriculture and Horticulture
- 6.2.5. Construction
- 6.2.6. Textiles
- 6.2.7. Electrical and Electronics
- 6.2.8. Other Applications
- 6.1. Market Analysis, Insights and Forecast - by Type
- 7. Asia Pacific Bioplastics Industry Analysis, Insights and Forecast, 2020-2032
- 7.1. Market Analysis, Insights and Forecast - by Type
- 7.1.1. Bio-based Biodegradables
- 7.1.1.1. Starch-based
- 7.1.1.2. Polylactic Acid (PLA)
- 7.1.1.3. Polyhydroxy Alkanoates (PHA)
- 7.1.1.4. Polyesters (PBS, PBAT, and PCL)
- 7.1.1.5. Other Bio-based Biodegradables
- 7.1.2. Bio-based Non-biodegradables
- 7.1.2.1. Bio Polyethylene Terephthalate (PET)
- 7.1.2.2. Bio Polyamides
- 7.1.2.3. Bio Polytrimethylene Terephthalate
- 7.1.2.4. Other Non-biodegradables
- 7.1.1. Bio-based Biodegradables
- 7.2. Market Analysis, Insights and Forecast - by Application
- 7.2.1. Flexible Packaging
- 7.2.2. Rigid Packaging
- 7.2.3. Automotive and Assembly Operations
- 7.2.4. Agriculture and Horticulture
- 7.2.5. Construction
- 7.2.6. Textiles
- 7.2.7. Electrical and Electronics
- 7.2.8. Other Applications
- 7.1. Market Analysis, Insights and Forecast - by Type
- 8. North America Bioplastics Industry Analysis, Insights and Forecast, 2020-2032
- 8.1. Market Analysis, Insights and Forecast - by Type
- 8.1.1. Bio-based Biodegradables
- 8.1.1.1. Starch-based
- 8.1.1.2. Polylactic Acid (PLA)
- 8.1.1.3. Polyhydroxy Alkanoates (PHA)
- 8.1.1.4. Polyesters (PBS, PBAT, and PCL)
- 8.1.1.5. Other Bio-based Biodegradables
- 8.1.2. Bio-based Non-biodegradables
- 8.1.2.1. Bio Polyethylene Terephthalate (PET)
- 8.1.2.2. Bio Polyamides
- 8.1.2.3. Bio Polytrimethylene Terephthalate
- 8.1.2.4. Other Non-biodegradables
- 8.1.1. Bio-based Biodegradables
- 8.2. Market Analysis, Insights and Forecast - by Application
- 8.2.1. Flexible Packaging
- 8.2.2. Rigid Packaging
- 8.2.3. Automotive and Assembly Operations
- 8.2.4. Agriculture and Horticulture
- 8.2.5. Construction
- 8.2.6. Textiles
- 8.2.7. Electrical and Electronics
- 8.2.8. Other Applications
- 8.1. Market Analysis, Insights and Forecast - by Type
- 9. Europe Bioplastics Industry Analysis, Insights and Forecast, 2020-2032
- 9.1. Market Analysis, Insights and Forecast - by Type
- 9.1.1. Bio-based Biodegradables
- 9.1.1.1. Starch-based
- 9.1.1.2. Polylactic Acid (PLA)
- 9.1.1.3. Polyhydroxy Alkanoates (PHA)
- 9.1.1.4. Polyesters (PBS, PBAT, and PCL)
- 9.1.1.5. Other Bio-based Biodegradables
- 9.1.2. Bio-based Non-biodegradables
- 9.1.2.1. Bio Polyethylene Terephthalate (PET)
- 9.1.2.2. Bio Polyamides
- 9.1.2.3. Bio Polytrimethylene Terephthalate
- 9.1.2.4. Other Non-biodegradables
- 9.1.1. Bio-based Biodegradables
- 9.2. Market Analysis, Insights and Forecast - by Application
- 9.2.1. Flexible Packaging
- 9.2.2. Rigid Packaging
- 9.2.3. Automotive and Assembly Operations
- 9.2.4. Agriculture and Horticulture
- 9.2.5. Construction
- 9.2.6. Textiles
- 9.2.7. Electrical and Electronics
- 9.2.8. Other Applications
- 9.1. Market Analysis, Insights and Forecast - by Type
- 10. South America Bioplastics Industry Analysis, Insights and Forecast, 2020-2032
- 10.1. Market Analysis, Insights and Forecast - by Type
- 10.1.1. Bio-based Biodegradables
- 10.1.1.1. Starch-based
- 10.1.1.2. Polylactic Acid (PLA)
- 10.1.1.3. Polyhydroxy Alkanoates (PHA)
- 10.1.1.4. Polyesters (PBS, PBAT, and PCL)
- 10.1.1.5. Other Bio-based Biodegradables
- 10.1.2. Bio-based Non-biodegradables
- 10.1.2.1. Bio Polyethylene Terephthalate (PET)
- 10.1.2.2. Bio Polyamides
- 10.1.2.3. Bio Polytrimethylene Terephthalate
- 10.1.2.4. Other Non-biodegradables
- 10.1.1. Bio-based Biodegradables
- 10.2. Market Analysis, Insights and Forecast - by Application
- 10.2.1. Flexible Packaging
- 10.2.2. Rigid Packaging
- 10.2.3. Automotive and Assembly Operations
- 10.2.4. Agriculture and Horticulture
- 10.2.5. Construction
- 10.2.6. Textiles
- 10.2.7. Electrical and Electronics
- 10.2.8. Other Applications
- 10.1. Market Analysis, Insights and Forecast - by Type
- 11. Middle East and Africa Bioplastics Industry Analysis, Insights and Forecast, 2020-2032
- 11.1. Market Analysis, Insights and Forecast - by Type
- 11.1.1. Bio-based Biodegradables
- 11.1.1.1. Starch-based
- 11.1.1.2. Polylactic Acid (PLA)
- 11.1.1.3. Polyhydroxy Alkanoates (PHA)
- 11.1.1.4. Polyesters (PBS, PBAT, and PCL)
- 11.1.1.5. Other Bio-based Biodegradables
- 11.1.2. Bio-based Non-biodegradables
- 11.1.2.1. Bio Polyethylene Terephthalate (PET)
- 11.1.2.2. Bio Polyamides
- 11.1.2.3. Bio Polytrimethylene Terephthalate
- 11.1.2.4. Other Non-biodegradables
- 11.1.1. Bio-based Biodegradables
- 11.2. Market Analysis, Insights and Forecast - by Application
- 11.2.1. Flexible Packaging
- 11.2.2. Rigid Packaging
- 11.2.3. Automotive and Assembly Operations
- 11.2.4. Agriculture and Horticulture
- 11.2.5. Construction
- 11.2.6. Textiles
- 11.2.7. Electrical and Electronics
- 11.2.8. Other Applications
- 11.1. Market Analysis, Insights and Forecast - by Type
- 12. Competitive Analysis
- 12.1. Company Profiles
- 12.1.1 Trinseo
- 12.1.1.1. Company Overview
- 12.1.1.2. Products
- 12.1.1.3. Company Financials
- 12.1.1.4. SWOT Analysis
- 12.1.2 Novamont SpA
- 12.1.2.1. Company Overview
- 12.1.2.2. Products
- 12.1.2.3. Company Financials
- 12.1.2.4. SWOT Analysis
- 12.1.3 Arkema
- 12.1.3.1. Company Overview
- 12.1.3.2. Products
- 12.1.3.3. Company Financials
- 12.1.3.4. SWOT Analysis
- 12.1.4 Total Corbion PL
- 12.1.4.1. Company Overview
- 12.1.4.2. Products
- 12.1.4.3. Company Financials
- 12.1.4.4. SWOT Analysis
- 12.1.5 Minima
- 12.1.5.1. Company Overview
- 12.1.5.2. Products
- 12.1.5.3. Company Financials
- 12.1.5.4. SWOT Analysis
- 12.1.6 Futerro
- 12.1.6.1. Company Overview
- 12.1.6.2. Products
- 12.1.6.3. Company Financials
- 12.1.6.4. SWOT Analysis
- 12.1.7 Rodenburg Biopolymers
- 12.1.7.1. Company Overview
- 12.1.7.2. Products
- 12.1.7.3. Company Financials
- 12.1.7.4. SWOT Analysis
- 12.1.8 Braskem
- 12.1.8.1. Company Overview
- 12.1.8.2. Products
- 12.1.8.3. Company Financials
- 12.1.8.4. SWOT Analysis
- 12.1.9 Indorama Ventures Public Company Limited
- 12.1.9.1. Company Overview
- 12.1.9.2. Products
- 12.1.9.3. Company Financials
- 12.1.9.4. SWOT Analysis
- 12.1.10 Natureworks LLC
- 12.1.10.1. Company Overview
- 12.1.10.2. Products
- 12.1.10.3. Company Financials
- 12.1.10.4. SWOT Analysis
- 12.1.11 BIOTEC
- 12.1.11.1. Company Overview
- 12.1.11.2. Products
- 12.1.11.3. Company Financials
- 12.1.11.4. SWOT Analysis
- 12.1.12 Danimer Scientific
- 12.1.12.1. Company Overview
- 12.1.12.2. Products
- 12.1.12.3. Company Financials
- 12.1.12.4. SWOT Analysis
- 12.1.13 BASF SE
- 12.1.13.1. Company Overview
- 12.1.13.2. Products
- 12.1.13.3. Company Financials
- 12.1.13.4. SWOT Analysis
- 12.1.1 Trinseo
- 12.2. Market Entropy
- 12.2.1 Company's Key Areas Served
- 12.2.2 Recent Developments
- 12.3. Company Market Share Analysis 2025
- 12.3.1 Top 5 Companies Market Share Analysis
- 12.3.2 Top 3 Companies Market Share Analysis
- 12.4. List of Potential Customers
- 13. Research Methodology
List of Figures
- Figure 1: Global Bioplastics Industry Revenue Breakdown (undefined, %) by Region 2025 & 2033
- Figure 2: Global Bioplastics Industry Volume Breakdown (Million, %) by Region 2025 & 2033
- Figure 3: Asia Pacific Bioplastics Industry Revenue (undefined), by Type 2025 & 2033
- Figure 4: Asia Pacific Bioplastics Industry Volume (Million), by Type 2025 & 2033
- Figure 5: Asia Pacific Bioplastics Industry Revenue Share (%), by Type 2025 & 2033
- Figure 6: Asia Pacific Bioplastics Industry Volume Share (%), by Type 2025 & 2033
- Figure 7: Asia Pacific Bioplastics Industry Revenue (undefined), by Application 2025 & 2033
- Figure 8: Asia Pacific Bioplastics Industry Volume (Million), by Application 2025 & 2033
- Figure 9: Asia Pacific Bioplastics Industry Revenue Share (%), by Application 2025 & 2033
- Figure 10: Asia Pacific Bioplastics Industry Volume Share (%), by Application 2025 & 2033
- Figure 11: Asia Pacific Bioplastics Industry Revenue (undefined), by Country 2025 & 2033
- Figure 12: Asia Pacific Bioplastics Industry Volume (Million), by Country 2025 & 2033
- Figure 13: Asia Pacific Bioplastics Industry Revenue Share (%), by Country 2025 & 2033
- Figure 14: Asia Pacific Bioplastics Industry Volume Share (%), by Country 2025 & 2033
- Figure 15: North America Bioplastics Industry Revenue (undefined), by Type 2025 & 2033
- Figure 16: North America Bioplastics Industry Volume (Million), by Type 2025 & 2033
- Figure 17: North America Bioplastics Industry Revenue Share (%), by Type 2025 & 2033
- Figure 18: North America Bioplastics Industry Volume Share (%), by Type 2025 & 2033
- Figure 19: North America Bioplastics Industry Revenue (undefined), by Application 2025 & 2033
- Figure 20: North America Bioplastics Industry Volume (Million), by Application 2025 & 2033
- Figure 21: North America Bioplastics Industry Revenue Share (%), by Application 2025 & 2033
- Figure 22: North America Bioplastics Industry Volume Share (%), by Application 2025 & 2033
- Figure 23: North America Bioplastics Industry Revenue (undefined), by Country 2025 & 2033
- Figure 24: North America Bioplastics Industry Volume (Million), by Country 2025 & 2033
- Figure 25: North America Bioplastics Industry Revenue Share (%), by Country 2025 & 2033
- Figure 26: North America Bioplastics Industry Volume Share (%), by Country 2025 & 2033
- Figure 27: Europe Bioplastics Industry Revenue (undefined), by Type 2025 & 2033
- Figure 28: Europe Bioplastics Industry Volume (Million), by Type 2025 & 2033
- Figure 29: Europe Bioplastics Industry Revenue Share (%), by Type 2025 & 2033
- Figure 30: Europe Bioplastics Industry Volume Share (%), by Type 2025 & 2033
- Figure 31: Europe Bioplastics Industry Revenue (undefined), by Application 2025 & 2033
- Figure 32: Europe Bioplastics Industry Volume (Million), by Application 2025 & 2033
- Figure 33: Europe Bioplastics Industry Revenue Share (%), by Application 2025 & 2033
- Figure 34: Europe Bioplastics Industry Volume Share (%), by Application 2025 & 2033
- Figure 35: Europe Bioplastics Industry Revenue (undefined), by Country 2025 & 2033
- Figure 36: Europe Bioplastics Industry Volume (Million), by Country 2025 & 2033
- Figure 37: Europe Bioplastics Industry Revenue Share (%), by Country 2025 & 2033
- Figure 38: Europe Bioplastics Industry Volume Share (%), by Country 2025 & 2033
- Figure 39: South America Bioplastics Industry Revenue (undefined), by Type 2025 & 2033
- Figure 40: South America Bioplastics Industry Volume (Million), by Type 2025 & 2033
- Figure 41: South America Bioplastics Industry Revenue Share (%), by Type 2025 & 2033
- Figure 42: South America Bioplastics Industry Volume Share (%), by Type 2025 & 2033
- Figure 43: South America Bioplastics Industry Revenue (undefined), by Application 2025 & 2033
- Figure 44: South America Bioplastics Industry Volume (Million), by Application 2025 & 2033
- Figure 45: South America Bioplastics Industry Revenue Share (%), by Application 2025 & 2033
- Figure 46: South America Bioplastics Industry Volume Share (%), by Application 2025 & 2033
- Figure 47: South America Bioplastics Industry Revenue (undefined), by Country 2025 & 2033
- Figure 48: South America Bioplastics Industry Volume (Million), by Country 2025 & 2033
- Figure 49: South America Bioplastics Industry Revenue Share (%), by Country 2025 & 2033
- Figure 50: South America Bioplastics Industry Volume Share (%), by Country 2025 & 2033
- Figure 51: Middle East and Africa Bioplastics Industry Revenue (undefined), by Type 2025 & 2033
- Figure 52: Middle East and Africa Bioplastics Industry Volume (Million), by Type 2025 & 2033
- Figure 53: Middle East and Africa Bioplastics Industry Revenue Share (%), by Type 2025 & 2033
- Figure 54: Middle East and Africa Bioplastics Industry Volume Share (%), by Type 2025 & 2033
- Figure 55: Middle East and Africa Bioplastics Industry Revenue (undefined), by Application 2025 & 2033
- Figure 56: Middle East and Africa Bioplastics Industry Volume (Million), by Application 2025 & 2033
- Figure 57: Middle East and Africa Bioplastics Industry Revenue Share (%), by Application 2025 & 2033
- Figure 58: Middle East and Africa Bioplastics Industry Volume Share (%), by Application 2025 & 2033
- Figure 59: Middle East and Africa Bioplastics Industry Revenue (undefined), by Country 2025 & 2033
- Figure 60: Middle East and Africa Bioplastics Industry Volume (Million), by Country 2025 & 2033
- Figure 61: Middle East and Africa Bioplastics Industry Revenue Share (%), by Country 2025 & 2033
- Figure 62: Middle East and Africa Bioplastics Industry Volume Share (%), by Country 2025 & 2033
List of Tables
- Table 1: Global Bioplastics Industry Revenue undefined Forecast, by Type 2020 & 2033
- Table 2: Global Bioplastics Industry Volume Million Forecast, by Type 2020 & 2033
- Table 3: Global Bioplastics Industry Revenue undefined Forecast, by Application 2020 & 2033
- Table 4: Global Bioplastics Industry Volume Million Forecast, by Application 2020 & 2033
- Table 5: Global Bioplastics Industry Revenue undefined Forecast, by Region 2020 & 2033
- Table 6: Global Bioplastics Industry Volume Million Forecast, by Region 2020 & 2033
- Table 7: Global Bioplastics Industry Revenue undefined Forecast, by Type 2020 & 2033
- Table 8: Global Bioplastics Industry Volume Million Forecast, by Type 2020 & 2033
- Table 9: Global Bioplastics Industry Revenue undefined Forecast, by Application 2020 & 2033
- Table 10: Global Bioplastics Industry Volume Million Forecast, by Application 2020 & 2033
- Table 11: Global Bioplastics Industry Revenue undefined Forecast, by Country 2020 & 2033
- Table 12: Global Bioplastics Industry Volume Million Forecast, by Country 2020 & 2033
- Table 13: China Bioplastics Industry Revenue (undefined) Forecast, by Application 2020 & 2033
- Table 14: China Bioplastics Industry Volume (Million) Forecast, by Application 2020 & 2033
- Table 15: India Bioplastics Industry Revenue (undefined) Forecast, by Application 2020 & 2033
- Table 16: India Bioplastics Industry Volume (Million) Forecast, by Application 2020 & 2033
- Table 17: Japan Bioplastics Industry Revenue (undefined) Forecast, by Application 2020 & 2033
- Table 18: Japan Bioplastics Industry Volume (Million) Forecast, by Application 2020 & 2033
- Table 19: South Korea Bioplastics Industry Revenue (undefined) Forecast, by Application 2020 & 2033
- Table 20: South Korea Bioplastics Industry Volume (Million) Forecast, by Application 2020 & 2033
- Table 21: Rest of Asia Pacific Bioplastics Industry Revenue (undefined) Forecast, by Application 2020 & 2033
- Table 22: Rest of Asia Pacific Bioplastics Industry Volume (Million) Forecast, by Application 2020 & 2033
- Table 23: Global Bioplastics Industry Revenue undefined Forecast, by Type 2020 & 2033
- Table 24: Global Bioplastics Industry Volume Million Forecast, by Type 2020 & 2033
- Table 25: Global Bioplastics Industry Revenue undefined Forecast, by Application 2020 & 2033
- Table 26: Global Bioplastics Industry Volume Million Forecast, by Application 2020 & 2033
- Table 27: Global Bioplastics Industry Revenue undefined Forecast, by Country 2020 & 2033
- Table 28: Global Bioplastics Industry Volume Million Forecast, by Country 2020 & 2033
- Table 29: United States Bioplastics Industry Revenue (undefined) Forecast, by Application 2020 & 2033
- Table 30: United States Bioplastics Industry Volume (Million) Forecast, by Application 2020 & 2033
- Table 31: Canada Bioplastics Industry Revenue (undefined) Forecast, by Application 2020 & 2033
- Table 32: Canada Bioplastics Industry Volume (Million) Forecast, by Application 2020 & 2033
- Table 33: Mexico Bioplastics Industry Revenue (undefined) Forecast, by Application 2020 & 2033
- Table 34: Mexico Bioplastics Industry Volume (Million) Forecast, by Application 2020 & 2033
- Table 35: Global Bioplastics Industry Revenue undefined Forecast, by Type 2020 & 2033
- Table 36: Global Bioplastics Industry Volume Million Forecast, by Type 2020 & 2033
- Table 37: Global Bioplastics Industry Revenue undefined Forecast, by Application 2020 & 2033
- Table 38: Global Bioplastics Industry Volume Million Forecast, by Application 2020 & 2033
- Table 39: Global Bioplastics Industry Revenue undefined Forecast, by Country 2020 & 2033
- Table 40: Global Bioplastics Industry Volume Million Forecast, by Country 2020 & 2033
- Table 41: Germany Bioplastics Industry Revenue (undefined) Forecast, by Application 2020 & 2033
- Table 42: Germany Bioplastics Industry Volume (Million) Forecast, by Application 2020 & 2033
- Table 43: United Kingdom Bioplastics Industry Revenue (undefined) Forecast, by Application 2020 & 2033
- Table 44: United Kingdom Bioplastics Industry Volume (Million) Forecast, by Application 2020 & 2033
- Table 45: Italy Bioplastics Industry Revenue (undefined) Forecast, by Application 2020 & 2033
- Table 46: Italy Bioplastics Industry Volume (Million) Forecast, by Application 2020 & 2033
- Table 47: France Bioplastics Industry Revenue (undefined) Forecast, by Application 2020 & 2033
- Table 48: France Bioplastics Industry Volume (Million) Forecast, by Application 2020 & 2033
- Table 49: Rest of Europe Bioplastics Industry Revenue (undefined) Forecast, by Application 2020 & 2033
- Table 50: Rest of Europe Bioplastics Industry Volume (Million) Forecast, by Application 2020 & 2033
- Table 51: Global Bioplastics Industry Revenue undefined Forecast, by Type 2020 & 2033
- Table 52: Global Bioplastics Industry Volume Million Forecast, by Type 2020 & 2033
- Table 53: Global Bioplastics Industry Revenue undefined Forecast, by Application 2020 & 2033
- Table 54: Global Bioplastics Industry Volume Million Forecast, by Application 2020 & 2033
- Table 55: Global Bioplastics Industry Revenue undefined Forecast, by Country 2020 & 2033
- Table 56: Global Bioplastics Industry Volume Million Forecast, by Country 2020 & 2033
- Table 57: Brazil Bioplastics Industry Revenue (undefined) Forecast, by Application 2020 & 2033
- Table 58: Brazil Bioplastics Industry Volume (Million) Forecast, by Application 2020 & 2033
- Table 59: Argentina Bioplastics Industry Revenue (undefined) Forecast, by Application 2020 & 2033
- Table 60: Argentina Bioplastics Industry Volume (Million) Forecast, by Application 2020 & 2033
- Table 61: Rest of South America Bioplastics Industry Revenue (undefined) Forecast, by Application 2020 & 2033
- Table 62: Rest of South America Bioplastics Industry Volume (Million) Forecast, by Application 2020 & 2033
- Table 63: Global Bioplastics Industry Revenue undefined Forecast, by Type 2020 & 2033
- Table 64: Global Bioplastics Industry Volume Million Forecast, by Type 2020 & 2033
- Table 65: Global Bioplastics Industry Revenue undefined Forecast, by Application 2020 & 2033
- Table 66: Global Bioplastics Industry Volume Million Forecast, by Application 2020 & 2033
- Table 67: Global Bioplastics Industry Revenue undefined Forecast, by Country 2020 & 2033
- Table 68: Global Bioplastics Industry Volume Million Forecast, by Country 2020 & 2033
- Table 69: Saudi Arabia Bioplastics Industry Revenue (undefined) Forecast, by Application 2020 & 2033
- Table 70: Saudi Arabia Bioplastics Industry Volume (Million) Forecast, by Application 2020 & 2033
- Table 71: South Africa Bioplastics Industry Revenue (undefined) Forecast, by Application 2020 & 2033
- Table 72: South Africa Bioplastics Industry Volume (Million) Forecast, by Application 2020 & 2033
- Table 73: Rest of Middle East and Africa Bioplastics Industry Revenue (undefined) Forecast, by Application 2020 & 2033
- Table 74: Rest of Middle East and Africa Bioplastics Industry Volume (Million) Forecast, by Application 2020 & 2033
Frequently Asked Questions
1. What is the projected Compound Annual Growth Rate (CAGR) of the Bioplastics Industry?
The projected CAGR is approximately 17.6%.
2. Which companies are prominent players in the Bioplastics Industry?
Key companies in the market include Trinseo, Novamont SpA, Arkema, Total Corbion PL, Minima, Futerro, Rodenburg Biopolymers, Braskem, Indorama Ventures Public Company Limited, Natureworks LLC, BIOTEC, Danimer Scientific, BASF SE.
3. What are the main segments of the Bioplastics Industry?
The market segments include Type, Application.
4. Can you provide details about the market size?
The market size is estimated to be USD XXX N/A as of 2022.
5. What are some drivers contributing to market growth?
Environmental Factors Encouraging a Paradigm Shift; Growing Demand for Bioplastics in Packaging.
6. What are the notable trends driving market growth?
Flexible Packaging is Expected to Dominate the Market.
7. Are there any restraints impacting market growth?
Availability of Cheaper Alternatives.
8. Can you provide examples of recent developments in the market?
August 2022: BASF Venture Capital GmbH, the corporate venture company of BASF SE, Germany, and Aqua-Spark, a Dutch investment fund, is investing in Sea6 Energy Pvt. Ltd. Sea6 Energy is a leader in the production and processing of tropical red seaweed. Sea6 Energy is also working on developing bioplastics and biofuels based on red seaweed.
9. What pricing options are available for accessing the report?
Pricing options include single-user, multi-user, and enterprise licenses priced at USD 4750, USD 5250, and USD 8750 respectively.
10. Is the market size provided in terms of value or volume?
The market size is provided in terms of value, measured in N/A and volume, measured in Million.
11. Are there any specific market keywords associated with the report?
Yes, the market keyword associated with the report is "Bioplastics Industry," which aids in identifying and referencing the specific market segment covered.
12. How do I determine which pricing option suits my needs best?
The pricing options vary based on user requirements and access needs. Individual users may opt for single-user licenses, while businesses requiring broader access may choose multi-user or enterprise licenses for cost-effective access to the report.
13. Are there any additional resources or data provided in the Bioplastics Industry report?
While the report offers comprehensive insights, it's advisable to review the specific contents or supplementary materials provided to ascertain if additional resources or data are available.
14. How can I stay updated on further developments or reports in the Bioplastics Industry?
To stay informed about further developments, trends, and reports in the Bioplastics Industry, consider subscribing to industry newsletters, following relevant companies and organizations, or regularly checking reputable industry news sources and publications.
Methodology
Step 1 - Identification of Relevant Samples Size from Population Database


Step 2 - Approaches for Defining Global Market Size (Value, Volume* & Price*)

Note*: In applicable scenarios
Step 3 - Data Sources
Primary Research
- Web Analytics
- Survey Reports
- Research Institute
- Latest Research Reports
- Opinion Leaders
Secondary Research
- Annual Reports
- White Paper
- Latest Press Release
- Industry Association
- Paid Database
- Investor Presentations

Step 4 - Data Triangulation
Involves using different sources of information in order to increase the validity of a study
These sources are likely to be stakeholders in a program - participants, other researchers, program staff, other community members, and so on.
Then we put all data in single framework & apply various statistical tools to find out the dynamic on the market.
During the analysis stage, feedback from the stakeholder groups would be compared to determine areas of agreement as well as areas of divergence