

Key Insights
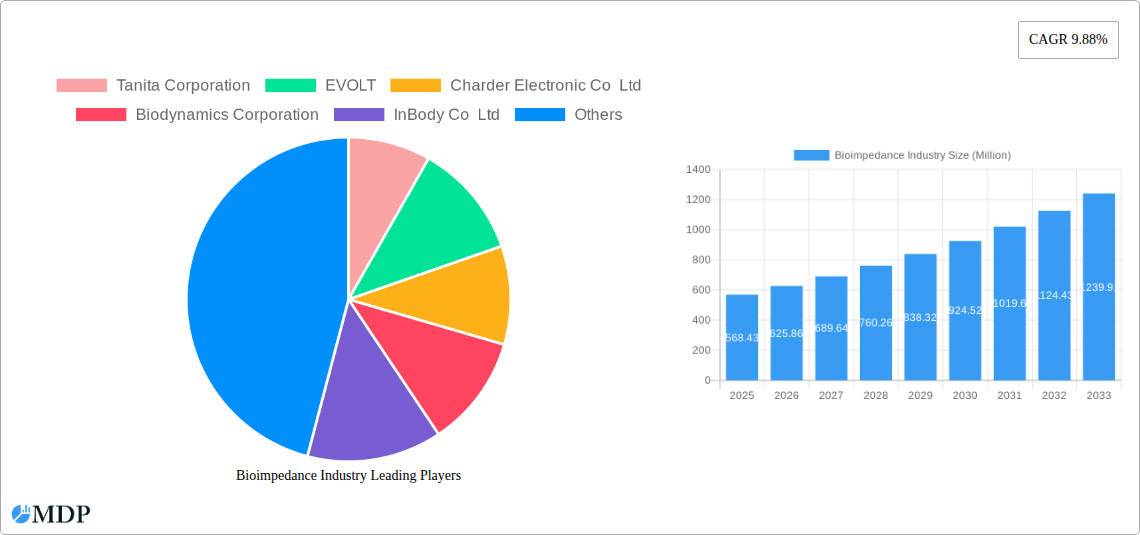
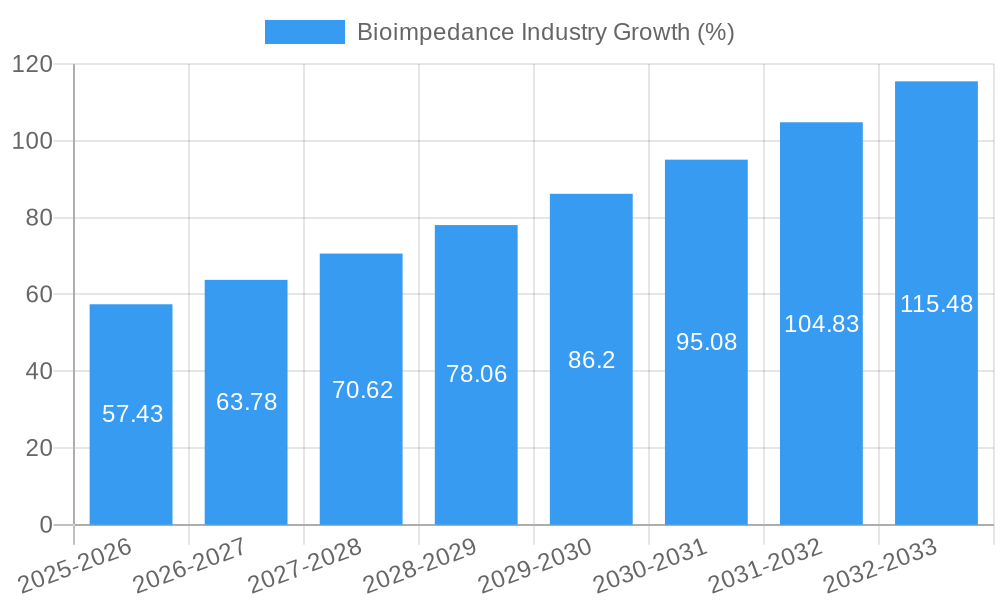
The global bioimpedance market, valued at $568.43 million in 2025, is poised for robust growth, exhibiting a Compound Annual Growth Rate (CAGR) of 9.88% from 2025 to 2033. This expansion is driven by several key factors. The increasing prevalence of obesity and related metabolic disorders globally fuels demand for accurate and non-invasive body composition analysis. Furthermore, advancements in technology, leading to more precise and user-friendly devices, are contributing to market growth. The rising adoption of bioimpedance analysis in healthcare settings, including hospitals and clinics, for monitoring patient health and managing chronic conditions, further strengthens market prospects. The availability of both wired and wireless modalities caters to diverse user preferences and application needs, enhancing market accessibility. Growth is further fueled by the increasing integration of bioimpedance technology into fitness trackers and smart scales, expanding its reach into the consumer market. However, factors like the relatively high cost of advanced bioimpedance devices and potential inaccuracies in measurements due to individual variations (hydration levels, etc.) can act as market restraints.
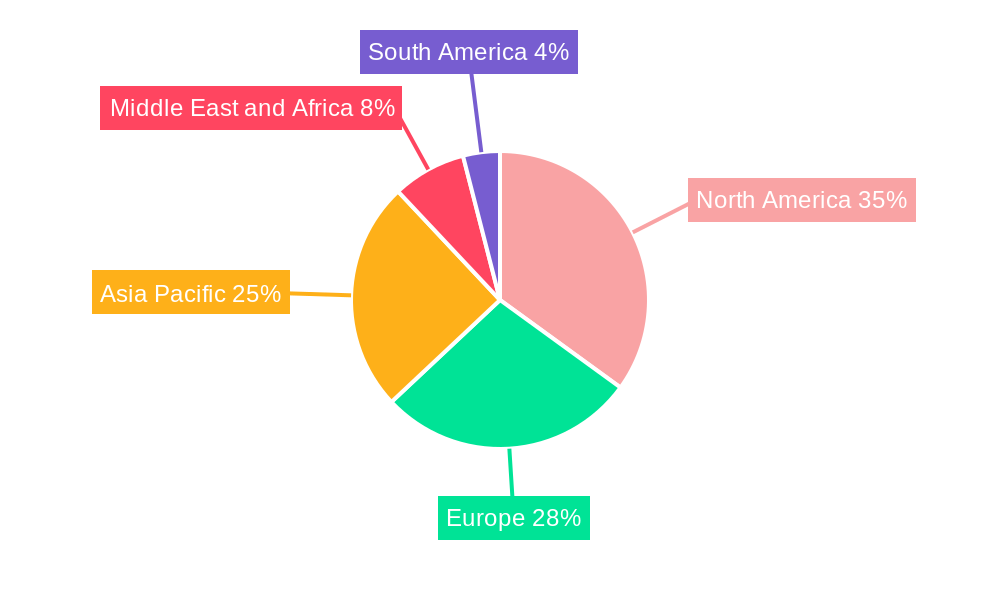
Market segmentation reveals significant opportunities. The wireless modality segment dominates due to its convenience and portability, while the whole-body measurement application holds a larger market share compared to segmental measurements, reflecting a broader assessment of body composition. Among product types, dual-frequency and multiple-frequency devices are gaining traction owing to their improved accuracy and ability to differentiate between fat-free mass and fat mass components. Geographically, North America and Europe currently hold significant market share due to higher healthcare spending and technological advancements. However, the Asia-Pacific region is projected to witness substantial growth driven by rising health awareness and increasing disposable incomes. Leading players like Tanita Corporation, InBody Co Ltd, and Omron Corporation are continuously innovating and expanding their product portfolios to capitalize on this burgeoning market. The competitive landscape is dynamic, with companies focusing on product differentiation through improved accuracy, advanced features, and convenient user interfaces.
Bioimpedance Industry Market Report: 2019-2033
This comprehensive report provides a detailed analysis of the Bioimpedance Industry, offering actionable insights for stakeholders across the value chain. With a study period spanning 2019-2033, a base year of 2025, and a forecast period of 2025-2033, this report leverages rigorous research to illuminate market dynamics, trends, and future potential. The global Bioimpedance market is projected to reach xx Million by 2033, exhibiting a CAGR of xx% during the forecast period. This report covers key players including Tanita Corporation, EVOLT, Charder Electronic Co Ltd, Biodynamics Corporation, InBody Co Ltd, Fook Tin Group Holding Ltd, Omron Corporation, Bioparhom, Lumsail Industrial Inc, Biotekna, Akern, and Bodystat Ltd, and analyzes market segments across modality (Wireless, Wired), application (Segmental Body Measurement, Whole Body Measurement), and product type (Single-frequency, Dual-frequency, Multiple-frequency).
Bioimpedance Industry Market Dynamics & Concentration
The Bioimpedance industry exhibits a moderately concentrated market structure, with a few major players holding significant market share. Tanita Corporation and InBody Co Ltd are currently estimated to hold the largest shares, each commanding approximately xx% of the global market in 2025, driven by strong brand recognition and diverse product portfolios. However, the market is witnessing increasing competition from emerging players, particularly those focusing on innovative product offerings and technological advancements.
- Market Concentration: The Herfindahl-Hirschman Index (HHI) is estimated at xx in 2025, indicating a moderately concentrated market.
- Innovation Drivers: Miniaturization, improved accuracy, integration with wearable technology, and the development of advanced algorithms are key innovation drivers.
- Regulatory Frameworks: Regulatory compliance concerning medical device approvals varies across geographies, impacting market entry and product commercialization.
- Product Substitutes: Other body composition measurement methods, such as DEXA scans, exist, but bioimpedance offers cost-effectiveness and ease of use.
- End-User Trends: Increasing health consciousness among consumers and the rising prevalence of obesity and related metabolic disorders are driving demand.
- M&A Activities: The number of M&A deals in the industry has been relatively low in recent years, averaging xx deals per year during 2019-2024, but is expected to increase slightly in the coming years as companies seek to expand their market reach and product lines.
Bioimpedance Industry Industry Trends & Analysis
The Bioimpedance market is experiencing robust growth, propelled by several key factors. Technological advancements, particularly in wireless technology and miniaturization, are enabling the development of more user-friendly and portable devices. This trend is further amplified by increasing consumer awareness of health and wellness, leading to higher adoption rates of bioimpedance devices for personal health monitoring. The market is also seeing a shift towards multiple-frequency devices, offering more accurate and comprehensive body composition analysis. The global market is projected to reach xx Million by 2033, driven by a CAGR of xx% from 2025 to 2033. Market penetration of bioimpedance devices in home healthcare settings is expected to increase significantly during the forecast period, reaching approximately xx% by 2033. Competitive dynamics are characterized by ongoing innovation, strategic partnerships, and a focus on developing value-added services alongside the core technology.
Leading Markets & Segments in Bioimpedance Industry
The North American and European markets currently dominate the global bioimpedance industry, accounting for approximately xx% of the total market value in 2025. This dominance is attributed to high healthcare expenditure, greater awareness of health and wellness, and a more established healthcare infrastructure. However, the Asia-Pacific region is poised for significant growth due to rising disposable incomes, increasing health concerns, and expanding adoption of advanced healthcare technologies.
- Dominant Regions: North America and Europe
- Key Drivers:
- North America & Europe: High healthcare expenditure, strong regulatory frameworks, established healthcare infrastructure, higher consumer awareness.
- Asia-Pacific: Rising disposable incomes, increasing health consciousness, expanding healthcare infrastructure.
- Segmental Analysis:
- Modality: Wireless segment is growing faster than wired, driven by user preference for portability and convenience.
- Application: Whole body measurement holds the larger share but segmental measurement is gaining traction in specialized applications.
- Product Type: Multiple-frequency devices are gradually gaining popularity due to their improved accuracy.
Bioimpedance Industry Product Developments
Recent product developments showcase a clear trend towards enhanced accuracy, miniaturization, and integration with other health monitoring technologies. For instance, the launch of Xiaomi's eight-electrode body composition scale in 2022 demonstrates the increasing sophistication of consumer-grade devices. Similarly, Analog Devices' MAX30009 analog front end highlights the growing use of bioimpedance in clinical and wearable applications. These advancements are improving the market fit by offering more user-friendly and accurate body composition analysis tools.
Key Drivers of Bioimpedance Industry Growth
Several factors are driving the growth of the bioimpedance industry. Technological advancements, such as miniaturization and improved accuracy, are expanding market applications. The rising prevalence of chronic diseases is increasing the demand for effective health monitoring solutions. Moreover, favorable government regulations and supportive reimbursement policies further stimulate market growth.
Challenges in the Bioimpedance Industry Market
Despite its growth potential, the bioimpedance industry faces several challenges. Stringent regulatory approvals can hinder market entry for new players. Supply chain disruptions and fluctuating raw material prices impact manufacturing costs. Competition from other body composition assessment methods, and ensuring the accuracy of measurements amidst variations in individual hydration levels, also pose significant challenges. These hurdles are estimated to impact the market growth rate by approximately xx% in the coming years.
Emerging Opportunities in Bioimpedance Industry
The future of the bioimpedance market is bright. Integration with artificial intelligence (AI) and machine learning for improved data analysis will present new opportunities. Strategic partnerships among device manufacturers, healthcare providers, and software developers are likely to improve accessibility and streamline data interpretation. Expanding into developing economies will unlock considerable market potential.
Leading Players in the Bioimpedance Industry Sector
- Tanita Corporation
- EVOLT
- Charder Electronic Co Ltd
- Biodynamics Corporation
- InBody Co Ltd
- Fook Tin Group Holding Ltd
- Omron Corporation
- Bioparhom
- Lumsail Industrial Inc
- Biotekna
- Akern
- Bodystat Ltd
Key Milestones in Bioimpedance Industry Industry
- September 2022: Xiaomi launched an eight-electrode body composition scale with dual-frequency bioimpedance technology, offering up to 35 body composition analysis reports, expanding the consumer market.
- March 2022: Analog Devices launched the MAX30009 analog front end for wearable bioimpedance monitoring, enabling more accurate clinical-grade vital sign measurements.
Strategic Outlook for Bioimpedance Industry Market
The bioimpedance market is poised for continued expansion, driven by technological innovation and the rising demand for personalized healthcare. Strategic partnerships, technological advancements like AI integration, and a focus on expanding into underserved markets will be key to unlocking future market potential. Companies that invest in research and development, focusing on enhancing accuracy, improving user experience, and expanding applications, will be best positioned for success in the years to come.
Bioimpedance Industry Segmentation
-
1. Product Type
- 1.1. Single-frequency
- 1.2. Dual-frequency
- 1.3. Multiple-frequency
-
2. Modality
- 2.1. Wireless
- 2.2. Wired
-
3. Application
- 3.1. Segmental Body Measurement
- 3.2. Whole Body Measurement
Bioimpedance Industry Segmentation By Geography
-
1. North America
- 1.1. United States
- 1.2. Canada
- 1.3. Mexico
-
2. Europe
- 2.1. Germany
- 2.2. United Kingdom
- 2.3. France
- 2.4. Italy
- 2.5. Spain
- 2.6. Rest of Europe
-
3. Asia Pacific
- 3.1. China
- 3.2. Japan
- 3.3. India
- 3.4. Australia
- 3.5. South Korea
- 3.6. Rest of Asia Pacific
-
4. Middle East and Africa
- 4.1. GCC
- 4.2. South Africa
- 4.3. Rest of Middle East and Africa
-
5. South America
- 5.1. Brazil
- 5.2. Argentina
- 5.3. Rest of South America
Bioimpedance Industry REPORT HIGHLIGHTS
| Aspects | Details |
|---|---|
| Study Period | 2019-2033 |
| Base Year | 2024 |
| Estimated Year | 2025 |
| Forecast Period | 2025-2033 |
| Historical Period | 2019-2024 |
| Growth Rate | CAGR of 9.88% from 2019-2033 |
| Segmentation |
|
Table of Contents
- 1. Introduction
- 1.1. Research Scope
- 1.2. Market Segmentation
- 1.3. Research Methodology
- 1.4. Definitions and Assumptions
- 2. Executive Summary
- 2.1. Introduction
- 3. Market Dynamics
- 3.1. Introduction
- 3.2. Market Drivers
- 3.2.1. Increasing Prevalence of Metabolic Disorders; Initiatives by Governments to Promote Healthy Lifestyles; Technological Advancements
- 3.3. Market Restrains
- 3.3.1. Inconsistency and Inaccuracy in Different Analyzers
- 3.4. Market Trends
- 3.4.1. Multi-frequency Bioimpedance Analysis Segment Expected to Witness the Highest Growth During the Forecast Period
- 4. Market Factor Analysis
- 4.1. Porters Five Forces
- 4.2. Supply/Value Chain
- 4.3. PESTEL analysis
- 4.4. Market Entropy
- 4.5. Patent/Trademark Analysis
- 5. Global Bioimpedance Industry Analysis, Insights and Forecast, 2019-2031
- 5.1. Market Analysis, Insights and Forecast - by Product Type
- 5.1.1. Single-frequency
- 5.1.2. Dual-frequency
- 5.1.3. Multiple-frequency
- 5.2. Market Analysis, Insights and Forecast - by Modality
- 5.2.1. Wireless
- 5.2.2. Wired
- 5.3. Market Analysis, Insights and Forecast - by Application
- 5.3.1. Segmental Body Measurement
- 5.3.2. Whole Body Measurement
- 5.4. Market Analysis, Insights and Forecast - by Region
- 5.4.1. North America
- 5.4.2. Europe
- 5.4.3. Asia Pacific
- 5.4.4. Middle East and Africa
- 5.4.5. South America
- 5.1. Market Analysis, Insights and Forecast - by Product Type
- 6. North America Bioimpedance Industry Analysis, Insights and Forecast, 2019-2031
- 6.1. Market Analysis, Insights and Forecast - by Product Type
- 6.1.1. Single-frequency
- 6.1.2. Dual-frequency
- 6.1.3. Multiple-frequency
- 6.2. Market Analysis, Insights and Forecast - by Modality
- 6.2.1. Wireless
- 6.2.2. Wired
- 6.3. Market Analysis, Insights and Forecast - by Application
- 6.3.1. Segmental Body Measurement
- 6.3.2. Whole Body Measurement
- 6.1. Market Analysis, Insights and Forecast - by Product Type
- 7. Europe Bioimpedance Industry Analysis, Insights and Forecast, 2019-2031
- 7.1. Market Analysis, Insights and Forecast - by Product Type
- 7.1.1. Single-frequency
- 7.1.2. Dual-frequency
- 7.1.3. Multiple-frequency
- 7.2. Market Analysis, Insights and Forecast - by Modality
- 7.2.1. Wireless
- 7.2.2. Wired
- 7.3. Market Analysis, Insights and Forecast - by Application
- 7.3.1. Segmental Body Measurement
- 7.3.2. Whole Body Measurement
- 7.1. Market Analysis, Insights and Forecast - by Product Type
- 8. Asia Pacific Bioimpedance Industry Analysis, Insights and Forecast, 2019-2031
- 8.1. Market Analysis, Insights and Forecast - by Product Type
- 8.1.1. Single-frequency
- 8.1.2. Dual-frequency
- 8.1.3. Multiple-frequency
- 8.2. Market Analysis, Insights and Forecast - by Modality
- 8.2.1. Wireless
- 8.2.2. Wired
- 8.3. Market Analysis, Insights and Forecast - by Application
- 8.3.1. Segmental Body Measurement
- 8.3.2. Whole Body Measurement
- 8.1. Market Analysis, Insights and Forecast - by Product Type
- 9. Middle East and Africa Bioimpedance Industry Analysis, Insights and Forecast, 2019-2031
- 9.1. Market Analysis, Insights and Forecast - by Product Type
- 9.1.1. Single-frequency
- 9.1.2. Dual-frequency
- 9.1.3. Multiple-frequency
- 9.2. Market Analysis, Insights and Forecast - by Modality
- 9.2.1. Wireless
- 9.2.2. Wired
- 9.3. Market Analysis, Insights and Forecast - by Application
- 9.3.1. Segmental Body Measurement
- 9.3.2. Whole Body Measurement
- 9.1. Market Analysis, Insights and Forecast - by Product Type
- 10. South America Bioimpedance Industry Analysis, Insights and Forecast, 2019-2031
- 10.1. Market Analysis, Insights and Forecast - by Product Type
- 10.1.1. Single-frequency
- 10.1.2. Dual-frequency
- 10.1.3. Multiple-frequency
- 10.2. Market Analysis, Insights and Forecast - by Modality
- 10.2.1. Wireless
- 10.2.2. Wired
- 10.3. Market Analysis, Insights and Forecast - by Application
- 10.3.1. Segmental Body Measurement
- 10.3.2. Whole Body Measurement
- 10.1. Market Analysis, Insights and Forecast - by Product Type
- 11. North America Bioimpedance Industry Analysis, Insights and Forecast, 2019-2031
- 11.1. Market Analysis, Insights and Forecast - By Country/Sub-region
- 11.1.1. undefined
- 12. Europe Bioimpedance Industry Analysis, Insights and Forecast, 2019-2031
- 12.1. Market Analysis, Insights and Forecast - By Country/Sub-region
- 12.1.1. undefined
- 13. Asia Pacific Bioimpedance Industry Analysis, Insights and Forecast, 2019-2031
- 13.1. Market Analysis, Insights and Forecast - By Country/Sub-region
- 13.1.1. undefined
- 14. Middle East and Africa Bioimpedance Industry Analysis, Insights and Forecast, 2019-2031
- 14.1. Market Analysis, Insights and Forecast - By Country/Sub-region
- 14.1.1. undefined
- 15. South America Bioimpedance Industry Analysis, Insights and Forecast, 2019-2031
- 15.1. Market Analysis, Insights and Forecast - By Country/Sub-region
- 15.1.1. undefined
- 16. Competitive Analysis
- 16.1. Global Market Share Analysis 2024
- 16.2. Company Profiles
- 16.2.1 Tanita Corporation
- 16.2.1.1. Overview
- 16.2.1.2. Products
- 16.2.1.3. SWOT Analysis
- 16.2.1.4. Recent Developments
- 16.2.1.5. Financials (Based on Availability)
- 16.2.2 EVOLT
- 16.2.2.1. Overview
- 16.2.2.2. Products
- 16.2.2.3. SWOT Analysis
- 16.2.2.4. Recent Developments
- 16.2.2.5. Financials (Based on Availability)
- 16.2.3 Charder Electronic Co Ltd
- 16.2.3.1. Overview
- 16.2.3.2. Products
- 16.2.3.3. SWOT Analysis
- 16.2.3.4. Recent Developments
- 16.2.3.5. Financials (Based on Availability)
- 16.2.4 Biodynamics Corporation
- 16.2.4.1. Overview
- 16.2.4.2. Products
- 16.2.4.3. SWOT Analysis
- 16.2.4.4. Recent Developments
- 16.2.4.5. Financials (Based on Availability)
- 16.2.5 InBody Co Ltd
- 16.2.5.1. Overview
- 16.2.5.2. Products
- 16.2.5.3. SWOT Analysis
- 16.2.5.4. Recent Developments
- 16.2.5.5. Financials (Based on Availability)
- 16.2.6 Fook Tin Group Holding Ltd
- 16.2.6.1. Overview
- 16.2.6.2. Products
- 16.2.6.3. SWOT Analysis
- 16.2.6.4. Recent Developments
- 16.2.6.5. Financials (Based on Availability)
- 16.2.7 Omron Corporation
- 16.2.7.1. Overview
- 16.2.7.2. Products
- 16.2.7.3. SWOT Analysis
- 16.2.7.4. Recent Developments
- 16.2.7.5. Financials (Based on Availability)
- 16.2.8 Bioparhom
- 16.2.8.1. Overview
- 16.2.8.2. Products
- 16.2.8.3. SWOT Analysis
- 16.2.8.4. Recent Developments
- 16.2.8.5. Financials (Based on Availability)
- 16.2.9 Lumsail Industrial Inc
- 16.2.9.1. Overview
- 16.2.9.2. Products
- 16.2.9.3. SWOT Analysis
- 16.2.9.4. Recent Developments
- 16.2.9.5. Financials (Based on Availability)
- 16.2.10 Biotekna
- 16.2.10.1. Overview
- 16.2.10.2. Products
- 16.2.10.3. SWOT Analysis
- 16.2.10.4. Recent Developments
- 16.2.10.5. Financials (Based on Availability)
- 16.2.11 Akern
- 16.2.11.1. Overview
- 16.2.11.2. Products
- 16.2.11.3. SWOT Analysis
- 16.2.11.4. Recent Developments
- 16.2.11.5. Financials (Based on Availability)
- 16.2.12 Bodystat Ltd
- 16.2.12.1. Overview
- 16.2.12.2. Products
- 16.2.12.3. SWOT Analysis
- 16.2.12.4. Recent Developments
- 16.2.12.5. Financials (Based on Availability)
- 16.2.1 Tanita Corporation
List of Figures
- Figure 1: Global Bioimpedance Industry Revenue Breakdown (Million, %) by Region 2024 & 2032
- Figure 2: Global Bioimpedance Industry Volume Breakdown (K Unit, %) by Region 2024 & 2032
- Figure 3: North America Bioimpedance Industry Revenue (Million), by Country 2024 & 2032
- Figure 4: North America Bioimpedance Industry Volume (K Unit), by Country 2024 & 2032
- Figure 5: North America Bioimpedance Industry Revenue Share (%), by Country 2024 & 2032
- Figure 6: North America Bioimpedance Industry Volume Share (%), by Country 2024 & 2032
- Figure 7: Europe Bioimpedance Industry Revenue (Million), by Country 2024 & 2032
- Figure 8: Europe Bioimpedance Industry Volume (K Unit), by Country 2024 & 2032
- Figure 9: Europe Bioimpedance Industry Revenue Share (%), by Country 2024 & 2032
- Figure 10: Europe Bioimpedance Industry Volume Share (%), by Country 2024 & 2032
- Figure 11: Asia Pacific Bioimpedance Industry Revenue (Million), by Country 2024 & 2032
- Figure 12: Asia Pacific Bioimpedance Industry Volume (K Unit), by Country 2024 & 2032
- Figure 13: Asia Pacific Bioimpedance Industry Revenue Share (%), by Country 2024 & 2032
- Figure 14: Asia Pacific Bioimpedance Industry Volume Share (%), by Country 2024 & 2032
- Figure 15: Middle East and Africa Bioimpedance Industry Revenue (Million), by Country 2024 & 2032
- Figure 16: Middle East and Africa Bioimpedance Industry Volume (K Unit), by Country 2024 & 2032
- Figure 17: Middle East and Africa Bioimpedance Industry Revenue Share (%), by Country 2024 & 2032
- Figure 18: Middle East and Africa Bioimpedance Industry Volume Share (%), by Country 2024 & 2032
- Figure 19: South America Bioimpedance Industry Revenue (Million), by Country 2024 & 2032
- Figure 20: South America Bioimpedance Industry Volume (K Unit), by Country 2024 & 2032
- Figure 21: South America Bioimpedance Industry Revenue Share (%), by Country 2024 & 2032
- Figure 22: South America Bioimpedance Industry Volume Share (%), by Country 2024 & 2032
- Figure 23: North America Bioimpedance Industry Revenue (Million), by Product Type 2024 & 2032
- Figure 24: North America Bioimpedance Industry Volume (K Unit), by Product Type 2024 & 2032
- Figure 25: North America Bioimpedance Industry Revenue Share (%), by Product Type 2024 & 2032
- Figure 26: North America Bioimpedance Industry Volume Share (%), by Product Type 2024 & 2032
- Figure 27: North America Bioimpedance Industry Revenue (Million), by Modality 2024 & 2032
- Figure 28: North America Bioimpedance Industry Volume (K Unit), by Modality 2024 & 2032
- Figure 29: North America Bioimpedance Industry Revenue Share (%), by Modality 2024 & 2032
- Figure 30: North America Bioimpedance Industry Volume Share (%), by Modality 2024 & 2032
- Figure 31: North America Bioimpedance Industry Revenue (Million), by Application 2024 & 2032
- Figure 32: North America Bioimpedance Industry Volume (K Unit), by Application 2024 & 2032
- Figure 33: North America Bioimpedance Industry Revenue Share (%), by Application 2024 & 2032
- Figure 34: North America Bioimpedance Industry Volume Share (%), by Application 2024 & 2032
- Figure 35: North America Bioimpedance Industry Revenue (Million), by Country 2024 & 2032
- Figure 36: North America Bioimpedance Industry Volume (K Unit), by Country 2024 & 2032
- Figure 37: North America Bioimpedance Industry Revenue Share (%), by Country 2024 & 2032
- Figure 38: North America Bioimpedance Industry Volume Share (%), by Country 2024 & 2032
- Figure 39: Europe Bioimpedance Industry Revenue (Million), by Product Type 2024 & 2032
- Figure 40: Europe Bioimpedance Industry Volume (K Unit), by Product Type 2024 & 2032
- Figure 41: Europe Bioimpedance Industry Revenue Share (%), by Product Type 2024 & 2032
- Figure 42: Europe Bioimpedance Industry Volume Share (%), by Product Type 2024 & 2032
- Figure 43: Europe Bioimpedance Industry Revenue (Million), by Modality 2024 & 2032
- Figure 44: Europe Bioimpedance Industry Volume (K Unit), by Modality 2024 & 2032
- Figure 45: Europe Bioimpedance Industry Revenue Share (%), by Modality 2024 & 2032
- Figure 46: Europe Bioimpedance Industry Volume Share (%), by Modality 2024 & 2032
- Figure 47: Europe Bioimpedance Industry Revenue (Million), by Application 2024 & 2032
- Figure 48: Europe Bioimpedance Industry Volume (K Unit), by Application 2024 & 2032
- Figure 49: Europe Bioimpedance Industry Revenue Share (%), by Application 2024 & 2032
- Figure 50: Europe Bioimpedance Industry Volume Share (%), by Application 2024 & 2032
- Figure 51: Europe Bioimpedance Industry Revenue (Million), by Country 2024 & 2032
- Figure 52: Europe Bioimpedance Industry Volume (K Unit), by Country 2024 & 2032
- Figure 53: Europe Bioimpedance Industry Revenue Share (%), by Country 2024 & 2032
- Figure 54: Europe Bioimpedance Industry Volume Share (%), by Country 2024 & 2032
- Figure 55: Asia Pacific Bioimpedance Industry Revenue (Million), by Product Type 2024 & 2032
- Figure 56: Asia Pacific Bioimpedance Industry Volume (K Unit), by Product Type 2024 & 2032
- Figure 57: Asia Pacific Bioimpedance Industry Revenue Share (%), by Product Type 2024 & 2032
- Figure 58: Asia Pacific Bioimpedance Industry Volume Share (%), by Product Type 2024 & 2032
- Figure 59: Asia Pacific Bioimpedance Industry Revenue (Million), by Modality 2024 & 2032
- Figure 60: Asia Pacific Bioimpedance Industry Volume (K Unit), by Modality 2024 & 2032
- Figure 61: Asia Pacific Bioimpedance Industry Revenue Share (%), by Modality 2024 & 2032
- Figure 62: Asia Pacific Bioimpedance Industry Volume Share (%), by Modality 2024 & 2032
- Figure 63: Asia Pacific Bioimpedance Industry Revenue (Million), by Application 2024 & 2032
- Figure 64: Asia Pacific Bioimpedance Industry Volume (K Unit), by Application 2024 & 2032
- Figure 65: Asia Pacific Bioimpedance Industry Revenue Share (%), by Application 2024 & 2032
- Figure 66: Asia Pacific Bioimpedance Industry Volume Share (%), by Application 2024 & 2032
- Figure 67: Asia Pacific Bioimpedance Industry Revenue (Million), by Country 2024 & 2032
- Figure 68: Asia Pacific Bioimpedance Industry Volume (K Unit), by Country 2024 & 2032
- Figure 69: Asia Pacific Bioimpedance Industry Revenue Share (%), by Country 2024 & 2032
- Figure 70: Asia Pacific Bioimpedance Industry Volume Share (%), by Country 2024 & 2032
- Figure 71: Middle East and Africa Bioimpedance Industry Revenue (Million), by Product Type 2024 & 2032
- Figure 72: Middle East and Africa Bioimpedance Industry Volume (K Unit), by Product Type 2024 & 2032
- Figure 73: Middle East and Africa Bioimpedance Industry Revenue Share (%), by Product Type 2024 & 2032
- Figure 74: Middle East and Africa Bioimpedance Industry Volume Share (%), by Product Type 2024 & 2032
- Figure 75: Middle East and Africa Bioimpedance Industry Revenue (Million), by Modality 2024 & 2032
- Figure 76: Middle East and Africa Bioimpedance Industry Volume (K Unit), by Modality 2024 & 2032
- Figure 77: Middle East and Africa Bioimpedance Industry Revenue Share (%), by Modality 2024 & 2032
- Figure 78: Middle East and Africa Bioimpedance Industry Volume Share (%), by Modality 2024 & 2032
- Figure 79: Middle East and Africa Bioimpedance Industry Revenue (Million), by Application 2024 & 2032
- Figure 80: Middle East and Africa Bioimpedance Industry Volume (K Unit), by Application 2024 & 2032
- Figure 81: Middle East and Africa Bioimpedance Industry Revenue Share (%), by Application 2024 & 2032
- Figure 82: Middle East and Africa Bioimpedance Industry Volume Share (%), by Application 2024 & 2032
- Figure 83: Middle East and Africa Bioimpedance Industry Revenue (Million), by Country 2024 & 2032
- Figure 84: Middle East and Africa Bioimpedance Industry Volume (K Unit), by Country 2024 & 2032
- Figure 85: Middle East and Africa Bioimpedance Industry Revenue Share (%), by Country 2024 & 2032
- Figure 86: Middle East and Africa Bioimpedance Industry Volume Share (%), by Country 2024 & 2032
- Figure 87: South America Bioimpedance Industry Revenue (Million), by Product Type 2024 & 2032
- Figure 88: South America Bioimpedance Industry Volume (K Unit), by Product Type 2024 & 2032
- Figure 89: South America Bioimpedance Industry Revenue Share (%), by Product Type 2024 & 2032
- Figure 90: South America Bioimpedance Industry Volume Share (%), by Product Type 2024 & 2032
- Figure 91: South America Bioimpedance Industry Revenue (Million), by Modality 2024 & 2032
- Figure 92: South America Bioimpedance Industry Volume (K Unit), by Modality 2024 & 2032
- Figure 93: South America Bioimpedance Industry Revenue Share (%), by Modality 2024 & 2032
- Figure 94: South America Bioimpedance Industry Volume Share (%), by Modality 2024 & 2032
- Figure 95: South America Bioimpedance Industry Revenue (Million), by Application 2024 & 2032
- Figure 96: South America Bioimpedance Industry Volume (K Unit), by Application 2024 & 2032
- Figure 97: South America Bioimpedance Industry Revenue Share (%), by Application 2024 & 2032
- Figure 98: South America Bioimpedance Industry Volume Share (%), by Application 2024 & 2032
- Figure 99: South America Bioimpedance Industry Revenue (Million), by Country 2024 & 2032
- Figure 100: South America Bioimpedance Industry Volume (K Unit), by Country 2024 & 2032
- Figure 101: South America Bioimpedance Industry Revenue Share (%), by Country 2024 & 2032
- Figure 102: South America Bioimpedance Industry Volume Share (%), by Country 2024 & 2032
List of Tables
- Table 1: Global Bioimpedance Industry Revenue Million Forecast, by Region 2019 & 2032
- Table 2: Global Bioimpedance Industry Volume K Unit Forecast, by Region 2019 & 2032
- Table 3: Global Bioimpedance Industry Revenue Million Forecast, by Product Type 2019 & 2032
- Table 4: Global Bioimpedance Industry Volume K Unit Forecast, by Product Type 2019 & 2032
- Table 5: Global Bioimpedance Industry Revenue Million Forecast, by Modality 2019 & 2032
- Table 6: Global Bioimpedance Industry Volume K Unit Forecast, by Modality 2019 & 2032
- Table 7: Global Bioimpedance Industry Revenue Million Forecast, by Application 2019 & 2032
- Table 8: Global Bioimpedance Industry Volume K Unit Forecast, by Application 2019 & 2032
- Table 9: Global Bioimpedance Industry Revenue Million Forecast, by Region 2019 & 2032
- Table 10: Global Bioimpedance Industry Volume K Unit Forecast, by Region 2019 & 2032
- Table 11: Global Bioimpedance Industry Revenue Million Forecast, by Country 2019 & 2032
- Table 12: Global Bioimpedance Industry Volume K Unit Forecast, by Country 2019 & 2032
- Table 13: Global Bioimpedance Industry Revenue Million Forecast, by Country 2019 & 2032
- Table 14: Global Bioimpedance Industry Volume K Unit Forecast, by Country 2019 & 2032
- Table 15: Global Bioimpedance Industry Revenue Million Forecast, by Country 2019 & 2032
- Table 16: Global Bioimpedance Industry Volume K Unit Forecast, by Country 2019 & 2032
- Table 17: Global Bioimpedance Industry Revenue Million Forecast, by Country 2019 & 2032
- Table 18: Global Bioimpedance Industry Volume K Unit Forecast, by Country 2019 & 2032
- Table 19: Global Bioimpedance Industry Revenue Million Forecast, by Country 2019 & 2032
- Table 20: Global Bioimpedance Industry Volume K Unit Forecast, by Country 2019 & 2032
- Table 21: Global Bioimpedance Industry Revenue Million Forecast, by Product Type 2019 & 2032
- Table 22: Global Bioimpedance Industry Volume K Unit Forecast, by Product Type 2019 & 2032
- Table 23: Global Bioimpedance Industry Revenue Million Forecast, by Modality 2019 & 2032
- Table 24: Global Bioimpedance Industry Volume K Unit Forecast, by Modality 2019 & 2032
- Table 25: Global Bioimpedance Industry Revenue Million Forecast, by Application 2019 & 2032
- Table 26: Global Bioimpedance Industry Volume K Unit Forecast, by Application 2019 & 2032
- Table 27: Global Bioimpedance Industry Revenue Million Forecast, by Country 2019 & 2032
- Table 28: Global Bioimpedance Industry Volume K Unit Forecast, by Country 2019 & 2032
- Table 29: United States Bioimpedance Industry Revenue (Million) Forecast, by Application 2019 & 2032
- Table 30: United States Bioimpedance Industry Volume (K Unit) Forecast, by Application 2019 & 2032
- Table 31: Canada Bioimpedance Industry Revenue (Million) Forecast, by Application 2019 & 2032
- Table 32: Canada Bioimpedance Industry Volume (K Unit) Forecast, by Application 2019 & 2032
- Table 33: Mexico Bioimpedance Industry Revenue (Million) Forecast, by Application 2019 & 2032
- Table 34: Mexico Bioimpedance Industry Volume (K Unit) Forecast, by Application 2019 & 2032
- Table 35: Global Bioimpedance Industry Revenue Million Forecast, by Product Type 2019 & 2032
- Table 36: Global Bioimpedance Industry Volume K Unit Forecast, by Product Type 2019 & 2032
- Table 37: Global Bioimpedance Industry Revenue Million Forecast, by Modality 2019 & 2032
- Table 38: Global Bioimpedance Industry Volume K Unit Forecast, by Modality 2019 & 2032
- Table 39: Global Bioimpedance Industry Revenue Million Forecast, by Application 2019 & 2032
- Table 40: Global Bioimpedance Industry Volume K Unit Forecast, by Application 2019 & 2032
- Table 41: Global Bioimpedance Industry Revenue Million Forecast, by Country 2019 & 2032
- Table 42: Global Bioimpedance Industry Volume K Unit Forecast, by Country 2019 & 2032
- Table 43: Germany Bioimpedance Industry Revenue (Million) Forecast, by Application 2019 & 2032
- Table 44: Germany Bioimpedance Industry Volume (K Unit) Forecast, by Application 2019 & 2032
- Table 45: United Kingdom Bioimpedance Industry Revenue (Million) Forecast, by Application 2019 & 2032
- Table 46: United Kingdom Bioimpedance Industry Volume (K Unit) Forecast, by Application 2019 & 2032
- Table 47: France Bioimpedance Industry Revenue (Million) Forecast, by Application 2019 & 2032
- Table 48: France Bioimpedance Industry Volume (K Unit) Forecast, by Application 2019 & 2032
- Table 49: Italy Bioimpedance Industry Revenue (Million) Forecast, by Application 2019 & 2032
- Table 50: Italy Bioimpedance Industry Volume (K Unit) Forecast, by Application 2019 & 2032
- Table 51: Spain Bioimpedance Industry Revenue (Million) Forecast, by Application 2019 & 2032
- Table 52: Spain Bioimpedance Industry Volume (K Unit) Forecast, by Application 2019 & 2032
- Table 53: Rest of Europe Bioimpedance Industry Revenue (Million) Forecast, by Application 2019 & 2032
- Table 54: Rest of Europe Bioimpedance Industry Volume (K Unit) Forecast, by Application 2019 & 2032
- Table 55: Global Bioimpedance Industry Revenue Million Forecast, by Product Type 2019 & 2032
- Table 56: Global Bioimpedance Industry Volume K Unit Forecast, by Product Type 2019 & 2032
- Table 57: Global Bioimpedance Industry Revenue Million Forecast, by Modality 2019 & 2032
- Table 58: Global Bioimpedance Industry Volume K Unit Forecast, by Modality 2019 & 2032
- Table 59: Global Bioimpedance Industry Revenue Million Forecast, by Application 2019 & 2032
- Table 60: Global Bioimpedance Industry Volume K Unit Forecast, by Application 2019 & 2032
- Table 61: Global Bioimpedance Industry Revenue Million Forecast, by Country 2019 & 2032
- Table 62: Global Bioimpedance Industry Volume K Unit Forecast, by Country 2019 & 2032
- Table 63: China Bioimpedance Industry Revenue (Million) Forecast, by Application 2019 & 2032
- Table 64: China Bioimpedance Industry Volume (K Unit) Forecast, by Application 2019 & 2032
- Table 65: Japan Bioimpedance Industry Revenue (Million) Forecast, by Application 2019 & 2032
- Table 66: Japan Bioimpedance Industry Volume (K Unit) Forecast, by Application 2019 & 2032
- Table 67: India Bioimpedance Industry Revenue (Million) Forecast, by Application 2019 & 2032
- Table 68: India Bioimpedance Industry Volume (K Unit) Forecast, by Application 2019 & 2032
- Table 69: Australia Bioimpedance Industry Revenue (Million) Forecast, by Application 2019 & 2032
- Table 70: Australia Bioimpedance Industry Volume (K Unit) Forecast, by Application 2019 & 2032
- Table 71: South Korea Bioimpedance Industry Revenue (Million) Forecast, by Application 2019 & 2032
- Table 72: South Korea Bioimpedance Industry Volume (K Unit) Forecast, by Application 2019 & 2032
- Table 73: Rest of Asia Pacific Bioimpedance Industry Revenue (Million) Forecast, by Application 2019 & 2032
- Table 74: Rest of Asia Pacific Bioimpedance Industry Volume (K Unit) Forecast, by Application 2019 & 2032
- Table 75: Global Bioimpedance Industry Revenue Million Forecast, by Product Type 2019 & 2032
- Table 76: Global Bioimpedance Industry Volume K Unit Forecast, by Product Type 2019 & 2032
- Table 77: Global Bioimpedance Industry Revenue Million Forecast, by Modality 2019 & 2032
- Table 78: Global Bioimpedance Industry Volume K Unit Forecast, by Modality 2019 & 2032
- Table 79: Global Bioimpedance Industry Revenue Million Forecast, by Application 2019 & 2032
- Table 80: Global Bioimpedance Industry Volume K Unit Forecast, by Application 2019 & 2032
- Table 81: Global Bioimpedance Industry Revenue Million Forecast, by Country 2019 & 2032
- Table 82: Global Bioimpedance Industry Volume K Unit Forecast, by Country 2019 & 2032
- Table 83: GCC Bioimpedance Industry Revenue (Million) Forecast, by Application 2019 & 2032
- Table 84: GCC Bioimpedance Industry Volume (K Unit) Forecast, by Application 2019 & 2032
- Table 85: South Africa Bioimpedance Industry Revenue (Million) Forecast, by Application 2019 & 2032
- Table 86: South Africa Bioimpedance Industry Volume (K Unit) Forecast, by Application 2019 & 2032
- Table 87: Rest of Middle East and Africa Bioimpedance Industry Revenue (Million) Forecast, by Application 2019 & 2032
- Table 88: Rest of Middle East and Africa Bioimpedance Industry Volume (K Unit) Forecast, by Application 2019 & 2032
- Table 89: Global Bioimpedance Industry Revenue Million Forecast, by Product Type 2019 & 2032
- Table 90: Global Bioimpedance Industry Volume K Unit Forecast, by Product Type 2019 & 2032
- Table 91: Global Bioimpedance Industry Revenue Million Forecast, by Modality 2019 & 2032
- Table 92: Global Bioimpedance Industry Volume K Unit Forecast, by Modality 2019 & 2032
- Table 93: Global Bioimpedance Industry Revenue Million Forecast, by Application 2019 & 2032
- Table 94: Global Bioimpedance Industry Volume K Unit Forecast, by Application 2019 & 2032
- Table 95: Global Bioimpedance Industry Revenue Million Forecast, by Country 2019 & 2032
- Table 96: Global Bioimpedance Industry Volume K Unit Forecast, by Country 2019 & 2032
- Table 97: Brazil Bioimpedance Industry Revenue (Million) Forecast, by Application 2019 & 2032
- Table 98: Brazil Bioimpedance Industry Volume (K Unit) Forecast, by Application 2019 & 2032
- Table 99: Argentina Bioimpedance Industry Revenue (Million) Forecast, by Application 2019 & 2032
- Table 100: Argentina Bioimpedance Industry Volume (K Unit) Forecast, by Application 2019 & 2032
- Table 101: Rest of South America Bioimpedance Industry Revenue (Million) Forecast, by Application 2019 & 2032
- Table 102: Rest of South America Bioimpedance Industry Volume (K Unit) Forecast, by Application 2019 & 2032
Frequently Asked Questions
1. What is the projected Compound Annual Growth Rate (CAGR) of the Bioimpedance Industry?
The projected CAGR is approximately 9.88%.
2. Which companies are prominent players in the Bioimpedance Industry?
Key companies in the market include Tanita Corporation, EVOLT, Charder Electronic Co Ltd, Biodynamics Corporation, InBody Co Ltd, Fook Tin Group Holding Ltd, Omron Corporation, Bioparhom, Lumsail Industrial Inc , Biotekna, Akern, Bodystat Ltd.
3. What are the main segments of the Bioimpedance Industry?
The market segments include Product Type, Modality, Application.
4. Can you provide details about the market size?
The market size is estimated to be USD 568.43 Million as of 2022.
5. What are some drivers contributing to market growth?
Increasing Prevalence of Metabolic Disorders; Initiatives by Governments to Promote Healthy Lifestyles; Technological Advancements.
6. What are the notable trends driving market growth?
Multi-frequency Bioimpedance Analysis Segment Expected to Witness the Highest Growth During the Forecast Period.
7. Are there any restraints impacting market growth?
Inconsistency and Inaccuracy in Different Analyzers.
8. Can you provide examples of recent developments in the market?
September 2022: Xiaomi launched an eight-electrode body composition scale that provides up to 35 body composition analysis reports. This body fat scale adopts a dual-frequency bioimpedance measurement technology to provide accurate measurements.
9. What pricing options are available for accessing the report?
Pricing options include single-user, multi-user, and enterprise licenses priced at USD 4750, USD 5250, and USD 8750 respectively.
10. Is the market size provided in terms of value or volume?
The market size is provided in terms of value, measured in Million and volume, measured in K Unit.
11. Are there any specific market keywords associated with the report?
Yes, the market keyword associated with the report is "Bioimpedance Industry," which aids in identifying and referencing the specific market segment covered.
12. How do I determine which pricing option suits my needs best?
The pricing options vary based on user requirements and access needs. Individual users may opt for single-user licenses, while businesses requiring broader access may choose multi-user or enterprise licenses for cost-effective access to the report.
13. Are there any additional resources or data provided in the Bioimpedance Industry report?
While the report offers comprehensive insights, it's advisable to review the specific contents or supplementary materials provided to ascertain if additional resources or data are available.
14. How can I stay updated on further developments or reports in the Bioimpedance Industry?
To stay informed about further developments, trends, and reports in the Bioimpedance Industry, consider subscribing to industry newsletters, following relevant companies and organizations, or regularly checking reputable industry news sources and publications.
Methodology
Step 1 - Identification of Relevant Samples Size from Population Database


Step 2 - Approaches for Defining Global Market Size (Value, Volume* & Price*)

Note*: In applicable scenarios
Step 3 - Data Sources
Primary Research
- Web Analytics
- Survey Reports
- Research Institute
- Latest Research Reports
- Opinion Leaders
Secondary Research
- Annual Reports
- White Paper
- Latest Press Release
- Industry Association
- Paid Database
- Investor Presentations

Step 4 - Data Triangulation
Involves using different sources of information in order to increase the validity of a study
These sources are likely to be stakeholders in a program - participants, other researchers, program staff, other community members, and so on.
Then we put all data in single framework & apply various statistical tools to find out the dynamic on the market.
During the analysis stage, feedback from the stakeholder groups would be compared to determine areas of agreement as well as areas of divergence
